*For correspondence:
[email protected] (JGM); [email protected] (MRB)
†These authors contributed equally to this work
Present address: ‡Department of Anesthesiology, Washington University, St. Louis, United States;§Department of Pharmaceutical and
Administrative Sciences, St. Louis College of Pharmacy, St. Louis, United States;¶Center for Clinical Pharmacology,
Washington University School of Medicine and St. Louis College of Pharmacy, St. Louis, United States;**Trevena Inc., King of Prussia, United States
Competing interest:See page 17
Funding:See page 17
Received:27 May 2016 Accepted:13 July 2017 Published:14 July 2017
Reviewing editor: Liqun Luo, Howard Hughes Medical Institute, Stanford University, United States
Copyright McCall et al. This article is distributed under the terms of theCreative Commons Attribution License,which permits unrestricted use and redistribution provided that the original author and source are credited.
Locus coeruleus to basolateral amygdala
noradrenergic projections promote
anxiety-like behavior
Jordan G McCall
1,2,3,4*
†‡§¶, Edward R Siuda
1,2,3,4†**, Dionnet L Bhatti
1,4,
Lamley A Lawson
1, Zoe A McElligott
5,6, Garret D Stuber
5,7,8,
Michael R Bruchas
1,2,3,4,9*
1
Department of Anesthesiology, Division of Basic Research, Washington University
School of Medicine, St. Louis, United States;
2Washington University Pain Center,
Washington University School of Medicine, St. Louis, United States;
3Department of
Neuroscience, Washington University School of Medicine, St. Louis, United States;
4Division of Biology and Biomedical Sciences, Washington University School of
Medicine, St. Louis, United States;
5Department of Psychiatry, University of North
Carolina, Chapel Hill, United States;
6Bowles Center for Alcohol Studies, University
of North Carolina, Chapel Hill, United States;
7Department of Cell Biology and
Physiology, University of North Carolina, Chapel Hill, United States;
8Neuroscience
Center, University of North Carolina, Chapel Hill, United States;
9Department of
Biomedical Engineering, Washington University, St. Louis, United States
Abstract
Increased tonic activity of locus coeruleus noradrenergic (LC-NE) neurons induces anxiety-like and aversive behavior. While some information is known about the afferent circuitry that endogenously drives this neural activity and behavior, the downstream receptors and anatomical projections that mediate these acute risk aversive behavioral states via the LC-NE system remain unresolved. Here we use a combination of retrograde tracing, fast-scan cyclic voltammetry, electrophysiology, and in vivo optogenetics with localized pharmacology to identify neural substrates downstream of increased tonic LC-NE activity in mice. We demonstrate that photostimulation of LC-NE fibers in the BLA evokes norepinephrine release in the basolateral amygdala (BLA), alters BLA neuronal activity, conditions aversion, and increases anxiety-like behavior. Additionally, we report thatb-adrenergic receptors mediate the anxiety-like phenotype of increased NE release in the BLA. These studies begin to illustrate how the complex efferent system of the LC-NE system selectively mediates behavior through distinct receptor and projection-selective mechanisms.DOI: 10.7554/eLife.18247.001
Introduction
The locus coeruleus noradrenergic system (LC-NE) comprises a widespread projection network throughout the central nervous system capable of modulating a diverse range of behaviors including arousal, learning, pain modulation, and stress-induced negative affective states (Berridge and
Waterhouse, 2003;Sara, 2009). Understanding the neural circuit basis for how this nearly
ubiqui-tous neuromodulatory network exerts influence on negative affect is a critical step towards therapeu-tically targeting stress-induced neuropsychiatric disorders (Schwarz and Luo, 2015;Schwarz et al.,
2015;Reyes et al., 2015;McCall et al., 2015;Arnsten et al., 2015;Kebschull et al., 2016). One
important candidate anatomical substrate for the widely known role of norepinephrine (NE) in affec-tive behaviors (Berridge and Waterhouse, 2003;Schwarz et al., 2015;Davis, 1992;Valentino and
Aston-Jones, 2010;Robertson et al., 2016,2013; Grissom and Bhatnagar, 2011;Siuda et al.,
2015a, 2016; Plummer et al., 2015). The BLA is notable for integrating sensory information to
encode and drive diverse and opposing affective behaviors including anxiety, fear, aversive, and reward behaviors (Kim et al., 2013;Stuber et al., 2011;Tye et al., 2011;Namburi et al., 2015;
Gore et al., 2015;Belova et al., 2007;Beyeler et al., 2016; Wolff et al., 2014;Bermudez and
Schultz, 2010;Bruchas et al., 2009;Knoll et al., 2011;Sugase-Miyamoto and Richmond, 2005;
Crowley et al., 2016;Sears et al., 2013;Roozendaal et al., 2008,2006;Miranda et al., 2007).
Notable efforts to uncover the role of the BLA and adrenergic signaling in consolidation of fear memories have been reported (Sears et al., 2013;Roozendaal et al., 2008,2006), as well as recent studies showing that acute stress activates BLA adrenergic receptors (agnostic to the source of NE) to promote anxiety and other stress-related behaviors (Miranda et al., 2007;Buffalari and Grace,
2009a,2009b;Chang and Grace, 2013). Similarly acute stress paradigms cause selective activation
of LC-NE neurons (McCall et al., 2015). Together, there have been significant efforts to examine how source-independent noradrenergic (importantly, there are multiple sources of NE innervating the BLA (Robertson et al., 2016;Plummer et al., 2015) signaling in the BLA can alter synaptic plas-ticity, fear encoding, and memory consolidation, yet few studies have directly examined how the neuromodulatory LC-NE system utilizes BLA output to alter acute risk averse behaviors, such as anxi-ety (Grissom and Bhatnagar, 2011;Buffalari and Grace, 2009a,2009b,2007).
Downstream and independent of this projection, recent studies have demonstrated that direct activation of both basolateral amygdala (BLA) cell bodies or their projections is both anxiogenic and socially aversive (Siuda et al., 2015a,2016;Tye et al., 2011;Felix-Ortiz et al., 2013,2016;
Felix-Ortiz and Tye, 2014). Furthermore, it has also been demonstrated that increasing BLA excitatory
output through Gas G-protein activation, and more specifically, b-adrenergic receptor signaling causes acute social anxiety (Siuda et al., 2016). Separately, noradrenergic cell firing in the LC has been shown to increase in the context of stressful stimuli (McCall et al., 2015; Abercrombie and
Jacobs, 1987a,1987b;Aston-Jones et al., 1999;Mana and Grace, 1997). While the anatomical
projections from the LC and their cell types have been studied for several years, the precise mecha-nisms by which fibers from the LC can directly influence BLA function to promote negative affective behaviors are not understood. Specifically, how LC-BLA projections generate affective behavioral responses through specific receptor systems and modulation of cell activity is unknown.
To determine the role of locus coeruleus noradrenergic influence on BLA function and negative affective behavior we optogenetically manipulated LC-NE inputs into the BLA, directly testing whether NE is released from LC terminals into the BLA and whether this terminal stimulation can drive anxiety-like and aversive behavioral responses. We demonstrate that photostimulation of LC projections to the basolateral amygdala releases NE and that this photostimulation evokes down-stream modulation of neuronal activity in BLA neurons that project to anxiogenic brain regions. Stim-ulation of these fibers is sufficient to produce conditioned aversion and the stimStim-ulation-induced increased noradrenergic tone is sufficient to produce anxiety-like behavior mediated by local b-adrenergic receptor activity (b-ARs) in the BLA. Taken together, we report a previously undefined role for LC-BLA projections in mediating negative affective behavior through activation ofb-ARs.
Results
Genetic and anatomical isolation of BLA-projection LC-NE neurons
Our previous work demonstrated that increased tonic LC-NE activity induces anxiety-like and aver-sive behavioral responses (McCall et al., 2015;Siuda et al., 2015a), we next sought to test whether these same behaviors can be generated by stimulating LC-NE fibers at localized projections in the BLA. To examine the potential sources of NE from the LC to the BLA we identified and isolated the projection using two distinct retrograde tracing approaches. First, we injected the tracer Fluorogold into the BLA of wild-type mice (Figure 1A). Consistent with previous studies, this non-selective retro-grade tracing approach revealed known inputs into the BLA from the LC (Robertson et al., 2016;Asan, 1998;Fallon et al., 1978) (Figure 1B). We next used a dual injection strategy to anatomically
for tyrosine hydroxylase, the rate-limiting enzyme for catecholamine synthesis (ThIRES-Cre mice)
(Savitt et al., 2005). Here, we injected a red retrobead tracer into the BLA and the green-labeled
adeno-associated virus, AAV5-DIO-Ef1a-ChR2(H134)-eYFP, into the LC (ThIRES-Cre::LC-BLA:ChR2;
Figure 1C and D). In these animals, we identified BLA-projectingTh+LC neurons with the presence
of both fluorophores in the same cells (Figure 1D). Next, to examineTh+terminal innervation of the BLA, we injected the cell-filling, Cre-dependent reporter AAV5-DIO-Ef1a-eYFP in the LC ofTh IRES-Cre mice (ThIRES-Cre::LC-BLA:eYFP) (Figure 1E). Here we clearly observed labeled LC neurons
(Figure 1F and G) and their projection fibers terminating in the BLA (Figure 1H). To further
corrobo-rate these findings, we examined recent projection experiments performed by the Allen Brain Insti-tute Mouse Connectivity (ABIMC) project that also genetically and anatomically isolate this projection (Oh et al., 2014). In three different experiments from three different genetic models, we observed LC-BLA projections that are qualitatively similar to our own observations (Figure 1—figure
supplement 1A–L). We present these findings here for clarity and ease of independent comparison,
but this work was performed by ABIMC. Together, these anatomical studies identify a discrete pro-jection ofTh+neurons from the LC that potentially release endogenous NE into the BLA.
Optogenetic activation of LC-BLA terminals releases norepinephrine
into the BLA
Using the same viral optogenetic strategy as above, we examined whether photostimulation of
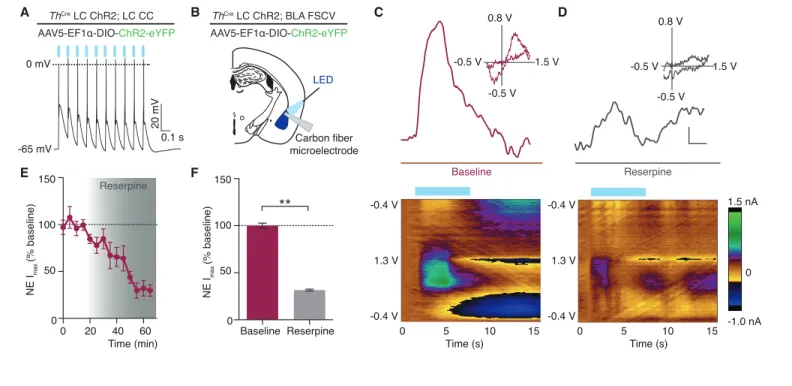
ThIRES-Cre::LC-BLA:ChR2 projections resulted in NE release at terminals. We validated functional ChR2 expression using whole-cell current clamp recordings of Th+ LC neurons. As, we previously demonstrated (McCall et al., 2015), this targeting method and photostimulation protocol was suffi-cient to generate action potentials at the LC cell bodies (Figure 2A). Next, we used a carbon fiber microelectrode (CFME) to perform fast-scan cyclic voltammetry (FSCV) in the BLA during LC-NE
A B C D
LV
LC BLA
C57BL/6j Fluorogold into BLA
LV
LC
ThCre LC DIO-ChR2
Retrobeads into the BLA
E
BLA
LV
LC
ThCre LC eYFP
BLA
AAV5-EF1Į-DIO-eYFP
BLA
D
VL M Nissl
eYFP 4V
Nissl
eYFP
TH
LC
V L
M
H G
F
TH
Fluorogold 4V
TH eYFP
Retrobeads Merge C ThCre
Retrobeads
BLA
ld
Nissl eYFP D LC VL
MD
LC
Figure 1.Identifying a LC input to the BLA. (A) Cartoon depicting fluorgold tracing strategy. (B) Representative image (selected from three injected mice) shows robust retrograde labeling of the LC from injection in the BLA (green = pseudocolored Fluorgold, tyrosine hydroxylase = red). Arrowhead
indicates example co-localization. Scale bar = 100mm. 4V = 4th ventricle. The TH-cells dorsal and ventral to the LC are likely part of the medial
parabrachial nucleus which has previously identified projections to the BLA (Saper and Loewy, 1980). (C) Cartoon depicting dual injection tracing
strategy for CTB-594 and DIO-ChR2-eYFP. (D) Representative images (selected from three injected mice) shows retrograde labeling in LC of red
retrobeads and anterograde labeling of TH+ cells (green) (Nissl=blue). Arrowhead indicates example co-localization. Scale bar = 100mm (E) Cartoon
depicting anterograde tracing strategy. (F–H) Coronal images depict robust eYFP (yellow) labeling in the LC (F and G) and BLA (H) of the same mouse
(scale bars = (F) 50mm, (G) 10mm, (H) 20mm. Inset (F), tyrosine hydroxylase = red, scale bar = 25mm.
DOI: 10.7554/eLife.18247.002
The following figure supplement is available for figure 1:
Figure supplement 1.Further identification of LC input to the BLA.
terminal stimulation. Using the extended waveform method (see methods) in acute brain slices of
ThIRES-Cre::LC-BLA:ChR2 animals, we stimulated slices with 30 5 ms light pulses from a 473 nm LED, at 10 Hz (Figure 2B). Photostimulation of BLA slices, produced characteristic cyclic voltammograms and uptake consistent with NE (McElligott et al., 2013; Herr et al., 2012) (t1/2 = 2.0 ± 0.2 s,
Figure 2C and D). Following a 20 min baseline, 1mM reserpine (an inhibitor of vesicular monoamine
transporters) was perfused on the slices to deplete catecholamines from the axon terminals
(Dahlstroem et al., 1965). Reserpine treatment significantly attenuated the measured oxidative
cur-rents (31.6±1.0% of baseline,Figure 2E and F) further confirming optically-evoked catecholamine release in this isolatedThIRES-Cre::LC-BLA:ChR2 projection. These findings suggest that optogenetic manipulation of LC-BLA terminals causes release of endogenous NE from the LC into the BLA.
In vivo photostimulation of LC-BLA terminals modulates BLA activity
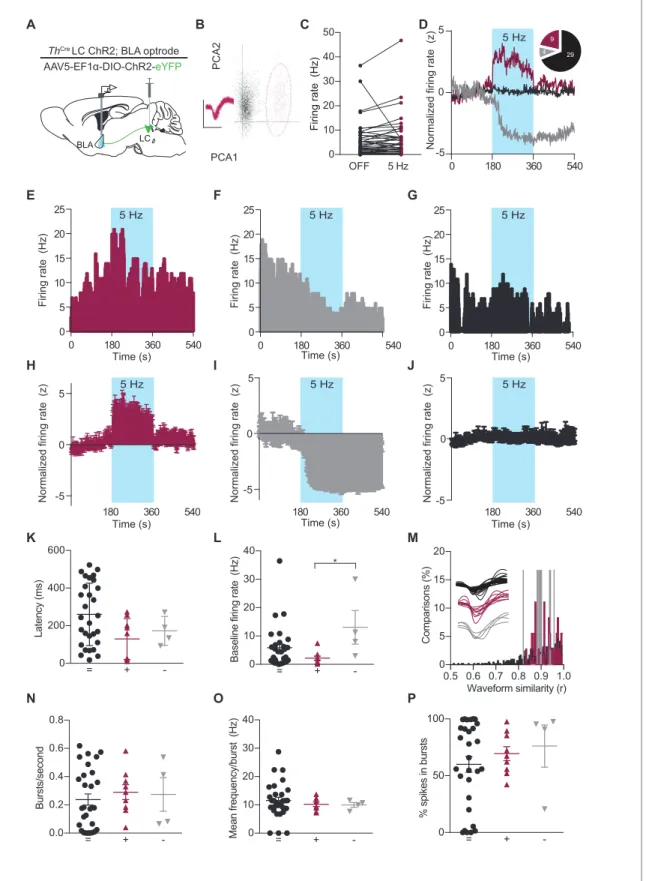
BLA neurons have well reported responses to exogenous application of NE (Buffalari and Grace, 2007), but their response to endogenous NE release, explicitly from the LC, has not been previously defined. We next determined whether the optically-evoked endogenous catecholamine release would mimic the responses of BLA neurons to exogenous NE. To do so, we examined BLA single-unit activity in ThIRES-Cre::LC-BLA:ChR2 mice using 16-channel microelectrode arrays coupled to a fiber optic implant (optrode arrays) (McCall et al., 2015;Sparta et al., 2011). These optrode arrays were used to isolate and record BLA single-unit activity before, during, and after photostimulation ofThIRES-Cre::LC-BLA:ChR2 projections (473 nm, 5 Hz, 10 ms pulse width) (Figure 3A and B). In these experiments photostimulation of ThIRES-Cre::LC-BLA:ChR2 terminals caused an increase in firingNE I
max
(% baseline)
0 50 100 150
0 20 40 60 Reserpine
Time (min)
1.5 nA
0
-1.0 nA -0.4 V
1.3 V
-0.4 V
Reserpine
Time (s)
0 5 10 15
Time (s)
0 5 10 15
Carbon fiber microelectrode
LED
1.5 V 0.8 V
-0.5 V
-0.5 V 1.5 V
0.8 V
-0.5 V -0.5 V
A C D
E
-0.4 V
1.3 V
-0.4 V
ThCre LC ChR2; BLA FSCV
AAV5-EF1њ-DIO-ChR2-eYFP
0 50 100 150
NE I
max
(% baseline)
0 mV
-65 mV
B
F
Baseline Reserpine
**
Baseline 0.1 s
20 mV
ThCre LC ChR2; LC CC
AAV5-EF1њ-DIO-ChR2-eYFP
Figure 2.Photostimulation of LC terminals in the BLA releases norepinephrine. (A) LC neuron firing reliably to 10 Hz optical stimulation (CC=whole cell
current clamp). (B) Fast scan cyclic voltammetry (FSCV) schematic. (C–D) Oxidative and reductive currents (scale bar 2 s by 0.4 nA), with representative
cyclic voltammograms (inset) and representative color plots (below) in response to photostimulation are attenuated by reserpine (1mM). Color plots for
baseline and after reserpine (1mM): Files were collected over 15 s (X-axis) where the carbon fiber microelectrode was ramped with a triangular
waveform from 0.4V to 1.3V and back to 0.4V at 400 V/S (Y-axis) and sampled at 10 Hz. 10 Hz, 473 nm blue LED stimulation onset at 2 s. Oxidative
currents (nA) are positive in direction and reductive currents are negative (see color coded scale bar on right). (E) Attenuation in NE oxidative current in
response to reserpine (1mM) n = 3 pairs; mean±S.E.M). (F) Average of first 20 min and last 15 min in (E) (Data represented as mean±SEM, Paired
Student’s t-tests to baseline, Mean difference = 68.56, t(2)= 18.75, **p=0.0028, 95% CI [52.82 to 84.29]).
Firing rate (Hz)
OFF 5 Hz
D
LV
LC BLA
ThCre LC ChR2; BLA optrode AAV5-EF1Į-DIO-ChR2-eYFP
A
E
C
180 360 540
-5 5
180 360 540 5
180 360 540 PCA1
PC
A
2
0 180 360 540 0 5 10 15 20 25
0 180 360 540 0 5 10 15 20 25
Firing rate (Hz)
0 180 360 540 0 5 10 15 20 25 B
Firing rate (Hz) Firing rate (Hz)
Normalized firing rate (z) Normalized firing rate (z) Normalized firing rate (z)
F G
K L M
-5 0 5
Time (s) Time (s) Time (s)
H I J
Time (s) Time (s) Time (s)
5 Hz 5 Hz
5 Hz
5 Hz 5 Hz
5 Hz
5 Hz
Normalized firing rate (z)
0 180 360 540
4 9 29 0 -5 0 -5 0 5 0 10 20 30 40 50 = + -0 200 400 600 L a te n c y ( m s ) = + -0 10 20 30 40 B a s e lin e f ir in g r a te (H z ) = + -0.0 0.2 0.4 0.6 0.8 B u rs ts /s e c o n d
0.5 0.6 0.7 0.8 0.9 1.0 0 5 10 15 20 C o m p a ri s o n s ( % )
Waveform similarity (r)
= + -0 50 100 % s p ik e s in b u rs ts = + -0 10 20 30 40 M e a n f re q u e n c y /b u rs t ( H z )
N O P
*
Figure 3.Photostimulation of LC terminals in the BLA alters neuronal activity. (A) Schematic illustrating single-unit extracellular recording paradigm of
BLA neurons modulated by ChR2-expressing LC-BLA terminals. (B) Representative principal component analysis plot showing the first two principal
components with clear clustering of a single unit (maroon) from the noise (grey). Inset shows the waveform and spikes making up the isolated unit.
Y-scale is 150 microvolts and x-scale is 500 ms. (C) Recordings from eight hemispheres of sixTh-CreLC-BLA:ChR2mice show the distribution of firing rates
frequency in 21.4% of units recorded in the BLA (Figure 3C–E,H;Figure 3—figure supplement 1A), while some cells (9.5%) displayed inhibitory responses (Figure 3D,F,I;Figure 3—figure supplement 1B). The remaining neurons (69.0%) appeared to not change in response to photostimulation
(Figure 3D,G,J;Figure 3—figure supplement 1C). Furthermore, in a subset of cells blindly selected
(without knowledge of the increase/decrease/static response to photostimulation) following the 5 Hz recordings, we also observed similar increases in firing rates to constant photostimulation, where the overall population of neurons increased firing during stimulation (Figure 3—figure supplement
1D and E). In cases where the firing rate increased, the mean±SD latency to fire following each light
pulse was 129.3 ±108.9 ms, suggesting that this change is not due to fast, monosynaptic
neuro-transmission, but likely a polysynaptic and/or neuromodulatory effect (Figure 3K). Likewise, in cases where the firing rate decreased the mean latency was slower at 172.6±77.01 ms, and neither case was significantly different to neurons whose firing rate did not change following photostimulation (260.4±165.7) (Figure 3K).
We next sought to determine whether these differences in neuronal response arise from distinct subsets of BLA neurons. To do so, we examined the baseline firing rate, waveforms, and bursting properties of recorded units. Neurons that increase firing in response to LC-BA terminal stimulation have a significantly lower mean basal firing rate (2.194±2.22 SD) than those that decrease firing (13.06 ± 11.82 SD), however neither group is distinguishable from non-responsive neurons
(Figure 3L). To quantifiably assess the waveform shapes of the recorded neurons, we calculated the
average waveform for each neuron and performed a linear correlation on these values within each group of neurons. These analyses demonstrate that all neurons that increase firing to LC-BLA photo-stimulation have an r value greater than 0.835 and all neurons that decrease have an r value above 0.820, while the population of neurons that did not significantly respond to photostimulation have an r above 0.515. These results indicate that neurons that do not respond to photostimulation are less internally similar, while the excited and inhibited cells are more similar within groups, suggesting that these modulated neurons are more likely to each be part of single class of neurons (Figure 3M). Finally, we examined the bursting properties of the recorded neurons. While most neurons exhibited some bursting properties, no differences were found between groups in terms of frequency of burst-ing (Figure 3N), mean firing rate during bursts (Figure 3O), or the percentage of spikes from the recording sessions that occurred within a burst (Figure 3P). Together, these heterogeneous firing properties are consistent with previous studies using iontophoresis of NE into the BLA, and further highlight the complex pharmacological and circuit activity that NE modulates within the BLA
(Buffalari and Grace, 2007;Ferry et al., 1997;Huang et al., 1996). These results suggest that
pho-tostimulation of LC terminals in the BLA causes varied neuronal firing rate responses, with the major-ity of photostimulation-responsive neurons increasing firing in response to the LC-NE terminal photostimulation.
Figure 3 continued
present in BLA neurons prior to and following LC-BLA terminal photostimulation (473 nm, 5 Hz, 3 min). (D) Average normalized firing rate of neurons
that increase (maroon), decrease (grey), or do not change (black) firing rate in response to photostimulation. Inset, shows number of neurons in each
group. Representative histograms (1 s bins) of isolated single-units showing increase (E) or decrease (F), or no change (G) in neuronal firing in response
to photostimulation (473 nm, 5 Hz, 3 min).Z-scored population responses of neurons showing increase (H) or decrease (I), or no change (J) in neuronal
firing in response to photostimulation. (K) Response latency following onset of photostimulation for cells that did not alter firing (=) (n = 29), increased
firing (+) (n = 9), or decreased firing (-) (n = 4). (Data represented as mean±SD). (L) The same cells sorted by baseline firing rate. (Data represented as
mean±SEM. Kruskal-Wallis test one-way ANOVA for non-parametric data with Dunn’s multiple comparisons test, Kruskal-Wallis statistic = 6.536,
p=0.0381; + vs. – Mean rank difference = 18.75, adjusted *p=0.0329; + vs. + Mean rank difference = 6.828, adjusted p=0.4341; - vs. = Mean rank
difference = 11.92, adjusted p=0.2053.) (M) Waveform similarity, within group distribution of linear correlations. Inset, every average waveform for each
recorded unit separated by response profile (= black, + maroon, - grey). (N–P) Bursting profiles for each recorded neuron. (N) Number of bursts per
second. (Data represented as mean±SEM). (O) Mean firing rate within bursts for each neuron. (Data represented as mean±SEM). (P) Proportion of
recorded spikes that occurred during bursts. (Data represented as mean±SEM).
DOI: 10.7554/eLife.18247.005
The following figure supplement is available for figure 3:
Figure supplement 1.Photostimulation of LC terminals in the BLA alters neuronal activity.
LC-BLA terminal stimulation biases activation towards
anxiety-promoting BLA neurons
The BLA is thought to be a heterogeneous hub for emotional processing containing separable popu-lations for regulating either positive or negative affect. Recent studies have suggested that these opposing populations are distinct in either their projection target or their cell-type (Stuber et al.,
2011;Namburi et al., 2015;Beyeler et al., 2016;Felix-Ortiz et al., 2016;Burgos-Robles et al.,
2017;Kim et al., 2016,2017;Correia et al., 2016). Given the role of BLA adrenergic receptors in
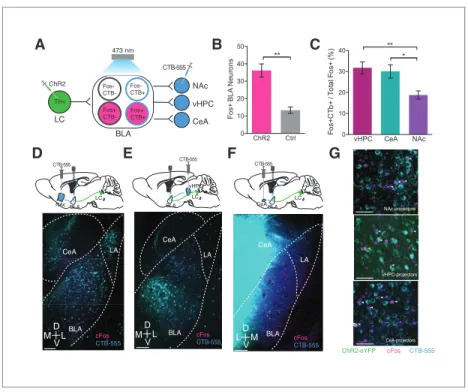
modulating anxiety-like and aversion behaviors (Siuda et al., 2015a,2016), we hypothesized that LC-NE innervation of BLA neurons may preferentially bias activation of neurons that promote anxi-ety-like behavior such as the ventral hippocampus (vHPC)- and central amygdala (CeA)- projecting BLA neurons as opposed to projections that promote positive affect and anxiolysis such as nucleus accumbens (NAc)-projecting BLA neurons. Using a combination of retrograde viral tracing, immuno-histochemistry, and optogenetic stimulation inTh-CreLC-BLA:ChR2 mice, we assessed these potential tri-synaptic circuits that may underlie anxiety-like behaviors (Figure 4A). Photostimulation of LC-NE terminals in the BLA (5 Hz, 10 ms) significantly increases the number of cFos-expressing BLA neurons inThIRES-Cre::LC-BLA:ChR2 animals compared to ChR2-lacking (Figure 4B;Figure 4—figure
supple-ment 1A–D) and contralateral BLA controls following photostimulation (Figure 4—figure
supple-ment 1E). To assess whether the cFos+ BLA neurons resulting from LC-NE terminal activation were
biased toward a particular class of BLA projection neurons we next repeated the experiment with the retrograde tracer Cholera toxin subunit B (CTB) injected into BLA projection regions (vHPC, CeA, and NAc). These immunohistochemistry studies reveal that the cFos present following LC-NE terminal activation in the BLA, overlaps significantly more with vHPC- and CeA-targeted compared to NAc-targeted CTB in the BLA (Figure 4C–G;Figure 4—figure supplement 1F–H). These results suggest that LC-NE terminals in the BLA preferentially activate vHPC- and CeA- projecting BLA neu-rons thought to be involved in modulating negative valence and affective behaviors.
LC-BLA terminal stimulation is sufficient to elicit a conditioned place
aversion
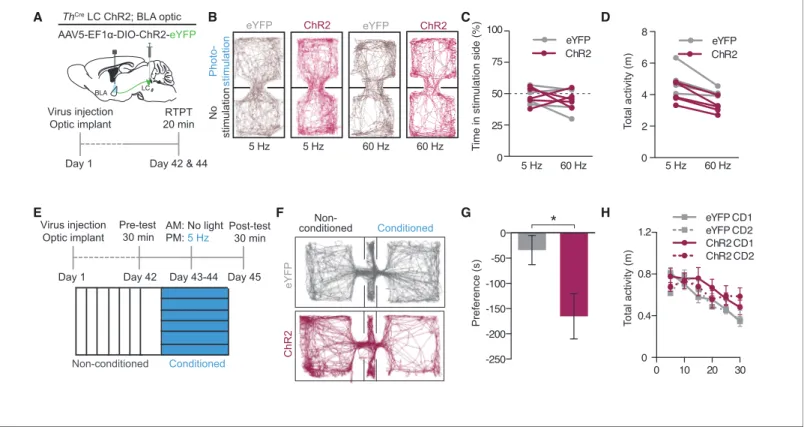
After identifying the LC terminals to the BLA as a projecting source of NE, that photostimulation of these terminals are capable of altering BLA activity, and that this photostimulation appears to bias BLA activation towards circuits involved in negative affect, we next tested whether this same pattern of terminal stimulation can drive an immediate negative valence. Fiber optics were implanted at LC-NE terminal sites in the BLA of ThIRES-Cre mice with AAV5-DIO-Ef1a-ChR2(H134)-eYFP previously injected into the LC (ThIRES-Cre::LC-BLA:ChR2) (Figure 5A, Figure 5—figure supplement 1A). Sur-prisingly, photostimulation ofThIRES-Cre::LC-BLA:ChR2 terminals using the parameters that induce a real-time place aversion at LC-NE cell bodies (McCall et al., 2015) failed to elicit a real-time aversion inThIRES-Cre::LC-BLA:ChR2 animals (Figure 5B and C). There was no significant change in place test-ing behavior (Figure 5C) or locomotor behavior (Figure 5D) within animals or compared to Th IRES-Cre
::LC-BLA:eYFP controls at either a physiologically-relevant 5 Hz or an over-driven 60 Hz photosti-mulation. This finding is particularly interesting in light of previous systemic pharmacology experi-ments (McCall et al., 2015) that suggested the immediate negative valence induced by LC-NE stimulation is mediated by a1 adrenergic receptor activation. These results indicate that the real-time negative valence of LC-NE stimulation is likely produced via another LC-NE projection and one that is not recruited through antidromic stimulation of BLA-projecting LC neurons.
It is also possible that the neuromodulatory effects on this circuit require a long-term associative memory component compared to fast-acting, acute activation of similar pathways (Kim et al., 2013;
Namburi et al., 2015;Haubensak et al., 2010). To directly test whether long-term learned
associa-tions are produced byThIRES-Cre::LC-BLA:ChR2 stimulation, we employed a Pavlovian conditioned place aversion (CPA) assay similar to our previous work (McCall et al., 2015;Siuda et al., 2015a;
Al-Hasani et al., 2013; Siuda et al., 2015b) (Figure 5E, Figure 5—figure supplement 1B). When
these results suggest that there is a learned negative association produced by photostimulation of
Th+fibers in the BLA. This association is capable of producing avoidance from contexts in which the photostimulation previously occurred.
Optogenetic targeting of LC-NE projections to the BLA promotes
anxiety-like behavior through beta-adrenergic receptor activity
Following the observation that stimulation of LC-BLA fibers alone is sufficient to cause a conditioned aversion, we next tested whether the same stimulation of these terminals would drive acute anxiety-like behaviors similar to those we recently reported in response to direct LC-NE cell body activation. Photostimulation of ThIRES-Cre::LC-BLA:ChR2 terminals using parameters that induce anxiety-like behavior at LC-NE cell bodies (McCall et al., 2015) resulted in a significant decrease in time spent in the center of the open field (OFT) with no significant change in general locomotor activity
(Figure 6A–D, Figure 6—figure supplement 1A). These experiments suggest that stimulation of
only the subset of LC-NE fibers that project to the BLA is sufficient to induce anxiety-like behaviors.
A B D E LV LC CTB-555 BLA NAc LV LC BLA CTB-555 vHPC
vHPC CeA NAc
0 10 20 30 40 F o s + C T b + / T o ta l F o s + ( % ) * ** CTB-555 Fos+ CTB-TH+ BLA LC Fos- CTB-ChR2 NAc CeA vHPC Fos+ CTB+ Fos-CTB+ 473 nm ChR2 Ctrl 0 10 20 30 40 50 F o s + B L A N e u ro n s ** cFos CTB-555 VL
MD BLA LA CeA vHPC-projectors cFos CTB-555 VL
MD BLA LA CeA NAc-projectors LV LC BLA CTB-555 CeA CeA-projectors BLA LA CeA cFos CTB-555 V L M D F C G
ChR2-eYFP cFos CTB-555
Figure 4.Photostimulation of LC terminals in the BLA preferentially activates BLA circuitry associated with
anxiety-like behavior. (A) Diagram of viral and optogenetic strategy. (B) 5 Hz photostimulation increases cFos expression
within the BLA inThIRES-Cre::LC-BLA:ChR2+animals compared toThIRES-Cre::LC-BLA:ChR2-controls (Data
represented as mean±SEM, n = 9 ChR2, n = 4 Ctrl; average of 3 sections/mouse; Student’s t-test, Mean
difference = 19.17, t(10)= 4.005, **p=0.0040, 95% CI [ 35.47 to 10.11). (C) 5 Hz photostimulation increases cFos
expression significantly more in BLA neurons projecting to the vHPC and CeA compared to NAc inThIRES-Cre
::LC-BLA:ChR2 animals (Data represented as mean±SEM, n = 9 vHPCCTB, n = 6 CeACTB, n = 9 CeACTB, 3 sections per
mouse; One-Way ANOVA, Bonferroni’s Multiple Comparison Test,F2,20= 7.199, **p=0.0044;ThIRES-Cre::LC-BLA:
ChR2:CTB-vHPC vs.ThIRES-Cre::LC-BLA:ChR2:CTB-NAc Mean difference = 12.95, t
(20)= 3.585, **p<0.01 95% CI
[3.511 to 22.39];ThIRES-Cre::LC-BLA:ChR2:CTB-CeA vs.ThIRES-Cre::LC-BLA:ChR2:CTB-NAc. Mean difference = 11.25,
t(20)= 2.802, *p<0.05 95% CI [0.7605 to 21.74]. Representative images of the BLA expressing cFos after 5 Hz
photostimulation in (D)ThIRES-Cre::LC-BLA:ChR2 injected with CTB in NAc, (E) vHPC, or (F) CeA. Scale bar, 100
mm.
(G) Confocal images showing colocalization of CTB and cFos after 5 Hz photostimulation in the NAc, vHPC, and
CeA. Scale bar, 50mm.
DOI: 10.7554/eLife.18247.007
The following figure supplement is available for figure 4:
Figure supplement 1.Photostimulation of LC terminals in the BLA preferentially activates BLA circuitry associated with negative affect.
Our prior work revealed that systemic antagonism ofb-ARs blocks the anxiogenic, but not the real-time aversive, components of tonic LC-NE stimulation (McCall et al., 2015). We next tested whether b-AR activity in the BLA is necessary for LC-NE mediated anxiogenesis. To do so we implanted a combined fiberoptic-fluid cannula into the BLA and delivered either an artificial cerebro-spinal fluid vehicle or the non-selective b-AR antagonist, Propranolol (1 mg)(Roozendaal et al.,
2008,2006;Chang and Grace, 2013;Shanks et al., 1966), prior to photostimulation (Figure 6E–H,
Figure 6—figure supplement 1B). The same photostimulation paradigm that was anxiogenic in the
OFT, caused a decrease in time spent in the open area of the elevated zero maze (EZM) of ChR2+ animals that received vehicle, compared to YFP-expressing, vehicle controls (Figure 6G and H). Importantly, when we locally antagonizedb-ARs directly in the BLA prior to photostimulation, anxio-genesis was completely blocked in ChR2+ animals with no effect on eYFP-expressing, propranolol controls (Figure 6G and H). These findings suggest that local b-AR activation by NE release from LC-BLA terminals is the substrate responsible for the photostimulation-induced anxiety-like behavior.
Non-conditioned Conditioned
Day 42 Day 1
Virus injection Optic implant
Pre-test 30 min
AM: No light PM:5 Hz
Post-test 30 min
Day 43-44 Day 45
Conditioned
Non-conditioned
ChR2
eYFP
-250 -200 -150 -100 -50
0
*
Preference (s)
ThCre LC ChR2; BLA optic
Day 1 Virus injection
Optic implant
RTPT 20 min
Day 42 & 44 AAV5-EF1Į-DIO-ChR2-eYFP
T
otal activity (m)
T
otal activity (m)
0 10 20 30
0 0.4 0.8 1.2 LV
LC BLA
eYFP ChR2
T
ime in stimulation side (%)
0 25 50 75 100
5 Hz 60 Hz 0 5 Hz 60 Hz
2 4 6 8
eYFP ChR2
eYFP CD1
ChR2 CD1 eYFP CD2
ChR2 CD2
A B C D
E F G H
60 Hz 60 Hz 5 Hz 5 Hz
ChR2
eYFP eYFP ChR2
Photo-stimulation
No
stimulation
Figure 5.Photostimulation of LC terminals in the BLA causes conditioned aversion. (A) Cartoon of viral and fiber optic delivery strategy and calendar of
real-time place testing studies. (B) Representative traces of behavior at different frequencies. (C) Frequency response of RTPT and (D) locomotor activity
at 5 and 60 Hz. Data represented as mean±SEM, n = 4 eYFP, 5 ChR2. (E) Conditioned place aversion (CPA) behavioral calendar. (F) Representative
CPA traces. (G)ThIRES-Cre::LC-BLA:ChR2 mice (maroon; n = 9) show a conditioned aversive response to chamber paired with photostimulation
compared toThIRES-Cre::LC-BLA:eYFP controls (grey; n = 8) (Data represented as mean±SEM, Student’s t-test, Mean difference = 131.3, t(15)= 2.39,
*p=0.0303, 95% CI [14.32 to 248.4) following two days of conditioning with (H) no significant differences in locomotor behavior during conditioning day
1 (CD1) and or conditioning day 2 (CD2) in CPA.
DOI: 10.7554/eLife.18247.009
The following figure supplement is available for figure 5:
Figure supplement 1.Photostimulation of LC terminals in the BLA drive aversive behavior.
Discussion
We aimed to dissect the functional role of LC to BLA inputs, and to determine the specific receptors within the BLA that mediate LC-NE influenced anxiety-like behavior in the region. Taken together, these data suggest that photostimulation of LC-BLA projections releases NE into the BLA and this
ThCre LC ChR2; BLA optic
Day 1 Virus injection
Optic implant
OFT 5 Hz
Day 42 & 44
AAV5-EF1Į-DIO-ChR2-eYFP
LV
LC BLA
eYFP ChR2 0
5000 10000 15000
eYFP ChR2 0
50 100 150 200
250 **
LV
LC BLA
Day 1 Virus injection
Day 35 Optic & cannula
implantation Drug
Day 42 EZM
5 Hz
30-37 min 0 min
ThCre LC ChR2; BLA cannula
AAV5-EF1Į-DIO-ChR2-eYFP
eYFP ChR2 0
10 20 30 40
Prop ChR2 + Prop eYFP +
T
ime in open (%)
T
ime in center (s)
T
otal activity (cm)
A
B C D
E F G
ChR2 eYFP
Low High
Time spent
Veh+ Veh+
eYFP Veh+
ChR2
Veh+ Prop
eYFP +
Prop ChR2 +
High
Low H
Time spent
**
** ***
Figure 6.Photostimulation of LC terminals in the BLA promotes anxiety-like behavior through beta-adrenergic receptors. (A) Calendar of OFT studies.
(B) Representative heat maps of activity during OFT. (C) 5 Hz photostimulation causes an anxiety-like phenotype in OFT ofThIRES-Cre::LC-BLA:ChR2
animals compared toThIRES-Cre::LC-BLA:eYFP controls (Data represented as mean
±SEM, n = 10 eYFP, 11 ChR2; Student’s t-test, Mean
difference = 116.9, t(19)= 3.46, **p=0.0026, 95% CI [46.20 to 187.5) with (D) no change in locomotor activity (Data represented as mean±SEM). (E)
Cartoon of viral, cannula, and fiber optic delivery strategy and (F) calendar of EZM behavior. (G) 5 Hz photostimulation causes an anxiety-like phenotype
in EZM ofThIRES-Cre::LC-BLA:ChR2 animals compared toThIRES-Cre::LC-BLA:eYFP controls, which is reversed by intra-BLA propranolol pretreatment
(Data represented as mean±SEM, n = 11 eYFP + Vehicle, n = 9 ChR2 + Vehicle, n = 7 eYFP + Propranolol, n = 8 ChR2 + Propranolol; One-Way
ANOVA, Bonferroni’s Multiple Comparison Test,F3,31= 8.95, p=0.0002;ThIRES-Cre::LC-BLA:eYFP+Vehicle vs.ThIRES-Cre::LC-BLA:ChR2+Vehicle. Mean
difference = 14.74, t(2)= 3.94, **p<0.01 95% CI [4.21 to 25.27];ThIRES-Cre::LC-BLA:ChR2+Vehicle vs.ThIRES-Cre::LC-BLA:ChR2+Propranolol. Mean
difference = 16.93, t(2)= 4.19, **p<0.01 95% CI [5.46 to 28.31];ThIRES-Cre::LC-BLA:eYFP+Propranolol vs.ThIRES-Cre::LC-BLA:ChR2+Vehicle. Mean
difference = 18.37, t(2)= 4.39, ***p<0.001 95% CI [6.57 to 30.18). (H) Representative heat maps of activity during EZM.
DOI: 10.7554/eLife.18247.011
The following figure supplement is available for figure 6:
Figure supplement 1.Photostimulation of LC terminals in the BLA drive anxiety-like behavior.
same photostimulation alters BLA firing. This altered firing appears to preferentially increase activity in BLA neurons that project to area known to modulate negative affect such as the CeA and vHPC. In behaving animals, this stimulation of LC terminals in the BLA facilitates a conditioned aversion and acute anxiety-like behaviors. Importantly, the experiments here cannot determine whether the observed changes in BLA unit activity and the conditioned place aversion are mediated directly by NE release from LC terminals. Instead, these affects could be generated through antidromic stimula-tion of LC cell bodies (and their diverging efferent projecstimula-tions) or through plastic changes resulting from the repeated and long-term stimulation protocols used during the two 30 min conditioning ses-sions. However, using local, site-specific pharmacological blockade, we identified thatb-ARs within the BLA are necessary for the anxiety-like component of this behavior. These data provide a critical framework for understanding the downstream influence of the LC-NE system in the BLA as it relates to anxiety-like behavioral states.
The BLA is a crucial component in the neural circuitry of negative affective behaviors (Davis, 1992;
Davidson, 2002). Activation of BLA cell bodies and their projections can bidirectionally mediate
anx-iety-like behavior and fear encoding (Davis, 1992; Kim et al., 2013; Tye et al., 2011;
Namburi et al., 2015;Beyeler et al., 2016;Wolff et al., 2014;Knoll et al., 2011;Crowley et al.,
2016;Sears et al., 2013;Roozendaal et al., 2006;Felix-Ortiz et al., 2013;Debiec and Ledoux,
2004), but how this behavioral control is altered by neuromodulators is not well understood. NE is increased in the BLA following stressful events (Galvez et al., 1996;Hatfield et al., 1999). The BLA receives noradrenergic input from the LC (Asan, 1998;Fallon et al., 1978) as well theHoxb1+ neu-ronal populations in the lower brainstem and NTS (Robertson et al., 2016). Despite the LC input being less dense than other NE input (Plummer et al., 2015), here we directly show that molecu-larly-defined Th+ positive fibers from the LC release catecholamines into the amygdala and alter behavior. Previous studies have demonstrated that noradrenergic tonic cell firing in the LC increases following stressful stimuli (McCall et al., 2015; Abercrombie and Jacobs, 1987a, 1987b;
Aston-Jones et al., 1999;Mana and Grace, 1997). We now demonstrate that selective activation ofTh+
LC terminals from these neurons modulates BLA neuronal activity in vivo. Despite a diversity of recorded responses, these findings align with prior studies suggesting neurons that increase firing to LC-BLA photostimulation have a higher probability of being BLA projection neurons, while those that decrease have a higher probability of being BLA interneurons (Figure 3L) (Likhtik et al., 2006). Therefore, it seems that it is reasonable that LC-BLA modulation might be selectively increasing activity of BLA projection neurons, though further studies using phototagging or imaging BLA neu-rons is required. Though it is well established that activation of b-ARs increases BLA activity
(Buffalari and Grace, 2007;Huang et al., 1996;Pu et al., 2009), we cannot conclude that this is
the only mechanism by which LC-BLA fibers modulate BLA activity. Indeed, it is likely that the diver-sity of neuronal responses we observed are mediated through different receptors systems
(Buffalari and Grace, 2007) and/or local or distal polysynaptic recurrent circuitry (Wolff et al.,
2014;Rosenkranz and Grace, 2002,1999). Furthermore, while we do not know the genetic identity
or projection targets of the BLA neurons from which we recorded, it is possible that NE serves to preferentially shift BLA activity in neurons that favor anxiety-like behavior (i.e. those that project to the ventral hippocampus, prefrontal cortex, or central amygdala) rather those that favor positive affect and anxiolysis (i.e. projections to the nucleus accumbens and bed nucleus of the stria termina-lis)(Kim et al., 2013;Stuber et al., 2011;Tye et al., 2011;Namburi et al., 2015;Beyeler et al.,
2016; Felix-Ortiz et al., 2013, 2016; Felix-Ortiz and Tye, 2014). We attempted to begin to
address this question using a retrograde labeling strategy combined with immunohistochemistry for cFos. Our results suggest that there is selective modulation of BLA projections neurons. The com-bined retrograde labeling and photostimulation studies indicate that, cFos, a secondary marker for neuronal excitation (Madabhushi et al., 2015), is selectively increased in the CeA- and vHPC-projec-ting BLA neurons (Figure 4). Furthermore, our recent reports demonstrate that increasing the activ-ity of CaMKII+ BLA neurons via chemogenetic or optogenetic activation of Gas-signaling also produces an anxiogenic-like state, suggesting that excitatory cells possibly mediate the LC-BLA nor-adrenergic effect (Siuda et al., 2015a,2016). However, further work will be necessary to understand the cell-type and projection-specific relationship between LC-NE modulation of BLA activity and its ability to drive negative affective behavior through downstream circuits and receptor systems.
mediated locally in the BLA by NE. This effect may could be due to factors outside of the BLA and distinct from NE release such as antidromic activity at the LC cell bodies or from prolonged changes to LC circuit activity elsewhere that result from long-term, repeated optogenetic stimulation. How-ever, a similar photostimulation paradigm increases anxiety-like behavior that is blocked by local antagonism ofb-ARs in the BLA. It is well established that prolonged NE release in the BLA modu-lates memory storage throughb-AR-mediated cAMP production and this effect, in turn, is regulated by a1-AR and a2-AR activity (Galvez et al., 1996; Hatfield et al., 1999; Liang et al., 1990;
Ferry and McGaugh, 2008;Ferry et al., 1999a,1999b). In particular, many groups have shown
nor-adrenergic influence in fear-related memory formation (Sears et al., 2013;Roozendaal et al., 2008,
2006;Debiec and Ledoux, 2004;Garrido Zinn et al., 2016;Skelly et al., 2017). Our findings
sup-port these prior works while offering new insight into how this circuitry might acutely modulate neg-ative affect. The observation that the LC-BLA circuitry carries an intrinsically negneg-ative valence suggests that this circuit can natively promote negative affect, rather than merely enhancing memory. However, it is possible that without explicit memory cues, our photostimulation paradigm conditions an aversion via recruitment of many other neurotransmitter systems
(Brioni et al., 1989;Marsicano et al., 2002). This might not be the case in the presence of a positive
cue or reward where the LC-BLA projection may still simply enhance the memory. Further studies will be necessary to fully evaluate the implications of the apparent negative affect promoted by exogenous stimulation of this circuit. While there is some concern that photostimulation of Th IRES-Cre
::LC-BLA:ChR2 fibers could cause backpropagating action potentials to LC-NE cell bodies result-ing in NE release elsewhere in the brain for the conditioned place aversion, the observation that the anxiety-like phenotype can be blocked with localb-AR antagonism (Figure 6G) suggests there is some degree of circuit isolation in our study. Additionally, the observation that this stimulation does not replicate all of the behavioral phenotypes of cell body activation (McCall et al., 2015)
(Figure 5C; i.e. no RTPA) further supports this interpretation. However, we cannot definitively
con-clude that the observed CPA (Figure 5F and G) is mediated through the same postsynaptic mecha-nism (i.e. b-AR activation) in the BLA as the anxiety-like phenotype. To this point, we recently demonstrated that Gas signaling (the same signaling mechanism that b-AR activates) in CaMKIIa+ BLA neurons is sufficient for anxiogenesis, without driving either a real-time or conditioned place aversion (Siuda et al., 2015a, 2016). Additionally, throughout these experiments we have not directly addressed any potential confounds that arise from long-term expression of exogenous opsins (Miyashita et al., 2013;Ferenczi et al., 2016;Warden et al., 2012). Instead, our behavioral controls (eYFP-expression with photostimulation) are aimed at controlling spurious effects of exoge-nous protein expression, heating, and light delivery to the BLA (Yizhar et al., 2011). Together with our work at LC-NE cell bodies (McCall et al., 2015), these studies and the current findings suggest that LC neurons with fibers in the BLA are capable of conditioning aversion, though possibly through other brain regions and possibly independent ofb-AR activation.
The lack of a real-time place aversion is a particularly interesting observation. We previously dem-onstrated the real-time place aversion elicited by LC-NE cell body activation to be dependent ona1 -AR activation (McCall et al., 2015). Together these results suggest that both the anatomical sub-strate and receptor system responsible for this behavior is distinct from the efferent LC-NE pro-cesses responsible for noradrenergic mediated anxiety-like behavior. Furthermore, there are important distinctions between the RTPA and the CPA assays. RTPA is essentially an instrumental conditioning paradigm that relies on operant learning of the subject as it engages the environment, while CPA is a passive, classical conditioning paradigm that possibly recruit distinct brain circuitry during the learning process (Day and Carelli, 2007). Another consideration is the longer time course of NE transmission and receptor activation compared to fast-acting, small molecule neurotransmit-ters, such as g-Aminobutyric acid (GABA) and glutamate (Otis and Mody, 1992; Isaacson et al.,
1993; Zoli et al., 1998; Szapiro and Barbour, 2007; Agnati et al., 2010; Palij and Stamford,
1994;Courtney and Ford, 2014). These temporal dynamics, combined with the role of NE on
mem-ory formation (Sears et al., 2013; Roozendaal et al., 2008, 2006; Debiec and Ledoux, 2004;
Sara, 2000), might confound the RTPA assay that relies on distinct pairing of the transition from one
increase firing acutely, but that they also signal through Arrestin-mediated transduction. The latter can lead to long-term changes in gene and protein expression in addition to changes synaptic plas-ticity and neuronal activity (Siuda et al., 2015a). All of these molecular considerations may also play a key role in the behavior we observed. While numerous potential circuit-based targets exist, it seems possible that NE projections to the mesolimbic dopamine system have the potential to medi-ate instrumental learning including real-time aversive behaviors. The LC sends functional projections to the dopaminergic system and numerous groups have demonstrated bidirectional control of real-time place preference and aversion behaviors within this system (Siuda et al., 2015b;
Jennings et al., 2013; Lammel et al., 2012; Stamatakis and Stuber, 2012; Tan et al., 2012;
van Zessen et al., 2012;Isingrini et al., 2016).
Taken together, our results here and elsewhere (McCall et al., 2015; Siuda et al., 2015a, 2016) demonstrate that LC-NE downstream influence on negative affective behaviors is an elaborate and complex system likely involving many different postsynaptic receptor systems and anatomical projection targets. Importantly, the LC projection to the BLA is a clear functional efferent target for LC-mediated anxiety-like behavior. These findings have broad implications for our understanding of the mechanisms of anxiety and other negative affective disorders and suggest that further study of these noradrenergic circuits and signaling pathways should greatly advance our current understand-ing of related psychopathologies.
Materials and methods
Animals
Adult (25–35 g) male C57BL/6J (RRID:IMSR_JAX:000664) and ThIRES-Cre (RRID:IMSR_EM:00254) backcrossed to C57BL/6J mice were group-housed, given access to food and water ad libitum and maintained on a 12 hr:12 hr light:dark cycle. All animals were held in a facility in the lab 1 week prior to surgery, post-surgery and throughout the duration of the behavioral assays to minimize stress from transportation and disruption from foot traffic. To determine animal numbers we used G*Power 3 power analysis software (RRID:SCR_013726) (Faul et al., 2007; Charan and Kantharia, 2013) informed by data from our typical animal usage logs from similar experiments to suggest a priori means an standard deviations for each intended statistical methods (i.e. Student’s t-tests, ANOVAs, etc.) or Mead’s resource equation to yield between 10 and 20 degrees of freedom for the error com-ponent when no prior data was available (Charan and Kantharia, 2013; Festing and Altman, 2002). Any variation from these approaches was due to behavioral attrition from off-target injec-tions/implants or headcap failures. All procedures were approved by the Animal Care and Use Com-mittee of Washington University and conformed to US National Institutes of Health guidelines.
Viral preparation
Plasmids encoding pAAV-EF1a-DIO-eYFP [final titer 5 1012 vg/ml], pAAV-EF1a-double floxed-hChR2(H134R)-eYFP-WPRE-HGHpA [final titer 2 1013 vg/ml], were obtained from Addgene (Addgene.org) originally from the Deisseroth Laboratory at Stanford University. The DNA was ampli-fied with a Maxiprep kit (Promega) and packaged into AAV5 serotyped viruses by the WUSTL Hope Center Viral Core.
Stereotaxic surgery
Mice were anaesthetized in an induction chamber (4% isoflurane) and placed in a stereotaxic frame (Kopf Instruments, Model 1900) where they were maintained at 1–2% isoflurane throughout the pro-cedure. A craniotomy was performed and mice were injected as follows. For locus coeruleus terminal studies, 500–1000 nl of AAV5-DIO-ChR2 or AAV5-DIO-eYFP was injected unilaterally (with the exception of two animals for the single-unit electrophysiology experiments that were bilateral) into the locus coeruleus at stereotaxic coordinates from bregma: 5.45 mm anterior-posterior (AP),
±1.25 mm medial-lateral (ML), 3.65 mm dorsal-ventral (DV). Mice were then implanted with chronic fiber optic in the BLA at stereotaxic coordinates from bregma: 1.60 mm AP, ±2.90 mm ML, and 4.75 mm DV. For experiments involving local drug infusion into the BLA, a metal cannula (Plastic-sOne) was implanted at 1.60 mm AP,±2.90 mm ML, and 4.25 mm DV and either an internal
were secured using two bone screws (CMA, 743102) and affixed with TitanBond (Horizon Dental Products) and dental cement (Lang Dental)(McCall et al., 2015, 2013). Mice were allowed to recover for at least 6 weeks prior to behavioral testing; this interval permitted optimal AAV expres-sion and Cre recombinase activity. For retrograde studies 400 nl of Flurogold or Retrobeads were injected into the BLA at 1.60 mm AP, ±2.90 mm ML, and 4.75 mm DV. Mice were allowed to recover for one week for fluorogold and two weeks for retrobeads, prior to perfusion for histological examination. Cholera Toxin subunit b AlexaFluor 555 (Invitrogen; CTB-555) was injected using a Neuros Hamilton Synringe (32 gauge, beveled) to the NAc (+1.25 mm AP,±0.75 mm ML, 4.30 mm
DV; 200 nl), CeM ( 0.80 mm AP,±2.35 mm ML, 5.20 mm DV; 150 nL), vHPC ( 3.55 mm AP, +3.50
ML, 4.00 mm DV; 250 nL). The beveled syringe was inserted facing caudally for both NAc and vHPC and medially for CeA injections. CTB was prepared fresh for each series of experiments
(Conte et al., 2009).
cFos induction
ThIRES-Cre::LC-BLA:ChR2 mice were injected with CTB-555 (Invitrogen, Carlsbad, CA) into the NAc, CeM, or vHPC at least 6 weeks following AAV5-DIO-ChR2-eYFP injection into the LC. Mice were then implanted with a chronic fiber optic in the BLA as described above. Mice were allowed to recover for 5 days and habituated to a chamber and fiber optic tether over 2 days. Seven days fol-lowing CTB injection, 5 Hz photostimulation (10 ms pulses, 10 mW) was delivered to the BLA for 20 min. Mice were then sacrificed for immunohistochemistry 90 min following the onset of photostimu-lation. Following immunohistochemistry and imaging, images were background subtracted using ImageJ Fiji (RRID:SCR_002285). Cells were manually counted by an experimenter blind to the experi-mental conditions.
Immunohistochemistry
Immunohistochemistry was performed as described (McCall et al., 2015; Siuda et al., 2015a, 2016). Briefly, mice were anesthetized with pentobarbital and transcardially perfused with ice-cold 4% paraformaldehyde in phosphate buffer (PB). Brains were dissected, post-fixed for 24 hr at 4
˚
C and cryoprotected with solution of 30% sucrose in 0.1M PB at 4˚
C for at least 24 hr, cut into 30mm sections and processed for immunostaining. 30mm brain sections were washed three times in PBS and blocked in PBS containing 0.5% Triton X-100% and 5% normal goat serum. Sections were then incubated for~16 hr at room temperature in chicken anti-TH (1:2000, Aves Labs, Tigard, OR) or rab-bit anti-phospho-cFos (1:500, Cell Signaling Technology, Danvers, MA). Following incubation, sec-tions were washed three times in PBS and then incubated for 2 hr at room temperature goat anti-chicken or anti-rabbit Alexa Fluor 594 or 633 (1:500, Invitrogen, Carlsbad, CA) were then washed three times in PBS and followed by three 10 min rinses in PB and mounted on glass slides with Hard-set Vectashield (Vector Labs, Burlingame, CA) (RRID:AB_2336787) for microscopy. All sections were imaged on both epifluorescent and confocal microscopes. Gain and exposure time were constant throughout each experiment, and all image groups were processed in parallel using Adobe Photo-shop CS5 (Adobe Systems, San Jose, CA) (RRID:SCR_014199).Antibody Species Dilution Source RRID
TH Chicken 1:2000 Aves Labs RRID:AB_10013440
Alexa Fluor 594 anti-chicken IgG Goat 1:500 Invitrogen RRID:AB_142803
Alexa Fluor 633 anti-chicken IgG Goat 1:500 Invitrogen RRID:AB_1500591
Alexa Fluor 633 anti-rabbit IgG Goat 1:500 Invitrogen RRID:AB_2535731
Phospho-cFos Rabbit 1:500 Cell Signaling RRID:AB_10557109
Slice preparation
Slice electrophysiology and voltammetry experiments were performed as previously described
(Stamatakis et al., 2013). Briefly, mice were anesthetized (Euthasol) and perfused with ice-cold
1.25 glucose). Following rapid decapitation, coronal slices containing LC and BLA were prepared on a vibratome (VT-1200, Leica Microsystems, Wetzlar, Germany) and allowed to rest for at least 30 min in oxygenated aCSF (in mM: 119 NaCl, 2.5 KCl, 1.0 NaH2PO4, 1.3 MgCl2, 2.5 CaCl2, 26.2 NaHCO3, and 11 glucose) at 35
˚
C prior to placement in the recording chamber where slices were perfused with oxygenated aCSF at 37˚
C at a rate of 2 ml/min.Slice electrophysiology
Whole-cell current clamp recordings were made in LC neurons expressing ChR2-eYFP with a Multi-clamp 700B amplifier (Molecular Devices, Sunnyvale, CA) (RRID:SCR_011323). Since LC neurons are spontaneously active, current was injected such that the cell was resting at 65 mV. To elicit action potentials, slices were stimulated with 5 pulses of blue LED at a rate of 10 Hz (Thorlabs, 473 nm, 5 ms pulse width, 1 mW) via the 40X objective.
Fast scan cyclic voltammetry
Carbon fiber microelectrodes (CFME, 75mm in length) were lowered into 300mM coronal slices and placed where the densest ChR2-eYFP expression was observed (CeA/BLA border) ThIRES-Cre ::LC-BLA:ChR2 mice. To detect NE, the CFME was ramped from 0.4 V to 1.3 V versus a Ag/AgCl refer-ence electrode (in the bath) at a rate of 400 V/s at 10 Hz. Slices were stimulated with 30 pulses of a blue LED (Thorlabs, 473 nm, 5 ms pulse width, 1 mW) via a 40X objective at 10 Hz every 5 min to release NE. Electrochemical data was collected and analyzed using a combination of Tar Heel CV (ESA, Chelmsford, MA) (Robinson and Wightman, 2007), HDCV ( http://www.chem.unc.edu/facili-ties/electronics_software.html) (Bucher et al., 2013), and Labview (RRID:SCR_014325). Following collection, background subtracted cyclic voltammograms (CVs) were smoothed one time with a Fast Fourier Transformation (Bucher et al., 2013). CVs had characteristic oxidation and reduction peaks coinciding with catecholamine detection (ox: 600–700 mV red: 200–300 mV). Oxidative currents were analyzed at the peak of the oxidative potential for individual experiments. Clearance half-life (t1/2) was measured in Clampfit 10.2 (Molecular devices) as previously described (McElligott et al.,
2013).
In vivo electrophysiology
Spontaneous single unit activity was recorded as previously described (McCall et al., 2015;
Siuda et al., 2015a). Briefly, mice were lightly anesthetized (1% isoflurane), placed in a stereotactic
180 s of the recording (prior to any photostimulation) was used. Average waveforms were computed from each isolated unit using the first 540 s of each recording session. Subsequently, we performed linear correlations between each neuron of a designated class (i.e. increasing, decreasing, or static) where r = 1 would be an identical waveform. Bursts were defined as at least two spikes with an inter-spike interval (ISI) of <170 ms to start a burst, and two inter-spikes with an ISI > 300 ms to terminate a burst. Percent spikes in bursts was quantified by recording the number of spikes in bursts out of the total number of spikes from a unit.
General behavior notes
Behavioral assays were performed in a sound attenuated room maintained at 23
˚
C. Lighting was measured and stabilized at ~4 lux for anxiety tests and ~200 lux for place testing. All behavioral apparatuses were cleaned with 70% ethanol in between animals. In each assay, animals received con-stant photostimulation throughout the entire trial. AAV5-DIO-ChR2 and AAV5-DIO-eYFP animals received 5 ms pulses of 10 Hz photostimulation (473 nm). Movements were video recorded and ana-lyzed using Ethovision Software (RRID:SCR_000441).Real time place testing (RTPT)
Mice were placed into a custom-made unbiased, balanced two-compartment conditioning apparatus (52.5 25.5 25.5 cm) as previously described (McCall et al., 2015; Siuda et al., 2015b;
Al-Hasani et al., 2015) and allowed to freely roam the entire apparatus for 20 min. Entry into one
com-partment triggered constant photostimulation (5 Hz for LC-BLA;~10 mW light power) while the ani-mal remained in the light-paired chamber. Entry into the other chamber ended the photostimulation. The side paired with photostimulation was counterbalanced across mice. Time spent in each chamber and total distance traveled for the entire 20 min trial was measured using Ethovision 8.5 (Noldus, Wageningen, Netherlands). Data are expressed as mean± S.E.M percent
time spent in photostimulation-paired chamber.
Conditioned place aversion (CPA)
Mice were trained in an unbiased, balanced three compartment conditioning apparatus as previously described (McCall et al., 2015). Briefly, mice were pre-tested by placing individual animals in the small central compartment and allowing them to explore the entire apparatus for 30 min. Time spent in each compartment was recorded with a video camera (ZR90; Canon, Tokyo, Japan) and analyzed using Ethovision 8.5 (Noldus). Mice were randomly assigned to light and no-light compartments and received no light in the morning and light (5 Hz for LC-BLA) in the afternoon at least 4 hr after the morning training on two consecutive days. CPA was assessed on day 4 by allowing the mice to roam freely in all three compartments and recording the time spent in each. Scores were calculated by subtracting the time spent in the light stimulus-paired compartment post-test minus the pre-test.
Open field test (OFT)
OFT testing was performed as described (McCall et al., 2015) in a square enclosure (5050 cm). We connectedThIRES-Cre::LC-BLA:ChR2 mice to fiber optics and allowed them to roam freely for 21 min. Photostimulation alternated between off and on (5 Hz (10 ms width)) photostimulation (~10 mW light power)) states in 3 min time segments, beginning with 3 min of no stimulation. The open field was cleaned with 70% ethanol between each trial. The center was defined as a square comprised of 25% the total area of the OFT (i.e. each length was 50% that of the total OFT).
Elevated zero maze (EZM)
(1 mg, intra-BLA, 30 min prior to behavior, Tocris, Bristol, United Kingdom). Mean open arm time was the primary measure of anxiety-like behavior.
Genotyping of mouse lines
DNA was isolated from tail tissue obtained from weanling mice (21–28 days of age), and PCR screen-ing was performed usscreen-ing the followscreen-ing primers: Cre recombinase (forward: 5’- GCA TTA CCG GTC GAT GCA ACG AGT GAT GAG-3’ and reverse: 5’- GAG TGA ACG AAC CTG GTC GAA ATC AGT GCG-3’) yielding a 400 bp PCR product in Cre positive animals. Fatty acid-binding protein intestinal primers (forward: 5’- TGG ACA GGA CTG GAC CTC TGC TTT CCT AGA-3’ and reverse: 5’- TAG AGC TTT GCC ACA TCA CAG GTC ATT CAG-3’) were used as positive controls and yield a 200 bp PCR product.
Statistics/data analysis
All summary data are expressed as mean ± SEM. Statistical significance was taken as *p<0.05,
**p<0.01, ***p<0.001, as determined by the Student’s t-test (paired and unpaired): One-Way Analy-sis of Variance (ANOVA) or One-Way Repeated Measures ANOVA, followed by Dunnett’s or Bonfer-roni post hoc tests as appropriate. In cases where data failed the D’Agostino and Pearson omnibus normality test, non-parametric analyses were used. Statistical analyses were performed in GraphPad Prism 5.0 (RRID:SCR_002798).
Acknowledgements
This work is supported by NIMH R01 MH112355 (MRB), and early work in this study by NIDA R21 DA035144 (MRB), the McDonnell Center for Systems Neuroscience (MRB), NIMH F31 MH101956 (JGM), WUSTL DBBS (JGM, ERS), start-up funds from Washington University in St. Louis (JGM), NIAAA K01 AA023555 (ZAM), and the Alcohol Beverage Medical Research Foundation (ZAM). We thank all of the Bruchas Laboratory for their helpful insight and discussion throughout the prepara-tion of the manuscript. We also thank Thomas J Baranski, N Gautam, Robert W Gereau, IV, Erik D Herzog, Timothy E Holy, Joseph D Dougherty, and Joe Henry Steinbach for helpful discussions. We thank Karl Deisseroth (Stanford University) for the channelrhodopsin-2 (H134) construct. We also thank The WUSTL HOPE Center viral vector core for related viral preparations (NINDS, P30NS057105).
Additional information
Competing interests
MRB: Michael R. Bruchas, PhD is a co-founder of Neurolux, Inc, a company that is making wireless optogenetic and various neuroscience-related probes. None of the work in this manuscript used these devices or is related to any of the company’s activities, but we list this information here in full disclosure. The other authors declare that no competing interests exist.
Funding
Funder Grant reference number Author
National Institute of Mental Health
MH101956 Jordan G McCall
Washington University in St. Louis
Jordan G McCall Edward R Siuda
National Institute on Alcohol Abuse and Alcoholism
AA023555 Zoe A McElligott
Alcohol Beverage Medical Re-search Foundation
Zoe A McElligott
National Institute on Drug Abuse
DA032750 Garret D Stuber
National Institute on Drug Abuse
McDonnell Center for Systems Neuroscience
Michael R Bruchas
National Institute of Mental Health
MH112355 Michael R Bruchas
The funders had no role in study design, data collection and interpretation, or the decision to submit the work for publication.
Author contributions
JGM, ERS, Conceptualization, Data curation, Formal analysis, Investigation, Visualization, Methodol-ogy, Writing—original draft, Writing—review and editing; DLB, Data curation, Investigation, Visuali-zation, Methodology, Writing—review and editing; LAL, Investigation; ZAM, Investigation, Methodology, Writing—review and editing; GDS, Supervision, Methodology; MRB, Conceptualiza-tion, Funding acquisiConceptualiza-tion, Methodology, Writing—original draft, Project administraConceptualiza-tion, Writing— review and editing
Author ORCIDs
Jordan G McCall, http://orcid.org/0000-0001-8295-0664 Dionnet L Bhatti, http://orcid.org/0000-0003-3031-2067 Zoe A McElligott, http://orcid.org/0000-0002-4717-5698 Garret D Stuber, http://orcid.org/0000-0003-1730-4855 Michael R Bruchas, http://orcid.org/0000-0003-4713-7816
Ethics
Animal experimentation: This study was performed in strict accordance with the recommendations in the Guide for the Care and Use of Laboratory Animals of the National Institutes of Health. All of the animals were handled according to approved institutional animal care and use committee (IACUC) protocols at Washington University in St. Louis. The protocol was approved by the Animal Studies Committee at Washington University in St. Louis (Protocol Number: 20130219; expiration date: 15/10/2016). All surgery was performed under isoflurane anesthesia, and every effort was made to minimize suffering.
References
Abercrombie ED, Jacobs BL. 1987a. Single-unit response of noradrenergic neurons in the locus coeruleus of
freely moving cats. I. acutely presented stressful and nonstressful stimuli.Journal of Neuroscience7:2837–2843. PMID: 3625275
Abercrombie ED, Jacobs BL. 1987b. Single-unit response of noradrenergic neurons in the locus coeruleus of
freely moving cats. II. adaptation to chronically presented stressful stimuli.Journal of Neuroscience7:2844– 2848.PMID: 3625276
Agnati LF, Guidolin D, Guescini M, Genedani S, Fuxe K. 2010. Understanding wiring and volume transmission.
Brain Research Reviews64:137–159.doi: 10.1016/j.brainresrev.2010.03.003,PMID: 20347870
Al-Hasani R, McCall JG, Foshage AM, Bruchas MR. 2013. Locus coeruleus kappa-opioid receptors modulate
reinstatement of cocaine place preference through a noradrenergic mechanism.Neuropsychopharmacology 38:2484–2497.doi: 10.1038/npp.2013.151,PMID: 23787819
Al-Hasani R, McCall JG, Shin G, Gomez AM, Schmitz GP, Bernardi JM, Pyo CO, Park SI, Marcinkiewcz CM,
Crowley NA, Krashes MJ, Lowell BB, Kash TL, Rogers JA, Bruchas MR. 2015. Distinct subpopulations of nucleus accumbens dynorphin neurons drive aversion and reward.Neuron87:1063–1077.doi: 10.1016/j.neuron.2015. 08.019,PMID: 26335648
Arnsten AF, Raskind MA, Taylor FB, Connor DF. 2015. The effects of stress exposure on Prefrontal Cortex:
translating Basic Research into successful treatments for Post-Traumatic stress disorder.Neurobiology of Stress 1:89–99.doi: 10.1016/j.ynstr.2014.10.002,PMID: 25436222
Asan E. 1998. The catecholaminergic innervation of the rat amygdala.Advances in Anatomy, Embryology, and
Cell Biology142:1–118.doi: 10.1007/978-3-642-72085-7,PMID: 9586282
Aston-Jones G, Rajkowski J, Cohen J. 1999. Role of locus coeruleus in attention and behavioral flexibility.
Biological Psychiatry46:1309–1320.doi: 10.1016/S0006-3223(99)00140-7,PMID: 10560036
Belova MA, Paton JJ, Morrison SE, Salzman CD. 2007. Expectation modulates neural responses to pleasant and
aversive stimuli in primate amygdala.Neuron55:970–984.doi: 10.1016/j.neuron.2007.08.004,PMID: 17880899
Bermudez MA, Schultz W. 2010. Reward magnitude coding in primate amygdala neurons.Journal of