THE INFLUENCE OF OBESITY AND STRESS ON MUSCLE FATIGABILITY AND STEADINESS IN CAREER FIREFIGHTERS
Gena R. Gerstner
A dissertation submitted to the faculty at the University of North Carolina at Chapel Hill in partial fulfillment of the requirements for the degree of Doctor of Philosophy in the Curriculum
of Interdisciplinary Human Movement Science (School of Medicine).
Chapel Hill 2019
Approved by: Eric D. Ryan
ABSTRACT
Gena R. Gerstner: The Influence of Obesity and Stress on Muscle Fatigability and Steadiness in Career Firefighters
(Under the direction of Eric D. Ryan)
Firefighters often have a high prevalence of obesity, which may accelerate fatigue. This study examined whether obesity or stress impaired neuromuscular performance. Twenty-two normal weight (NW) and eleven obese (OB) participants completed isometric maximal voluntary contractions (MVCs) of the leg extensors followed by a 20%MVC fatiguing task and five
recovery MVCs in a control and a stressor (mental math) session. Sessions were randomized, in a counterbalanced design. Cardiovascular, perceptual, and surface electromyographic measures were assessed throughout the protocol. Repeated measures mixed models (controlling for age) results revealed OB firefighters exhibited greater fatigability (P = 0.040) and decreased
AKNOWLEGDEMENTS
This project was made possible through the support and guidance of my dissertation committee and colleagues within the Neuromuscular Assessment Laboratory. First, I would like to thank Dr. Eric Ryan for advising me over the past several years and helping me conduct a meaningful project that reflects my interests and the interests of the community. Additionally, I would like to thank my committee for providing me the insight and advice in developing this project as well as sound feedback on multiple occasions, reviewing this document, and assisting when necessary. Specifically, I would like to thank Dr. Brian Pietrosimone for consistently elucidating the clinical or real world meaningfulness to research, Dr. Johna Register-Mihalik for guidance on developing behavioral questionnaires and statistical analyses, Dr. Abbie Smith-Ryan for guidance on analysis decisions regarding body composition and nutrition measures, and Dr. Joseph Weir for easily breaking down difficult concepts into digestible information. I would also like to thank the Odum Institute for statistical consultation, our entire research team
TABLE OF CONTENTS
LIST OF TABLES ... x
LIST OF FIGURES ... xi
LIST OF ABBREVIATIONS ... xii
CHAPTER I ... 1
Statement of Purpose ... 3
Specific Aims ... 4
Specific Aim 1 ... 4
Specific Aim 2 ... 4
Independent Variables ... 5
Specific Aim 1 ... 5
Specific Aim 2 ... 5
Dependent Variables ... 5
Specific Aim 1 ... 5
Specific Aim 2 ... 6
Limitations ... 6
Delimitations ... 7
CHAPTER II ... 8
Background on the Fire Service: ... 8
Fatigability ... 9
Central Fatigue Mechanisms ... 10
Peripheral Fatigue Mechanisms ... 12
Task Specificity ... 15
Torque Steadiness ... 16
Considerations for Fatigability and Torque Fluctuations ... 19
Obesity ... 19
Cognitive Demand ... 20
Age ... 22
Sex ... 25
Obesity in the United States and the Fire Service ... 26
Obesity Health Outcomes ... 28
Firehouse Culture ... 29
Exercise and Diet Recommendations ... 31
Theory of Planned Behavior ... 33
Conclusions ... 36
CHAPTER III ... 38
Experimental Design ... 39
Protocol ... 39
Procedures ... 40
Body Composition ... 40
Isometric Strength Testing ... 40
Electromyography ... 42
Heart Rate and Pre-Ejection Period ... 42
Signal Processing ... 42
Perceptual Measures ... 44
Exercise Screening Questionnaire ... 45
Diet History Questionnaire ... 46
Exercise and Nutrition Behavior Questionnaires ... 48
Statistical Analysis ... 50
Specific Aim 1 ... 50
Specific Aim 2 ... 51
CHAPTER IV ... 53
Specific Aim 1 ... 53
Baseline, Rate of Perceived Exertion, and Mental Math ... 53
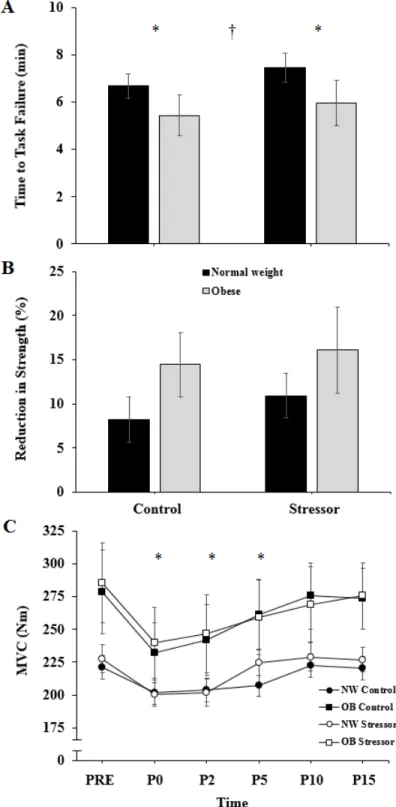
Time to Task Failure ... 54
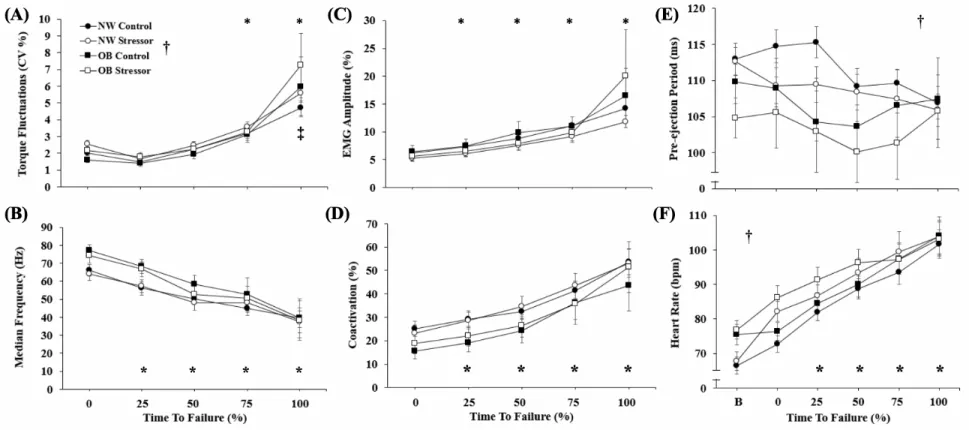
Torque Fluctuations ... 56
Surface Electromyography ... 56
Cardiovascular Response ... 57
Perceptual Assessments ... 60
Cardiovascular Relationships ... 60
Perceptual Relationships ... 61
Specific Aim 2 ... 61
Exercise Behavior and Habits ... 63
Eating Healthy Behavior and Habits ... 63
CHAPTER V ... 66
Specific Aim 1 ... 66
The influence of obesity on neuromuscular performance ... 66
The influence of stress on neuromuscular performance ... 68
Physiological and perceptual indicators of stress ... 69
Recovery from the fatiguing task ... 70
Limitations ... 71
Specific Aim 2 ... 72
APPENDIX 1: EXERCISE BEHAVIOR QUESTIONNAIRE ... 76
APPENDIX 2: EATING HEALTHY BEHAVIOR QUESTIONNAIRE ... 79
APPENDIX 4: RECRUITMENT ... 84
APPENDIX 5: FATIGUING TASK RAW MEANS ... 85
APPENDIX 6: RECOVERY RAW MEANS ... 86
LIST OF TABLES
Table 1. Mean ± standard deviation values for demographics in career firefighters ... 53 Table 2. Descriptive values for eating healthy and exercise habits and behaviors in career
firefighters ... 62
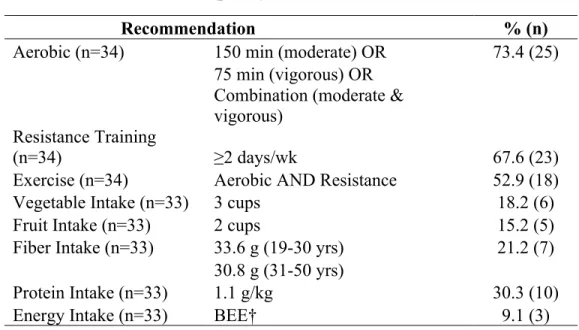
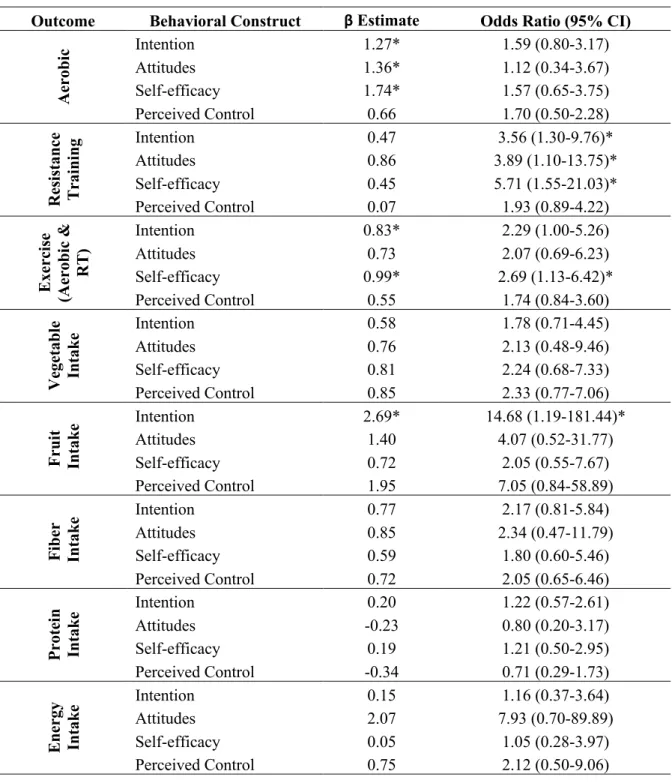
Table 3. Frequency of met recommendations ... 64 Table 4. Logistic regression coefficient estimates and odds ratios for meeting
recommendations for eating healthy and exercise as a function of behavioral constructs
LIST OF FIGURES
LIST OF ABBREVIATIONS
%BF Percent body fat
ACSM American College of Sports Medicine ANOVA Analysis of variance
ATP Adenosine triphosphate BEE Basal energy expenditure BMI Body mass index
C Control
Ca2+ Calcium ions
CNS Central nervous system CV Coefficient of variation
DEXA Dual energy x-ray absorptiometry DHQ Diet History Questionnaire
EMG Electromyography
FFQ Food frequency questionnaire
H+ Hydrogen ions
H-reflex Hoffmann reflex
HR Heart rate
K+ Potassium ions
MDF Median frequency Mg2+ Magnesium ions
MVC Maximal voluntary contraction
NFPA National Fire Protection Association NW Normal weight
O2 Oxygen
OB Obese
Pi, Inorganic phosphate PEP Pre-ejection period
PHLAME Promoting Healthy Lifestyles: Alternative Models Effects
PT Peak torque
PTSD Posttraumatic stress disorder RMS Root mean squared
RMSSD Root mean square of successive differences RPE Rating of perceived exertion
S Stressor
SD Standard deviation
CHAPTER I INTRODUCTION
Firefighters are critical members of the public safety sector, ensuring the safety of the community. As of 2015, there were approximately 345,600 career firefighters protecting the
majority of the United States (U.S.) population.1 Due to the dangerous and strenuous nature of
their jobs, and demanding work schedules (e.g. 24-hour shifts), they experience significant work-related fatigue resulting in one of the highest rates of occupational injuries,2 with an estimated cost between $2.8 - $7.8 billion dollars.3 It has been estimated that work-related fatigue has been linked to a majority of the fatal (69%) and non-fatal (48%) injuries in the fire service.4,5
steadiness or torque fluctuations.13,14 These neuromuscular assessments may provide important information about potential differences between normal weight and obese firefighters. Future well controlled studies are needed to determine if obesity specifically influences muscle fatigability and steadiness among firefighters.
It is well understood that firefighting is a physically demanding career, however, due to the spontaneous and inherent danger associated with their job, it is also cognitively demanding.15 For example, previous studies have found elevations in perceptual measures (thermal sensations, respiratory distress) and psychological measures (anxiety, tiredness, dysphoria) in firefighters performing live-fire activities.15,16 Most duties performed by firefighters require them to operate with additional cognitive stressors; for instance, making a quick decision on an exit strategy while rescuing a victim in a loud and hazardous environment. The addition of a simultaneous acute stressor has also demonstrated significant increases in sympathetic activation which has been associated with alterations in motor performance.17 It is possible that acute cognitive stressors may negatively influence fatigability and steadiness in firefighters, and these affects may be accelerated in obese firefighters,18 which may have significant implications on potential injuries and performance.
While firefighters face unique demanding work characteristics (e.g. shift work
challenges, smoke exposure, alarm response, irregular and sometimes extreme physical exertion) that adversely affect their health,19 they are also reported to have sub-standard lifestyle
understand why obesity is such a major public health concern in the fire service.23-25 Although qualitative studies23,24,26 have provided awareness into exercise and dietary habits in the fire service; there are no studies that explore differences in the exercise and dietary behaviors and habits (using the Theory of Planned Behavior [TPB] as a framework) between normal weight and obese firefighters. Intrapersonal behavioral constructs from TPB such as intention, attitudes, self-efficacy, perceived behavioral control27,28 have been cited as important determinants to performing a designated habit (e.g. exercise, eating healthy). The combination of exercise and diet has been the most effective way to prevent obesity;29 thus, understanding differences between normal weight and obese firefighters and whether exercise and dietary behavioral constructs may influence exercise and dietary habits, respectively, may help inform future interventions looking to reduce obesity in the fire service.
Statement of Purpose
Given the aforementioned high stress conditions of the occupation paired with the high prevalence of obesity in firefighters, the proposed study seeks to determine how obese
firefighters may perform under stress in comparison to their normal weight counterparts. Furthermore, the proposed study seeks to determine how obese firefighters differ from their normal weight counterparts regarding their exercise and dietary behaviors and habits. We are aware of no studies that have specifically examined potential differences in (1) muscle
fatigability and steadiness, or (2) exercise and dietary behaviors between normal weight and obese career firefighters. Thus, the purpose of the present proposal is to determine if: (1) obesity impairs the time to task failure and torque fluctuations during a sustained submaximal
contraction in career firefighters, which may be further exacerbated during a simultaneous
obese firefighters and whether these behavioral constructs are associated with habits. These findings are critical to better understand how obesity and stress may influence neuromuscular function in career firefighters and provide insight on intrapersonal behavioral constructs and habits for exercise and diet.
Specific Aims
Specific Aim 1: To examine the influence of obesity and stress on fatigability (time to task
failure) and steadiness (torque fluctuations) in career firefighters.
Hypothesis 1: We hypothesized that obese firefighters would exhibit greater fatigability
(decreased time to task failure) and greater torque fluctuations (decreased steadiness) compared to normal weight firefighters during an isometric fatiguing contraction.
Furthermore, normal weight firefighters would show differences between the control and stressor condition; however, fatigability and torque fluctuations would further impair in the stress condition for the obese firefighters.
Specific Aim 2: To examine the differences between normal weight and obese career firefighters
in (2a) exercise and (2b) dietary behavior constructs (i.e., intention, attitudes, self-efficacy, perceived control) and (2c) exercise habits and (2d) dietary habits, and to determine associations and odds ratios for meeting (2e) exercise and (2f) dietary recommendations as a function of behavioral constructs while controlling for percent body fat (%BF).
Hypothesis 2: We hypothesized that obese firefighters would demonstrate lower scores
positive relationship (while controlling for %BF status) between: (2e) exercise status and each behavioral construct to exercise, (2f.1) protein intake, (2f.2) fruit intake, (2f.3) vegetable intake, (2f.4) fiber intake and each behavioral construct to eat healthy. There would also be a direct negative relationship (while controlling for %BF status) between (2f.5) total energy intake and each behavioral construct to eat
healthy. Higher scores on the behavioral constructs would show higher odds of meeting each recommendation.
Independent Variables Specific Aim 1
• Group (normal weight/obese) • Condition (control/stressor) • Time
Specific Aim 2
o Part 2a – 2d
• Group (normal weight/obese) o Part 2e – 2f
• Exercise and dietary behavioral constructs (i.e., intention, attitudes, self-efficacy, perceived control)
• %BF status
Dependent Variables Specific Aim 1
o Primary Outcomes:
• Coefficient of variation (CV) of torque (i.e., steadiness or torque fluctuations)
o Secondary Outcomes:
• Electromyographic (EMG) amplitude (i.e., muscle activation) • Median frequency (MDF)
• Coactivation • Peak torque (PT)
• Heart rate (HR) and pre-ejection period (PEP) • Rate of perceived exertion (RPE)
• Anxiety and stress visual analog scale (VAS) scores Specific Aim 2
o Part 2a – 2d
• Exercise and dietary behavioral constructs (i.e., intention, attitudes, self-efficacy, perceived control)
• Exercise and dietary habits (i.e., exercise status, total energy intake, protein intake, fruit
intake, vegetable intake, fiber intake) o Part 2e- 2f
• Exercise and dietary habits
Limitations
• Participant recruitment took place throughout various fire stations in the local area and included volunteers, therefore participant selection was not truly random
• The sympathetic nervous system measurements (i.e., HR and PEP) may not fully represent
the sympathetic nervous system response to stress
Delimitations
• Participants were current career firefighters within the age range of 18-45 years old • Participants were in the body mass index (BMI) category of 18.5-27.4 kg·m-2 or 30-50
kg·m-2
Assumptions
• Participants provided accurate self-report data on the health and exercise history on the enrollment questionnaire
• Participants gave maximal effort during the isometric strength testing and fatiguing
contractions
• All equipment was calibrated and accurate for all testing sessions
CHAPTER II
REVIEW OF LITERATURE Background on the Fire Service:
Firefighters are critical members of the public safety sector and are oftentimes exposed to dangerous environments. As defined by the National Fire Protection Association (NFPA), career firefighters are: “…firefighters in public fire departments that protect people, their residences, and public buildings; they do not include firefighters working in private fire brigades, or for state and federal agencies.”1 The NFPA estimated 345,600 career firefighters were employed in 2015, which has steadily increased from 237,750 in 1986.1 This ~49% increase mirrored the ~49% increase in the number of fire departments that employ all or mostly career firefighters.1 These fire departments representing mostly career firefighters account for only ~15% of all departments yet protect ~65% of the U.S. population.1 Likely, this is due to most career firefighters being located in communities that protect ≥ 25,000 individuals.1 As of 2015, males accounted for 95.4% of all career firefighters with the majority of firefighters in the age group of 30-39 years old (26.7%).1 While fire departments protecting larger communities have a higher proportion of firefighters 30-49 years of age, firefighters can range from 18 to 60 years old with the
risk of musculoskeletal injury7 and poor performance during firefighting tasks.8 Because most firefighter duties must be performed with an additional cognitive stress (i.e., timely decision making), the profession is both physically and cognitively demanding.15
Fatigability
Fatigue is a broad term that is used to conceptualize: (1) fatigability and (2) perceptions of fatigue.30 Performance fatigability of the muscle may be attributed to muscle activation (i.e., voluntary activation, afferent feedback, neuromuscular propagation) and contractile function (i.e., calcium kinetics, force capacity, blood flow).30 On the other hand, perceptions of fatigue include homeostatic factors (i.e., blood glucose, core temperature, wakefulness) and
psychological state (i.e., arousal, mood, motivation).30 Fatigability is quantified by the
magnitude of decline in one or more aspects of motor performance such as skeletal muscle force, power, or reaction time.30 Specifically, skeletal muscle force can be measured in a number a scenarios such as during a prolonged task, during repeated contractions at a submaximal load, or when comparing performance before and after a fatigue inducing task.30-32 Oftentimes,
perceptions of fatigue are measured during or following a fatigability measure (i.e., prolonged submaximal muscle contraction) for sensations like muscle pain or discomfort, or the perception of effort, which accompany muscle fatigue.33 Fatigability may occur in various locations
Central Fatigue Mechanisms
Central fatigue, coined by Gandevia,35 describes the decline in voluntary activation during fatiguing muscle actions that occurs within the central nervous system (CNS). Several methods have been used to detect central fatigue. Gandevia et al.35 argues the distinction between force from a maximal voluntary contraction (MVC) versus force that is maximally evoked. For instance, a common method used is the twitch interpolation technique which involves either surface stimulation of the muscle, or electrical or magnetic stimulation of a peripheral nerve (e.g., femoral nerve) in conjunction with an MVC. The twitch interpolation technique uses a supramaximal stimulation to compare the evoked force (i.e. maximal force the muscle is capable of producing independent of central drive) with the force produced from an MVC.36 This allows investigators to determine whether impairments in voluntary drive are a factor in the reduction of muscle contractile force during and following fatiguing efforts.36 Another method employed, which assesses spinal cord excitability, is the stimulation of peripheral, afferent nerves to measure the Hoffmann reflex, or H-reflex.31,37 The activation of the motoneurons in the spinal cord provokes a twitch response in the muscle which can be assessed with surface electromyography (EMG).37 Lastly, transcranial magnetic stimulation (TMS) is a technique that uses an magnetic field generator, placed over the motor cortex, to measure the connections between the CNS and the skeletal muscle which may detect lapses in cortical drive.38
voluntary force/torque are accompanied by increases in the superimposed twitches evoked by the stimuli to the motor nerve and motor cortex, respectively.39,44 An increase in the superimposed twitch evoked by stimulation of the motor nerve indicates that some motor units (MUs) are no longer being activated or firing at a rate to produce fused tetanus, whereas the increase in the superimposed twitch evoked by stimulation of the motor cortex indicates that voluntary output from the motor cortex has become inadequate.44 Mechanisms that have been suggested in regard to the motor nerve deficit include (1) a reduction in descending impluses to motoneurons and (2) inhibition or disfacilitation of the motoneuron pool through altered afferent input.40,45 For example, afferent (sensory) feedback from the fatigued skeletal muscle such as metabolite (inorganic phosphate [Pi], potassium [K+]) accumulation that may lead to discomfort or pain would inhibit motor neuron excitability.45 However, supraspinal mechanisms (i.e. premotor and motor cortex) also contribute as exhibited by motor cortical stimulation.39,46,47
While the aforementioned methodology can be used to quantify central drive deficits, central drive remains difficult to study for several reasons. The ability to observe a difference in force from voluntary activation and a superimposed stimulus is dependent on whether
Peripheral Fatigue Mechanisms
Peripheral fatigue typically refers to impaired neuromuscular propagation, excitation-contraction coupling, and/or metabolic changes (e.g. depletion of glycogen, metabolite
accumulation).52 The compound muscle action potential (M-wave) helps researchers understand peripheral fatigue, which occurs on EMG recordings when a supramaximal stimulus is applied.53 There are a number of considerations when measuring the M-wave including [but not exhaustive to]: the type of EMG detection being used, anatomical features of the muscle (e.g., muscle fiber arrangement, subcutaneous fat thickness, distribution of MUs), contraction induced changes in the muscle architecture, muscle membrane properties, muscle temperature, and potential crosstalk from other tissues.54 Impaired neuromuscular propagation has been suggested to encompass the increase in recruitment threshold of axons, failure at the neuromuscular junction, and impaired sarcolemmal membrane excitability.54 Of these three propagation issues,
coupling. Specifically, this has been shown in the leg extensors.55-58 However, given the new recommendations of M-wave investigation,54 this could have implications on previous findings. The M-wave can be measured in conjunction resting twitches before and after a fatiguing task;64 however, resting twitches have also been used as a standalone measurement to examine
contractile properties.65
As a result of the phosphocreatine system and anaerobic glycolysis, a number of metabolites can accumulate including Pi, lactate, and hydrogen ions (H+). Five potential mechanisms have been proposed for how Pi can impair contractile function.66,67 They are: (1) directly hindering cross bridge configuration to a high-force state; (2) reducing myofibrillar calcium (Ca2+) sensitivity; (3) increasing the probability of the sarcoplasmic reticulum
Ca2+ release channels to be open; (4) inhibiting the uptake of Ca2+ by the sarcoplasmic reticulum; (5) Ca2+- Pi binding in the sarcoplasmic reticulum, which decreases the amount of Ca2+ available for release.66,67 It has been suggested that oxygen (O2) may determine the rate of Pi
accumulation, which would modulate the onset of fatigue.68 That is, reductions in inspired O2 can increase phosphocreatine hydrolysis even when O2 consumption is submaximal.68,69
The accumulation of lactic acid is often cited to induce muscle fatigability.70-72 With the rapid dissociation of lactic acid into lactate and H+ ions, the accumulation of H+ ions increases the acidity, or decreases the pH level within the muscle cells.72 Suggested effects of H+ are the reduction of the sensitivity of the myofibullar proteins to Ca2+, in turn decreasing cross-bridge cycling52 and the reduction of force per cross-bridge.73 Furthermore, increased buffering
In addition to the accumulation of Pi and H+, the buildup of K+ and magnesium (Mg2+) may also impair excitation contraction coupling. Due to repeated action potentials, accumulation of extracellular K+ depolarizesthe sarcolemma and decreases the amplitude of the action
potential.79 Subsequently, less Ca2+ may be released from the sarcoplasmic reticulum, or some fibers may not be excitable if threshold potential is not achieved80 thereby decreasing the force produced. Furthermore, the buildup of Mg2+ as adenosine triphosphate (ATP) is broken down inhibits the Ca2+ release channels in the sarcoplasmic reticulum.81
Interestingly, caffeine has been used in fatigue studies57,82,83 as it is known to facilitate the release of Ca2+ from the sarcoplasmic reticulum. Eberstein and Sandown82 were the first to suggest that the reduction in excitation-contraction coupling was an important fatigue
mechanism because caffeine could restore force production after fatigue. Contrarily, caffeine has been used to demonstrate that regardless of Ca2+ concentration after fatigue, mechanical performance of the myofibrils is still affected.83 Therefore, myofibullar fatigue has also been suggested as a mechanism due to evidence that myofibullar function is dampened regardless of impaired excitation-contraction coupling or metabolite concentrations.83,84
Task Specificity
Fatigability of a sustained contraction is dependent on the type of task (i.e., position, musculature, intensity).30,87-89 For instance, there are differences in fatigability between force tasks and position tasks.88,90 Time to task failure seems to be briefer during position tasks in which participants needed to maintain a specific joint position (e.g. 0º of flexion; neutral ankle) at the same intensity of the force task (e.g., 20% MVC) with an external load suspended from the foot.88 This was accompanied by greater force fluctuations, mean arterial pressure, HR, and rating of perceived exertion.88 It is possible that the shorter time to task failure during position tasks may be due to greater rates of inhibition and excitation of afferent neurons, suggesting central fatigue is more at play.90
Muscle-specific differences can also influence fatigability based on fiber type
composition and architecture.30,91 For example, muscle fibers of the vastus lateralis may be more type II in nature92 whereas muscle fibers of the soleus may be primarily type I in nature.93 In a meta-analysis by Frey Law and Avin regarding muscle-specific endurance time in static
contractions,89 the plantar and dorsiflexors were the most fatigue resistant while the leg extensors and rotator cuff muscles where the most fatigable, which supports the aforementioned muscle-specific differences. In a study investigating time to task failure in four muscle groups, the plantar flexors were the most fatigue resistance and the only muscle group to have significant declines in voluntary activation.94 This may suggest that that central fatigue is more indicative of plantar flexor time to task failure, while peripheral fatigue is more indicative of time to task failure for the other muscle groups (elbow flexors, knee extensors, thumb adductors).94
Torque Steadiness
If an individual is performing a contraction regardless of what muscle is used, the force exerted fluctuates about an average value.95 These force (or torque) fluctuations are often referred to as steadiness or the control of force (greater fluctuations meaning decreased steadiness or control). This variability about the mean is usually quantified as the standard deviation (SD; absolute) or the coefficient of variation (CV; relative), which varies dependent on the mean of the force exerted.95 Force fluctuations that occur during a voluntary contraction may influence the ability to achieve a desired force as well as the ability to produce an intended limb trajectory.13 Especially in a rapid, coordinated movement such as throwing a dart, a large activation signal is required, which increases the motor output variability, making it more difficult to move smoothly and accurately.13,96 The clinical (or for the purpose of this proposal, occupational) relevance is that force regulation at submaximal forces have implications on functional performance such as a history of falling97 and stair climb.98 For the successful completion of a task or goal-directed movement, force fluctuations must be accommodated for by the MU activation signals sent to the muscle.13 Steadiness is regulated by MU recruitment during muscle contraction, or the MU firing behavior.99 The firing behavior involves several aspects: discharge rate, the variability of discharge rate, MU synchronization, and common drive to MUs.100 It seems that increased force fluctuations induced by fatigue are central in origin, and are chiefly determined by an increase in the number of MUs recruited and/or an increase in discharge rate.101
2-95% MVC.102 There was a decrease in force fluctuations (4.9 to 1.5%) as force increased from 2-15% MVC, but held constant at higher forces.102 After adjusting the MU simulation to this finding, there were no differences in the experimental force variability and the simulated model, further supporting that discharge rate variability is a major determinant in isometric force variability across the operating range of a muscle.102 At low force levels (2-5% MVC), most MUs exhibit high relative discharge rate variability, resulting in greater force fluctuations whereas at intermediate forces (15–50% MVC), most of the MUs have low relative discharge rate variability; therefore, force fluctuations are lessened.102 This trend continues at high forces (70–95% MVC), where all MUs are recruited and both discharge rate variability and force fluctuations are reduced.102
Tracy et al.95 indicated that the relative discharge rate explained only 30% of the variance in force fluctuations for older adults. Another factor to consider with discharge rates is whether neurons are low or high threshold. Likely due to axon diameter and membrane resistance, high-threshold motor neurons reach greater discharge rates compared to low-high-threshold neurons.103 Moritz et al.102 found that minimal and peak discharge rates were greater for high-threshold MUs as compared with low-threshold MUs. Nevertheless, these findings are inconsistent.104
However, taken with other discharge characteristics (i.e. recruitment range, minimal and peak discharge rates) versus the discharge of a single MU, it is clear that motoneuron properties are interrelated.95,102 For instance, excitatory responses may be induced in multiple motoneurons simultaneously, termed MU synchronization.105 Yao et al.106 found that MU synchronization evoked a significant increase in EMG amplitude and reduced force steadiness using a simulated model. Motor unit synchrony has been found to increase during fatigue.107
that force fluctuations can be influenced by other factors. These factors include: (a) the muscle group executing the task;13,110 (b) the type of contraction;13,111 (c) the intensity of the
contraction;13,112 and (d) the physical activity status of the participant.13,97 Much of the literature is centered around the hand (i.e. first dorsal interosseous muscle),95,102,113 the knee
extensors,110,114,115 with fewer studies focused on other muscle groups such as the and elbow flexors.116 Dynamic contractions, which are measured by the SD of acceleration, are comparable for slow concentric and eccentric contractions.117 Trial-to-trial variability tends to be greater for rapid eccentric contractions, with fluctuations greater at moderate-to-fast speeds.117 Similar to isometric contractions, fluctuations in acceleration during slow dynamic contractions are greater in the first dorsal interosseus as compared to the elbow flexors and knee extensors.118 The intensity (i.e. magnitude of force) of the contraction also exhibits an increase in SD of force with increased target force (i.e. higher percentage of MVC), which is unlike the aforementioned relationship of the relative force measurement.119,120
Some studies support the finding that skills training and/or strength training can be effective at increasing steadiness in older adults.113,121 Torque steadiness has been noted as a predictor of functional performance.122-124 For example, force steadiness of the knee extensors is an independent predictor of chair rise time and stair climb power in older women when
Considerations for Fatigability and Torque Fluctuations
There are numerous considerations when measuring fatigability and torque fluctuations in various populations. Notable considerations are obesity, stress (i.e., imposing a cognitive
demand), age, and sex. See below for further detail.
Obesity
Greater fatigability has been reported with obesity.10,125 For instance, shorter endurance times and higher rates of strength loss have been observed during shoulder flexion tasks.10,125 Obese individuals typically exhibit higher absolute isometric strength, but lower relative strength (to body mass) than their non-obese counterparts.126 While obese individuals may exhibit a higher proportion of fast-twitch (fatigable) muscle fibers, relative strength may attenuated due to the infiltration of fat (non-contractile tissue) in the muscle which would limit contractile
properties.127,128
A study by Pajoutan et al.65 investigated central and peripheral fatigue in obese and non-obese individuals for sustained isometric fatiguing tasks (30% MVC, 60% MVC) of the deltoid. Central fatigue was quantified by % central activation ratio (pre-post), whereas peripheral fatigue was quantified as a decrease of muscle twitch amplitude (pre-post task relative to pre).65
Interestingly, the authors found that obese individuals displayed higher central fatigue impairment, and trended toward lower peripheral fatigue impairment compared to their non-obese counterparts.65 It was suggested that obese individuals may have had faster task
important to note that peripheral factors such as the obesity-related decrease in capillary
density130 and blood flow,131 and higher proportion of fast-twitch (fatigable) muscle fibers127 are also influential.
It seems as though few studies have investigated obesity and force fluctuations, with one study examining the obesity-related differences in control of force and prefrontal cortex
activation.132 Using intermittent handgrip and elbow flexion task at 30% MVC, obesity was associated with greater force fluctuations and lower prefrontal cortex activation for the handgrip but not the elbow flexors.132 This further indicates that neural correlates may be muscle-specific; however, the authors acknowledge that future work is warranted as this is a relatively unexplored area of research.132
Cognitive Demand
The influence of stress on low-intensity contractions, which are essential for daily functioning, has implications on musculoskeletal performance. For instance, an acute stressor increases sympathetic outflow, which immediately affects motor control, and not always in a functionally advantageous manner.133 Sympathetic activation modulates skeletal muscle contractility133 and the discharge of numerous receptors (e.g., muscle spindles)134 and can decrease blood perfusion to skeletal muscles to maintain arterial blood pressure.135
pressure), hormonal assessment of arousal (i.e., cortisol), and cognitive assessments of anxiety (i.e. State-Trait Anxiety Inventory [STAI], VAS of anxiety and stress) have been measured concurrently and were elevated during the stressor session compared with the control
session.17,136 Furthermore, a low-cognitive demand (mental-attentiveness) task has also been compared to the high-cognitive demand to confirm stress was induced in the high-cognitive demand.136 The mental-attentiveness session did not differ from the control session in time to task failure, VAS scores, or in HR or mean arterial pressure.136
In healthy young adults, an acute stressor (i.e., mental math) has been shown to reduce steadiness and time to task failure for low-intensity isometric contractions,136,139,141 yet others have found no change.142 Yoon et al.136 found that steadiness and time to task failure declined during a sustained 20% MVC task of the elbow flexor muscles when simultaneously performing a high-cognitive demand task. Furthermore, individuals who are weaker (primarily women, but also men) showed the largest reduction in time to task failure when the cognitive task was imposed during the fatiguing contraction.17,136
In older adults, greater fluctuations in torque were seen for low (5% MVC; non-fatiguing) to moderate (30% MVC; fatiguing) isometric tasks of the ankle dorsiflexors compared to
younger adults and these fluctuations were exacerbated when the cognitive demand was imposed while young adult showed no change.142 Although time to task failure did not differ between groups or sessions.142 The authors suggest that increased cortical involvement of motor and non-motor cortical areas in older adults disrupt motor performance to a greater extent than young adults.142
stress did not influence time to task failure or force fluctuations for either group. Veterans with PTSD also exhibited elevated baseline levels of anxiety (VAS and STAI) and HR. Interestingly, the stress session blunted the cortisol response in the veterans.140 Keller-Ross et al.140 suggest that these baseline differences may be due to dysfunctions in the balance of cortico-motor excitability and inhibition or due to vasoconstriction and reduced blood perfusion.140
Regarding stress and obesity, Mehta18 explored the impact of stress on neuromuscular fatigue and associated heart rate variability in obese adults using intermittent 30% MVC contractions to exhaustion. The author found significant obesity-related declines in endurance time, rate of strength loss, and perceived effort in a stress condition (mental math) compared to a control condition, and blunted heart rate variability during the stress condition. Therefore, those with a higher BMI (and %BF) were more susceptible to fatigue, particularly in the high-stress condition. While Mehta18 did not find any obesity-related differences in handgrip fatigability when compared to the non-obese counterparts, this may be due to muscle-specific and/or contraction-type differences. However, other studies with intermittent tasks, which included young and older adults, have exhibited shorter shoulder flexion10,125 and handgrip10 endurance times with obesity.
Age
Advancing age is responsible for numerous impairments in older adults presented
through declines in motor performance, such as the reduced ability to perform steady movements and exert constant forces.143,144 Older adults, especially after the fifth decade,108 tend to be less steady than younger adults, exhibiting greater fluctuations in force around a target force.13 However, since there is a selective reduction of fatigable (fast twitch) muscle fibers with
performing sustained task at a submaximal intensity.147,148 Previous studies have found that older adults (~60-79 yrs) experience less fatigue during isometric contractions than younger adults.34,149,150 This resistance to fatigue is not present when older adults perform high to moderate velocity dynamic contractions, nor is it present in very old individuals (>80 yrs). 149,151-156 Differences in fatigability for contraction type is also likely due to the selective loss in fast twitch fibers. For instance, older adults experience greater losses in power production during fatiguing isotonic (unconstrained velocity) contractions compared to younger groups, but do not differ following fatiguing isokinetic contractions.157,158 When velocity is measured as a part of a strength assessment (dynamic contractions; power = torque × velocity), age-related impairments in contractile shortening velocity are apparent.158 Furthermore, older adults use greater amounts of ATP per contraction,159 potentially leading to greater metabolite buildup within the muscle tissue during isotonic contractions, and ultimately affecting fatigability and power loss in aging populations.160,161
It has been suggested that older individuals experience greater central fatigue than younger individuals.162 For instance, older adults exhibited greater between- and within-participant variability in activation of supraspinal centers compared to young adults during MVCs.163 Hunter et al.163 found that during sustained isometric MVCs, older adults displayed less peripheral fatigue (likely due to muscle fiber types) and greater central fatigue (impaired recovery from supraspinal fatigue). This may indicate that there is greater variability within cortical motor areas in aging populations.163 Other possible changes in central drive have been noted such as excitability of the corticospinal tract,164,165 neuromuscular propagation,166 and cortical atrophy, reduced white matter, or altered neurochemistry.167-170
seems to be greatest during low-intensity isometric contractions in both lower and upper
extremity muscles.13,14 For the aging population, the functional impact of moving precisely and exerting or maintaining steady forces can be translated to daily activities.171 There are several mechanisms related to motoneuron properties that influence force output variability. One mechanism proposed for the loss of steadiness seen in older adults is MU discharge rate variability.108,172 Steadiness of a contraction may be maximized when MUs exhibit low
variability in discharge rates and are not synchronized.173 Constant force and constant load tasks have been utilized due to differences in the modulation of MU discharge rates.116 In a study by Laidlow et al.,108 recruitment thresholds and the mean discharge rates were similar between young and older adults; however, the variability of the discharge rates were greater for the older adults for both tasks.108 Additionally, older adults displayed greater variability in lengthening contractions (>40%), than the isometric contractions (28-34%).108 Therefore, the greater variability of the discharge in a single MU contributes to the reduced ability to perform steady muscle contractions. Furthermore, Tracy et al.95 found an association between the relative force fluctuations and discharge rate variability for older adults, but did not see this relationship in younger adults.
adults, relative force fluctuations are still exhibited regardless of whether there is a difference in absolute MVC force in comparison to younger adults.108,119-121 Therefore, while older adults are weaker and less steady than younger adults,13,163 the greater force fluctuations exhibited in older adults is not necessarily due to weaker muscles as evidence suggests in healthy populations older adults may have comparable muscular strength.119
Sex
area in men and 44.0% in women, while type IIa fibers accounted for 41.2% in men and 33.6% in women. Additionally, women have a slower relaxation rate during electrically evoked
fatiguing contractions,181 which has been correlated to rate of fatigue (i.e. the slower the muscle, the more fatigue resistant).161
Sex differences in force fluctuations are have also been cited, with increased strength improving force steadiness.177,188 Brown et al.177 and Harwood et al.188 found that males exhibit greater steadiness than females. It is difficult to determine whether this difference is due to higher MU discharge rates, as strength has been associated with higher MU discharge rates,189 since there has not been a strength-matched study.188 However, it has been suggested that a greater number of alpha motor neurons (and the accompanying MUs) in males may explain the lower force variability.188 It has also been suggested that it is unlikely MU discharge variability is a contributing factor to the sex-related differences in steadiness.188
Obesity in the United States and the Fire Service
Obesity is defined as the accumulation of excess fat that subsequently negatively impacts health, and is most commonly identified using the indirect measure of BMI (body mass [kg]/ height2 [m2]).190 While BMI has high specificity (0.90) but low sensitivity (0.50),191 it is an easy way to screen individuals and to use for surveillance/epidemiological purposes. A BMI of 30 or above is considered obese, with three classes defined as I: 30-34.9, II: 35-39.9, and III: ≥40 kg/m2.191 These cut-offs are based on risks for cardiometabolic disease and premature
mortality.192 There are more sensitive, direct measures such as dual energy x-ray absorptiometry (DEXA) that examines body composition.193 A more precise measure for %BF is a
Multi-compartment models are known for their increased precision when evaluating body composition.195 The cut-off for obesity in males using %BF has typically been >25%.191
Adult obesity has shown an increasing trend between 2003–2004 and 2013–2014, with the current prevalence of obesity among U.S. adults at 39.8%.196 Furthermore, men aged 40–59 years were reported to have a higher prevalence of obesity than men aged 20–39 years (40.8% versus 34.8%).196 Specifically in North Carolina, obesity in adults is 31.8%,197 lower than the national average yet still one of the states with a higher prevalence. Previous research6,198 has demonstrated that the prevalence of overweight and obesity among firefighters is greater than it is general population (>75%). Considering the aforementioned demographics of the population (i.e., the majority off firefighters being male and the wide range of age), this is not surprising. Moreover, with the general population increasing in obesity,196 the pool of normal-weight individuals that are recruited as incoming firefighters is smaller.
While stress has been linked to increased sympathetic activity,211 so has obesity,212 further disrupting cardiovascular function. Therefore, obesity may compound the stress response leaving obese firefighters at greater risk for injury due to poorer performance,8 and chronically, at greater risk for disease.19
Obesity Health Outcomes
Increased morbidity and mortality has been linked to obesity.213-215 There are several well-established comorbidities of obesity such as hypertension, hyperlipidemia, and diabetes. 213-215 For instance, excessive body weight may account for up to one in four of cases of
hypertension.215 The risk of abnormal lipid metabolism (e.g. high low-density lipoproteins and triglycerides) is increased for obese individuals, particularly individuals who exhibit central fat distribution.213 Increasing BMI in firefighters has been associated with hypertension and
dyslipidemia.6 Heart disease is also a significant comoribidy,214 which is no surprise since obese firefighters exhibit more cardiovascular risk factors like hypertension and dyslipidemia.6 Sudden cardiac death is consistently reported as the leading cause of line-of-duty death in firefighters usually accounting almost half of deaths each year.19,216 Not only has hypertension and dyslipidemia been apparent when comparing normal weight and obese firefighters,6 obese
firefighters are also more likely to suffer from greater arterial stiffness,217 lower cardiorespiratory fitness,6 reduced muscular strength,6 and more frequent cardiac events that are fatal.218 It is also important to note that regardless of demographic factors (i.e. age, physical activity levels, etc.), obesity has been linked to an increased rate of all-cause mortality219 and a decreased life expectancy.220
proportion of disease related to obesity in firefighters (e.g. 20-30% hypertension217,222), it is no surprise that obesity is associated with lower job performance,8,223 more work limitations, and higher workers’ compensation claims.224,225 For example, obese firefighters cost more in terms of healthcare dollars as well as miss more days of duty221 and are at greater risk of disability.226 In 2011, a study by Poston et al.221 found that compared to normal weight firefighters, those who were overweight ($74.41/firefighter), class I obese ($254.00/firefighter), and class II or III obese ($1,682.90/firefighter) added costs to fire departments due to greater missed days of work after injury. In addition, obese firefighters missed almost 5 times as many days than their normal weight counterparts.221
Firehouse Culture
Qualitative studies have shed some light on the culture in the fire service.23,24,26 Dobson et al.23 found a strong interrelationship between occupational behaviors and health behaviors causing obesity among firefighters. Five thematic topics emerged, demonstrating occupational, cultural, and individual causes of obesity.23 They were:
(1) Eating culture at the fire station
a. Eating out or family-style meals (e.g. sharing meal costs) b. Portion size (e.g. eating larger quantities)
c. Traditions and peer pressure (e.g. resistance to change, eating what others eat) d. Eating patterns due to call interruptions (e.g. eating fast)
e. Eating culture affects changing (e.g. no routine, easier to eat healthy at home) f. High caloric snacking (e.g. at night)
(2) Calls during the night and sleep interruption
(4) Sedentary work (e.g. moving up in rank means the job is less physically demanding) (5) Age and generational influences (e.g. less time to take care of self, more family or work responsibilities with age, younger individuals are less active due to the “Facebook Generation”).23
These findings suggest that exercise and eating patterns are a product of several factors aside from individual choice; however, it is important to note that exercise and eating patterns are modifiable and may take far less time to change in a positive manner. Because work conditions and culture are heavily influenced by policy, it is more difficult to target these aspects in the short term.
Another qualitative study by Jahnke et al.24 expressed concerns about health in the fire service with similar themes developing such as physical activity and fitness, nutrition and sleep. In addition, concerns about increased risks of cancer, cardiovascular disease, and injuries as well as mental health issues due to stress or exposure to trauma were communicated.24 Staley et al.26 reinforces some of these issues as barriers. Intrapersonal barriers that subsisted were personal motivation in relation to fitness, poor nutrition due to expectations for firefighters to eat together, physical fitness beliefs, and knowledge about cardiovascular diseases and associated risks.26 Interpersonal (i.e. crew dependability, social cohesiveness, crew and Captain fitness norms) and organizational (i.e. participation strategies, work environment factors, management support, management fitness norms) barriers were also identified.26
maintained.229-231 Therefore, these studies suggest that aiming to change behavior toward exercise and nutrition can be effective but needs to be continually reinforced over time. The combination of exercise (both aerobic and resistance) and diet is noted as the most effective way to prevent obesity.29 Although exercise can increase energy expenditure, it is important to be aware that when planning interventions, exercise cannot compensate for a poor diet.232
Exercise and Diet Recommendations
Currently, the exercise guidelines from the American College of Sports Medicine (ACSM) suggest that adults should be getting both aerobic and resistance exercise on a weekly basis.192,193 For aerobic exercise, recommendations include at least 150 minutes per week of moderate-intensity activity (i.e. brisk walking), 75 minutes of vigorous-intensity activity (i.e. jogging), or any combination of moderate and vigorous-intensity that is equivalent.233,234 For resistance exercise, recommendations are to train each major muscle group 2-3 days per week.233,234
commonly used BEE prediction, which uses body mass, stature, and age. It is important to note that most predication equations have limitations; for the Harris-Benedict equation, it may
overestimate BEE for obese individuals, especially those over a BMI of 40 kg/m2.236 This is due to obese individual having less lean mass than a non-obese individual at the same body mass.236 Thus, obese adults may exhibit reduced BEE per kilogram of body mass.236 Other equations have been proposed to predict BEE that are better suited to account for fat free mass. For instance the Nelson equation,237 utilizes fat and fat free mass of an individual.
The 2015-2020 Dietary Guidelines235 also provide a recommended range of protein intake (6-7 ounce-equivalents) for males 18-50 years old, but also do not consider body mass. It has been proposed that higher-protein diets (> 1.0 g/kg) may attenuate cardiometabolic risk,238 with 1.1 g/kg body mass being noted as ideal for healthy men.239,240 Typically, higher levels of protein intake are recommended to preserve lean mass in adults with acute or chronic disease (e.g., type 2 diabetes).241 Moreover, > 0.8 g/kg has been associated with more favorable body composition in career firefighters242 considering the high metabolic demand firefighters may experience at their job.207-210
To date, there are no mandated fitness standards implemented in the U.S. for
firefighters.22 The NFPA outlines a few standards that relate to health, fitness, and/or wellness, which include NFPA 1500, NFPA 1583, and NFPA 1582.22 These standards suggest that there should be physical performance requirements for candidates and members who engage in emergency operations (1500), provide outlines for fitness and health promotion program
fitness level to perform job functions safely and to reduce the probability or severity of injuries and illnesses they may incur on the job. However, while it is noted as “mandatory,” and fire departments test their candidates, the fitness testing for current members is non-punitive. Therefore, not all fire departments choose to monitor fitness of their current members on an annual basis, if at all. One longitudinal study reported that suggesting firefighters may gain between 1.1-1.9 pounds per year of active duty over a 5-year period.199 Due to this loophole in the standards, several initiatives have attempted to improve firefighter health and well-being. Some of these initiatives include the Promoting Healthy Lifestyles: Alternative Models Effects (PHLAME) Firefighter Study,227 the National Voluntary Fire Council Heart-Healthy Firefighter Program,244 and the Wellness Fitness Initiative through the joint effort of the International Association of Firefighters and the International Associations of Fire Chiefs.245
It is clear this shift in weight gain over time spent in the fire service is from the
accumulation of poor exercise and dietary habits, compounded by work characteristics such as stress and shiftwork. Therefore, there needs to be some framework to address the cultural components; specifically, how behaviors may influence modifiable lifestyle characteristics (i.e. exercise and diet).
Theory of Planned Behavior
eating is defined in relation to current dietary recommendations to meet accepted standards of total energy,236 protein,239,240 fiber,3 and fruit and vegetable consumption.3 While actually performing exercise and healthy eating are “behaviors,” to avoid confusion, they are referred to as “habits.” The TPB is an extension of the theory of reasoned action,247 which examines the influence of attitudes, subjective norms, perceived behavioral control, and intention of the designated habit on actually performing said habit.248 Intentions (the decision to exert effort to perform the habit) are typically determined by attitudes, subjective norms, and perceived behavioral control.248 Attitudes signify the evaluation of the habit, subjective norms signify perceived pressure from others to perform the habit, and perceived behavioral control signifies the extent to which performing the habit is within one’s control (or is easy-difficult).248 For the purpose of this study, each behavioral construct of TPB including intention was evaluated separately in terms of whether the habit was performed.
Perceived behavioral control has been noted to be similar to Bandura’s249 self-efficacy. Azjen248 makes the distinction between controllability and efficacy, indicating that self-efficacy is related to internal aspect of control. Studies have supported the assertion that there is a distinction between perceived behavioral control and self-efficacy.250,251 For instance, one study251 found that self-efficacy predicted exercise intention and not the habit, whereas perceived behavioral control predicted the habit and not intention. Due to this distinction, this study aimed to measure both perceived behavioral control and self-efficacy, separately.
Previous meta-analyses27,28 provide support for the TPB expressed as the percentage of variance explained in intentions of a designated habit and the habit itself. Armitage and
Individual significant (P < 0.001) correlations between intention and habit (r = 0.47) as well as perceived behavioral control and habit (r = 0.37) were also reported.27
A meta-analysis252 of 72 studies explicitly on physical activity that examined the relationship between the constructs of TPB and their ability to predict either intention or performing physical activity. Hagger et al.252 found that attitudes, subjective norms, and perceived behavioral control accounted for up to 44.5% of the variance in intention. The most significant predictors of intentions were attitudes (β = 0.40) and perceived behavioral control (β = 0.33), while subjective norms (β = 0.05) was also significant, but had a lower prediction rate.252 Regarding physical activity as a habit, intentions (β = 0.05 - 0.51), perceived behavioral control (β = 0.12 -0.223), and self-efficacy (β = 0.04 – 0.15) were reported to have a significant impact on the regression models.252 Average reweighted correlations (corrected for sampling and measurement error) were also reported for attitude-habit (r = 0.35), perceived behavioral control-habit (r = 0.39), subjective norms-habit (r = 0.17), intention-habit (r = 0.51), self-efficacy-habit (r = 0.40).252
In 2001, Hagger et al.253 demonstrated that positive attitudes and high self-efficacy were more likely to form intentions to exercise, but subjective norms and perceived behavioral control were not strong predictors. A study on obese adults254 also revealed subjective norms were not a significant determinant of intention to be physically active whereas perceived behavioral control and attitudes were independent determinants. Another study by Brickell et al.,255 found that attitudes and perceived behavioral control accounted for 36% of the variance in intention to exercise, but subjective norms were not significant. Additionally, intention but not perceived behavioral control was a significant predictor of 2-, 3-, and 5-week exercise habits.255
perceived behavioral control (r = 0.32), and attitudes (r = 0.49), but not subjective norms (r = 0.11).255
Regarding eating healthy, findings from Armitage and Conner256 indicated that the TPB usefully predicted low-fat eating intention and habit (based off of a food frequency questionnaire [FFQ]). The regression analyses revealed that intention was the only predictor of the FFQ habit of eating low fat.256 Significant (P<0.01) individual correlations with eating a low-fat diet were noted for intention (r = -0.41), attitudes (r = -0.37), and self-efficacy (r = -0.31), while subjective norms (r = -0.21) were significant to a lesser extent(P<0.05), and perceived behavioral control (r = -0.14) was not significant.256 Considering the aforementioned behavioral studies253-255 have found that subjective norms were not a strong predictor of habit, for the purpose of this project, we did not measure this behavioral construct. While TPB constructs may not always explain whether a habit is performed, it has been used in this context and is a reasonable theory to assess exercise and eating habits.
Conclusions
It cannot be overstated how imperative it is to understand how obesity affects career firefighters. Operating on the job safely for themselves, their crew, and the communities they serve is of utmost importance. There is a dearth of information on both the impact obesity has on neuromuscular function and how behavior may influence obesity. Relative to the present
CHAPTER III METHODOLOGY Participants
Thirty-four male career firefighters volunteered for this investigation and were
categorized into two groups. Firefighters were initially recruited into normal weight or obese groups according to BMI. Normal weight (NW) firefighters were considered to have a BMI of 18.5-27.4 kg·m-2;257 whereas obese (OB) firefighters were considered to have a BMI: of 30-50 kg·m-2. Body composition measures were performed to confirm group placement. Using a ≤25%BF cutoff based on standards created by Heo et al.,258 which approximates a BMI of 25, twenty-three were placed in the NW group and eleven were placed in the OB group
(demographics listed in Table 1). One NW subject did not report to the second testing session.
It is important to note that the reference percentage cutoff created by Heo et al.258 was based on DEXA versus the 4-compartment model used in the current study (see Body Composition). The primary exclusion criteria included: 1) metabolic disease (e.g., diabetes), 2) neuromuscular disease (e.g., peripheral neuropathy), 3) cardiovascular disease (e.g., coronary artery disease), 4) a history of major orthopedic surgery (e.g., knee/hip replacement, back fusion), 5) previous knee injury (e.g., anterior cruciate ligament, meniscus), 6) serious pain in the lower extremities during exercise, 7) a recent lower extremity injury in the past three months, 8) the loss or gain of 20 pounds in the previous two months, 9) highly trained individuals (>6 hours of vigorous activity per week), 10) current smokers259, 11) post-traumatic stress disorder (PTSD)140, and 12)
(i.e., anti-depressants, asthma inhalers, etc.). This study was approved by the institutional review board (IRB 18-1708) at the University of North Carolina at Chapel Hill for the protection of human subjects.
Experimental Design Protocol
Participants reported to the laboratory on two separate occasions (4-14 days apart) to complete a control (C) and stressor (S) session in a randomized, counterbalanced design (C:S, S:C).136,137 On both visits, participants arrived to the laboratory eight hours fasted. During the first visit, participants provided informed consent, completed an exercise status and health history questionnaire as well as behavioral questionnaires about exercise and diet, and completed body composition testing. (Note: all nutritional screening was completed between sessions; see
Diet History Questionnaire below). Participants performed a brief familiarization session
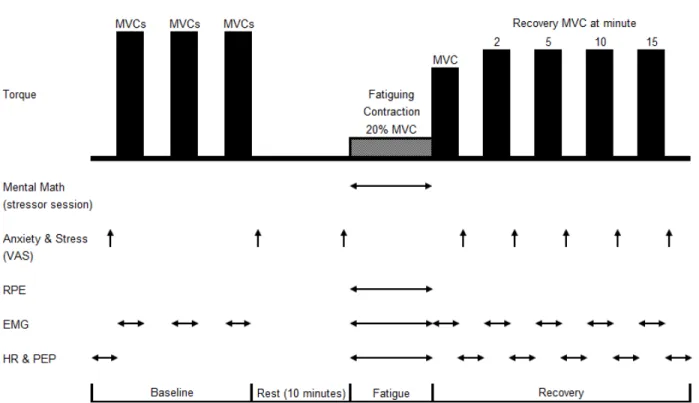
following the body composition assessment during their first visit. The participants practiced the strength assessments and traced their torque production on a computer monitor placed in front of them that displayed their real-time, digitized torque signal at 20% of their maximum strength. The experimental protocol for visit one and visit two (Figure 1) was adapted from previous studies.15,19,20 Participants were provided a standardized meal (Carnation Instant breakfast® ready-to-drink; Fat 6g, Carbohydrate 28 g, Protein 15 g) and adequate rest before testing began. The following procedures of the strength testing protocol involved: (1) baseline measurements of perceptual and physiological variables including performing leg extensor and leg flexor
baseline, after the initial MVCs, prior to the fatiguing task, and between recovery MVCs. The sympathetic response to stress (HR and PEP) were assessed at baseline, during the fatiguing contraction, and in between recovery MVCs. Muscle activation and co-activation as well as median frequency were assessed during all strength assessments.
Procedures Body Composition
Stature and body mass was assessed using a calibrated stadiometer (Perspectives Enterprises, Portage, MI USA) and clinical scale (Tanita Corp, Tokya, Japan). A four-compartment model194 was used to determine %BF utilizing DEXA (Hologic Discovery W, Bedford, MA) and BIS (InBody 770; Biospace Co., Seoul, Korea). Participants wore athletic clothing, free of metal and jewelry, and were centered on the DEXA bed in the supine position with their arms away from their torso and legs separated. Fat mass, lean mass, bone mineral content, and DEXA-derived body volume were estimated with the DEXA scan. Total body water was determined by using a multi-frequency BIS, which has been shown to be valid assessment of total body water,260 per the procedures recommended by the manufacturer. Participants remained in the same position and two single tab electrodes were applied to the right side of the body on the dorsal surface of the hand and foot, respectively, 5 cm apart.
Isometric Strength Testing
full extension) with their lower leg secured to the lever arm using a padded Velcro strap placed approximately 5 cm proximal from the lateral malleolus of the ankle. The axis of rotation of the dynamometer was aligned with the center of the knee joint. Following three submaximal (50-75% perceived effort) contractions as a warm-up, each participant performed three, 3-4 second MVCs for the leg extensors separated by a 2-minute rest period. Additionally, participants completed three MVCs for the leg flexors, to determine co-activation (see signal processing) with similar rest periods. The highest PT value from the leg extensor MVCs was used to calculate the 20% MVC for the fatiguing contraction. The fatiguing contraction was performed following the 10-minute rest period. The participant was asked to maintain the target torque level for as long as possible from a monitor displayed in front of them. The task was terminated once torque fell below 10% of the 20% MVC target torque for two consecutive seconds.140
Immediately after task failure, the participant performed another MVC and then at 2, 5, 10, and 15 minutes after the fatiguing contraction (Figure 1).