AN EXAMINATION OF THE ROLE OF THE CENTRAL OREXIN SYSTEM IN BINGE-LIKE ETHANOL CONSUMPTION
Jeffrey Jon Olney
A dissertation submitted to the faculty at the University of North Carolina at Chapel Hill in partial fulfillment of the requirement for the degree of Doctor of Philosophy in the Department
of Psychology & Neuroscience (Behavioral Neuroscience)
Chapel Hill 2016
ii
iii
ABSTRACT
Jeffrey Jon Olney: An Examination of the Role of the Central Orexin System in Binge-Like Ethanol Consumption
(Under the direction of Todd Thiele)
Although centrally synthesized exclusively within the hypothalamus, orexin (OX) neurons project to various structures throughout the brain to modulate a host of physiological functions, including reward processing and stress responding, each of which contributes to the likelihood that an individual may drink ethanol. More recent evidence has also implicated this system in modulating the neurobiological responses to ethanol. The goal of the present
iv
into the CeA, we found that binge-like ethanol drinking within this region is predominately regulated by the OX1R and that this circuitry is independent of that which modulates responding to natural reinforcers and stress as inhibiting OX1Rs within the CeA did not affect binge-like sucrose consumption nor did it alter anxiety-like behavior. Together, these data indicate that the OX system significantly contributes to binge-like ethanol drinking and reveal that the LHVTA and LHCeA are two key pathways that selectively modulate this behavior. More broadly,
v
ACKNOWLEDGEMENTS
My sincere gratitude to:
The members of my dissertation committee, Todd Thiele, Regina Carelli, Stacey
Daughters, Donald Lysle, and Kathryn Reissner. Thank you for your thoughtful suggestions and guidance throughout the progression of this dissertation.
My advisor, Todd. Thank you so very much for your enduring support throughout my time here at UNC. You, above all others, have helped shape my development as a researcher and for that I am forever grateful. Your enthusiasm and passion for research is without equal. I can only hope to share a fraction of those qualities with my own students in the future.
The past and present members of the Thiele lab: Montse Navarro, Jen Rinker, Gretchen Sprow, Emily Lowery-Gionta, Ben Cox, Alex Marshall, Stacey Robinson, Nathan Burnham, Michel Companion, Maria Luisa Torruella Suarez, John Casachahua, Rhiannon Thomas, Tim Gilliam, Sonia Sabater, and Brooke Hoehn. Working with all of you has been a delight. Most importantly, thank you for making my research experience so enjoyable. Without your company I probably would have lost my sanity long ago.
vi
TABLE OF CONTENTS
LIST OF FIGURES ... ix
LIST OF ABBREVIATIONS ... xi
Chapters I. General Introduction ...1
1.1 Alcohol Use and Abuse ...2
Binge Alcohol Drinking ...3
Psychological Processes that Drive Alcohol Use and Abuse ...4
1.2 Modeling Excessive Ethanol Consumption in the Laboratory ...6
Drinking in the Dark ...7
1.3 The Orexin System ...8
Orexin and Reward ...10
Orexin and Stress ...11
1.4 Ethanol Engages the Orexin System ...12
1.5 The Orexin System Modulates the Neurobiological Responses to Ethanol ...13
1.6 Goals of the Current Dissertation ...15
vii
2.1 Introduction ...16
2.2 Methods...18
2.3 Results ...23
2.4 Discussion ...25
III. Pharmacological Investigation of the Role of Orexin Signaling Within Reward-Related Circuitry in Binge-Like Ethanol Drinking Behavior ...41
3.1 Introduction ...41
3.2 Methods...43
3.3 Results ...49
3.4 Discussion ...53
IV. Pharmacological Investigation of the Role of Orexin Signaling Within Stress-Related Circuitry in Binge-Like Ethanol Drinking Behavior ...63
4.1 Introduction ...63
4.2 Methods...66
4.3 Results ...71
4.4 Discussion ...74
V. General Discussion ...84
5.1 Summary of Experimental Findings ...85
viii
Reward- Versus Stress-Related Orexin Circuitry in Alcohol Drinking ...90
Specific Orexin Circuits are Selective for Ethanol ...93
5.3 The Orexin System is a Promising Target for the Treatment
of Alcohol Use Disorders...97
5.4 Future Directions ...101
VI. References ...106
ix
LIST OF FIGURES
Figure
2.1 The Subregions of the Hypothalamus ...31
2.2 Consumption and Body Mass Between Groups in Experiment 1...32
2.3 Assessment of Orexin-A Positive Neurons in the Hypothalamus ...33
2.4 Consumption and Body Mass Between Groups in Experiment 2 ...35
2.5 Assessment of Orexin-B Positive Neurons in the Hypothalamus ...36
2.6 Consumption and Body Mass Between Groups in Experiment 3 ...38
2.7 Assessment of orexin mRNA expression ...39
3.1 Cannula placements for the VTA ...57
3.2 Inhibition of OX1Rs in the VTA selectively reduces DID ...58
3.3 Inhibition of OX2Rs in the VTA does not alter DID ...60
3.4 Inhibition of OX1Rs in the VTA does not affect anxiety-like behavior ...61
3.5 Inhibition of OX1Rs in the VTA does not affect locomotor activity ...62
4.1 Cannula placements for the CeA ...78
4.2 Inhibition of OX1Rs in the CeA selectively reduces DID ...79
4.3 Inhibition of OX2Rs in the CeA selectively alters DID ...81
4.4 Inhibition of OX1Rs in the CeA does not affect anxiety-like behavior ...82
x
xi
LIST OF ABBREVIATIONS
3V third ventricle
ACTH adrenocorticotropic hormone AP anterior/posterior
AUD alcohol use disorder
BEC blood ethanol concentration BLA basolateral amygdala
C57 C57BL/6J mouse
CeA central nucleus of the amygdala CIE chronic intermittent ethanol CPP conditioned place preference CRF corticotropin-releasing factor D3V dorsal third ventricle
DA dopamine
DAB 3,3′-diamino-benzidine tetrahydrochloride DID drinking in the dark
DMH dorsomedial hypothalamus DMSO dimethyl sulfoxide
DREADD designer receptors exclusively activated by designer drugs DV dorsal/ventral
f fornix
xii
ic internal capsule
IHC immunohistochemistry IR immunoreactivity KOR kappa opioid receptor LC locus coeruleus LH lateral hypothalamus LSD least significant difference ML medial/lateral
mRNA messenger RNA
mt mammillothalamic tract Nac nucleus accumbens
NAcSh shell of the nucleus accumbens opt optic tract
OX orexin
OX1R orexin-1 receptor OX2R orexin-2 receptor OXR orexin receptor
PBS phosphate buffer saline PCR polymerase chain reaction
PFA perifornical area of the hypothalamus PL prelimbic cortex
xiii
RT-PCR real time polymerase chain reaction
SB SB-334867
sox supraoptic decussation
TCS TCS-OX2-29
1 CHAPTER 1
GENERAL INTRODUCTION
Ethanol is produced via the biochemical process of fermentation when yeast metabolizes sugars (e.g. glucose: C6H12O6) into ethanol and carbon dioxide (C2H5OH + CO2). Early humans took advantage of this process to produce alcoholic beverages; in fact, it is believed that the earliest iteration was most likely mead, which is made from fermented honey, and is estimated to have emerged during the Paleolithic Age (8000 BCE; Ray and Ksir, 2002). Since then, alcohol has been a major part of human society and was even found referenced in Hammurabi’s code
(1720 BCE), which included a mandate to set the price and quality of beer (Mandelbaum, 1965). In fact, alcohol, having approximately 7 kcal per gram (The National Agricultural Library, 2015), was a major component of a nutrient-rich diet at the time (Homan, 2004). Additionally, the fermentation process eliminates most harmful bacteria present in the water supply (Vriesekoop et al, 2012) and was considered a source of sanitary hydration (Homan, 2004). For these reasons, early settlers of colonial America referred to alcohol as the “Good Creature of God,” yet they were able to differentiate between drinking for hydration and nutrients versus
drinking for intoxication- considering the latter to be a sinful act (Acker and Tracy, 2004).
2
alcohol consumption dropped precipitously during the years of Prohibition (1919-1933), consumption was not fully eradicated (Nephew et al, 1999)- indicating that a portion of the American population opposed the enactment and chose to continue drinking despite the ban. Over the fourteen years of Prohibition, popular opinion steadily shifted and drinking rates continued to climb until the 21st Amendment overturned Prohibition (Levine, 1984; Nephew et al, 1999). Since then, alcohol has remained a mainstay of American culture. In fact, Americans
spend over $100 billion each year purchasing alcoholic beverages (Levine, 1984), but the health and socioeconomic cost of alcohol use far exceeds the monetary value generated from its sales.
Alcohol Use and Abuse
3
chosen to express the units of annual per-capita alcohol consumption in gallons (Nephew et al, 1999; U.S. Census Bureau, 2012).
Binge Alcohol Drinking
4
Psychological Processes that Drive Alcohol Use and Abuse
Despite the economic cost and adverse consequences to an individual’s welfare, people are nonetheless driven to drink alcohol. Indeed, alcohol consumption is a complex human behavior; as such, the factors that motivate an individual to use or abuse alcohol are varied. It is known that social factors may play a part as peer relationships may drive alcohol drinking (Leung et al, 2014), yet for others chronic alcohol drinking may lead to more automatic, habitual patterns of alcohol drinking behavior devoid of enjoyment (Barker and Taylor, 2014; O’Tousa and Grahame, 2014). Although each of these factors deserves significant research attention in order to provide the most complete understanding of AUDs, the current dissertation will focus on two psychological processes: positive-reinforcement and negative-reinforcement. Positive-reinforcement can be defined as the presentation of a rewarding experience or stimulus that increases the probability the individual will engage in a behavior- in this case alcohol drinking. On the other hand, negative reinforcement is the relief or avoidance of a negative experience or stimulus, which increases the probability of alcohol drinking behavior.
The euphoric, rewarding aspects of alcohol are believed to be largely mediated by the recruitment of the mesolimbic dopamine (DA) system- although it should be noted that other neurotransmitter systems contribute to alcohol use and abuse and have been comprehensively reviewed elsewhere (Sommer and Spanagel, 2013). Indeed, ethanol has long been shown to increase extracellular levels of DA in the nucleus accumbens (NAc; Di Chiara and Imperato, 1988; Weiss et al, 1993). Consistent with this observation, blocking DA signaling has been shown to reduce ethanol seeking behavior (Czachowski et al, 2001; Hodge et al, 1997; Rassnick et al, 1992). Moreover, the positive-reinforcing properties of ethanol have been confirmed using
5
self-stimulation thresholds (Lewis and June, 1990) and induces conditioned place preference (CPP) in rodents (Bozarth, 1990). What is more, human imaging studies have revealed that alcohol and alcohol-related cues activate a number of regions within the reward system (Ingvar et al, 1998; Wrase et al, 2002) that leads to the release of DA within the ventral striatum
(Boileau et al, 2003; Yoder et al, 2007). Together, these data indicate that ethanol possesses positive-reinforcing properties through its activation of the mesolimbic dopaminergic reward system.
It is generally believed that the initial stages of ethanol use are driven by the positive-reinforcing properties of the drug whereas negative-reinforcement becomes the more prominent motivator of ethanol abuse as neurobiological systems adapt to repeated ethanol challenges (Koob, 2003, 2013). However, negative reinforcement may also contribute to the early stages of ethanol use as well. In fact, numerous reports have described relatively high comorbidity rates of AUDs with stress/anxiety or major depression disorders (Arolt and Driessen, 1996; Kushner et al, 1990; Weissman et al, 1980). Although these high rates of comorbidity cannot indicate
6
the rewarding effects of ethanol, these data indicate that individuals may attempt to self-medicate with ethanol to achieve some semblance of relief from a negative affective state. Consistent with this hypothesis, individuals who drink for similar reasons (i.e. negative-reinforcement) have been found to be at a greater risk of developing AUDs (Ray et al, 2009).
Modeling Excessive Ethanol Consumption in the Laboratory
As outlined above, excessive alcohol consumption is a complex human disorder that affects a large proportion of the population. However, much of the research conducted in the laboratory uses animal models to investigate alcohol use, which is problematic as any one preclinical model is insufficient to address a multifaceted neuropsychological disorder such as AUDs. For example, two-bottle choice tests are well-suited to examine ethanol preference (Spanagel, 2000), which can then be used to identify genetic markers that may increase the risk of alcohol use (Belknap et al, 1997; Phillips et al, 1994). However, this procedure rarely yields physiologically relevant BECs, even in high-preferring strains of mice (Dole and Gentry, 1984), making it an unfit model to examine excessive ethanol consumption. Alternatively, procedures that induce reinstatement of ethanol seeking behavior are an ideal model for investigating the neurobiology of ethanol relapse (Spanagel and Hölter, 2000), but cannot fully address the defining characteristics of binge alcohol drinking (i.e. achieving a BEC of at least 80 mg/dl in a short period of time). Moreover, other techniques that model excessive ethanol consumption rely on experimenter delivered ethanol via injection, gavage, or vapor inhalation (Gilpin et al, 2008; Majchrowicz, 1975; Roberts et al, 2000) or may even require fluid deprivation (Cozzoli et al, 2009), the incorporation of ethanol in the animal’s diet (Roy and Pandey, 2002), or weaning
7
experimental interpretation. Importantly, the neuroadaptive consequences of drugs of abuse can vary depending how the drug was delivered (Jacobs et al, 2003). For these reasons, it is necessary that multiple models of AUDs be used to better capture the complexity of the human condition (Crabbe et al, 2011; Hines et al, 2005).
Drinking in the Dark
The “drinking in the dark” (DID) paradigm is a commonly used procedure to investigate
binge-like ethanol intake in a preclinical model. This paradigm takes advantage of the nocturnal nature of rodents to promote high levels of consumption during the dark cycle that generates physiologically relevant blood ethanol concentrations (BECs) of 80 mg/dl or greater (Rhodes et al, 2005, 2007). Though other mouse lines can be used in this model, C57BL/6J, which are
8
the animals. Nonetheless, the DID procedure is a powerful tool that can be used to model aspects of human binge drinking.
The DID model also has the advantage of being a relatively simple procedure. On days 1-3 of the standard DID model, home-cage water bottles are removed three hours into the dark cycle and the animals are given access to test bottles containing ethanol (20% v/v) solution for two hours. Binge-like consumption is assessed on the fourth day, the test day, in which the procedures are similar to the previous days except that access to ethanol is often extended to four hours. After removing the ethanol bottles at the end of the four hour period on the test day, tail blood samples are collected from each animal in order to assess BECs.
The Orexin System
In 1998, two independent research groups simultaneously discovered the existence of a novel peptide. One group noted that this new peptide possessed structural similarities to the gut-peptide, secretin, but displayed an expression pattern limited to the hypothalamus (de Lecea et al, 1998); thus, these researchers deemed this new peptide hypocretin (hypothalamus + secretin =
hypocretin). Alternatively, Sakurai and colleagues (1998) observed that the peptide was located in the hypothalamus, a brain region long-known for its critical involvement in feeding behavior (Brooks et al, 1946; Hetherington and Ranson, 1940). After demonstrating that this peptide produced a robust feeding response these researchers named this peptide orexin (OX), which is derived from the Greek orexis meaning appetite.
9
orexin-A has been found to have a greater affinity for OX1R with orexin-B exerting minimal actions on OX1R (Sakurai et al, 1998). Although neurons that synthesize OX peptide are restricted to the dorsal regions of the hypothalamus, orexinergic fibers project extensively throughout the brain and participate in a myriad of neurobiological functions. In fact, the origin and target location of these orexinergic connections can provide insight into the function of the OX system. For example, Sakurai and colleagues (1998) were able to shrewdly deduce its role in feeding behavior based solely on its limited expression within the hypothalamus. In addition to feeding behavior, the hypothalamus is also involved in maintaining arousal (Vanni-Mercier et al, 1984). It was suggested that the OX system also plays a role in sleep and arousal when it was
observed that regions critically involved in this behavior- such as the tuberomammillary nucleus, raphe nuclei, and locus coeruleus- were densely innervated by OX neurons (Peyron et al, 1998). Shortly thereafter, it was demonstrated that proper OX functioning was necessary to maintain healthy waking states (Chemelli et al, 1999; Lin et al, 1999). Additionally, Peyron and colleagues (1998) also observed that OX neurons project the ventral tegmental area (VTA), the nucleus accumbens (NAc), amygdala, and bed nucleus of the stria terminals, which are regions known to be involved in reward and/or stress processing. Consistent with these projection patterns, it was later demonstrated that OX also modulates the positive reinforcing effects of rewards (Harris et al, 2005) as well as stress responding (Kuru et al, 2000).
10
Aston-Jones, 2006). Moreover, this dichotomy generalizes to the receptors as well; OX1R is more associated with reward processing (Smith et al, 2009) and OX2R with wakefulness and arousal (Akanmu and Honda, 2005; Willie et al, 2003). However, more recent findings indicate that such a clear segregation of OX function based simply on hypothalamic origin may not be as apparent as originally believed (González et al, 2012).
Orexin and Reward
11 Orexin and Stress
Early researchers investigating the neurobiological mechanisms of the stress-response system recognized the relationship between adrenocorticotrophic hormone (ACTH) release from the pituitary gland and the subsequent release of corticosterone in response to a stressor (Sayers and Sayers, 1949); however, the role of the hypothalamus in this stress-response system was relatively poorly understood for several years to follow (Katsuki et al, 1955). Since that time, the hypothalamus has been firmly established as a critical modulator of stress and anxiety- a fact perhaps best illustrated by its inclusion in the name of the predominate stress system, the hypothalamic-pituitary-adrenal (HPA) axis. In accordance with its restricted expression within the hypothalamus, the OX system has been found to regulate stress responding.
Intracerebroventricular (i.c.v.) infusion of orexin-A has been shown to activate the paraventricular nucleus of the hypothalamus (PVN; Kuru et al, 2000)- the subregion of the hypothalamus that expresses corticotropin releasing factor (CRF) that initiates a stress response from the HPA axis. Not surprisingly, this group went on to demonstrate that similar i.c.v. infusion of OX leads to an increase in circulating ACTH and corticosterone levels. Moreover, hypothalamic OX neurons are activated in response to an environmental stressor (Sakamoto et al, 2004; Winsky-Sommerer et al, 2004). Indeed, OX neurons have been shown to possess
12
connections with the CRF system- although the OX system also does so through other neurobiological means beyond just the CRF system (see Johnson et al, 2012 for review).
Ethanol Engages the Orexin System
13
Given the need to approach AUDs from multiple different perspectives (i.e. models), further examination of how this peptide system responds to binge-like ethanol drinking is necessary.
The Orexin System Modulates the Neurobiological Responses to Ethanol
Findings outlined in the previous section suggest that ethanol drinking is associated with elevated activity in the OX system; thus, it stands to reason that pharmacological manipulations of OX signaling would impact ethanol intake. Indeed, Lawrence and colleagues (2006) confirmed such an effect when they demonstrated that a systemic injection of the selective orexin-1 receptor antagonist, SB-334867 (SB), reduced operant self-administration of ethanol. Similarly, SB was found to reduce ethanol consumption and preference in high ethanol preferring rats (Moorman and Aston-Jones, 2009). Further investigations suggest that modulation of OX signaling via SB may be specific to ethanol as Jupp and colleagues (2011) found that SB significantly attenuated the motivational effects of ethanol but not sucrose. Although these data suggest an essential role for OX1R signaling in ethanol drinking, recent evidence suggests the OX2R is also capable of modulating responses to ethanol (Anderson et al, 2014; Barson et al, 2014; Shoblock et al, 2011). Moreover, more comprehensive investigations of the role of OX in ethanol drinking have revealed that signaling within reward-related structures is responsible for modulating this behavior. Indeed, direct infusions of orexin-A in the LH or PVN increased ethanol drinking (Schneider et al, 2007) while a non-selective OXR antagonist into the VTA significantly decreased ethanol self-administration (Srinivasan et al, 2012). As a whole, these findings indicate ethanol drinking directly parallels OX signaling in the reward pathway.
14
systemic OXR signaling reduces breakpoints for ethanol responding in a progressive ratio schedule of reinforcement (Anderson et al, 2014; Jupp et al, 2011a). Additionally, SB blocks yohimbine-induced renewal of ethanol seeking behavior (Richards et al, 2008)- a procedure that engages stress-related systems (Funk et al, 2006; Vythilingam et al, 2000) and is thought to model stress-induced relapse of drug seeking behavior (Feltenstein and See, 2006; Lee et al, 2004). Beyond preclinical studies, OX levels have been found to be directly correlated with severity of alcohol withdrawal symptoms in humans (Bayerlein et al, 2011; von der Goltz et al, 2011). Together, these data support the notion that OX may regulate ethanol responding through both positive- and negative-reinforcement.
15 Goals of the Current Dissertation
16 CHAPTER 2
THE EFFECTS OF BINGE-LIKE ETHANOL CONSUMPTION ON THE OREXIN SYSTEM
Introduction
The two peptides of the orexin (OX) system, orexin-A and orexin-B, are 33- and 28-amino acid sequences, respectively, that are cleaved from the precursor, prepro-orexin (de Lecea et al, 1998; Sakurai et al, 1998). Neurons that produce these peptides are restricted to the
hypothalamus; however, these neurons send widespread projections to a number of regions throughout the brain. OX peptides from these fibers act on two receptors, the orexin-1 (OX1R) and orexin-2 receptor (OX2R), to influence a wide array of neurobiological functions including feeding (Sakurai et al, 1998), sleep (Chemelli et al, 1999), stress (Kuru et al, 2000), and reward (Harris et al, 2005). Interestingly, although there is a high degree of overlap in expression between the OXRs, the two subtypes display differential expression in some brain areas. For example, it has been reported that both receptors are moderately expressed in the ventral tegmental area (VTA) yet the OX1R is more densely expressed in the extended amygdala as well as the prelimbic and infralimbic cortices while the OX2R is more robustly expressed throughout much of the hypothalamus and the lateral habenula in the rat brain (Marcus et al, 2001).
17
homeostatic regulators with the OX1R controlling insulin sensitivity (Shiuchi et al, 2009) while the OX2R controls leptin sensitivity (Funato et al, 2009). Perhaps the most notable distinction is regarding the involvement in reward and arousal, which are modulated by the OX1R and OX2R, respectively (Dugovic et al, 2009; Gozzi et al, 2011; Harris et al, 2005; Lin et al, 1999; Malherbe et al, 2009; Smith et al, 2009). Considering that neurons originating from the lateral hypothalamus (LH) have been reported to be more involved in reward while those of the dorsomedial and perifornical regions (DMH and PFA, respectively) predominately contribute to arousal and stress (Harris and Aston-Jones, 2006), these functional differences may arise from differences in anatomical sources of orexinergic fibers as well.
Moreover, both OXRs have been implicated in ethanol drinking (Anderson et al, 2014; Srinivasan et al, 2012), although disparities still exist in how each subtype contributes to neurobiological responses to ethanol. For example, Barson and colleagues (2014) demonstrated that the OX2R, but not OX1R, within the anterior paraventricular nucleus of the thalamus (aPVT) modulates ethanol consumption. Similarly, Shoblock and colleagues (2011) showed that treatment with an OX2R antagonist blocked ethanol-induced conditioned place preference- an effect that was not observed following OX1R inhibition. Together, these data and others indicate that the two OXR subtypes may be differentially involved in the neurobiological responses to ethanol.
18
suggests different aspects of the OX system undergo changes following experience with ethanol. Indeed, the aPVT shows elevated OX2R, but not OX1R, mRNA expression after ethanol exposure (Barson et al, 2015). Furthermore, this same study also reported no such changes in the posterior PVT, which suggests that changes in the OX system are not only specific to certain aspects of the OX system (e.g. receptor subtype) but also to particular regions of the brain.
As it stands, the current literature suggests that ethanol exposure leads to plastic changes in the OX system. However, the perturbations of the OX system following binge-like ethanol drinking behavior remain relatively unknown. Therefore, the purpose of the present study was to characterize the changes in the OX system following binge-like ethanol drinking using the “drinking in the dark” (DID) paradigm. These changes were assessed using real-time
polymerase chain reaction (RT-PCR) to measure mRNA expression of prepro-orexin and each OXR subtype in the hypothalamus as well as the ventral tegmental area (VTA) and amygdala- two regions that receive dense orexinergic projections and are involved in ethanol drinking (Engel and Jerlhag, 2014; Gilpin et al, 2015; Peyron et al, 1998). To further characterize the effect of binge-like ethanol drinking on the OX system, levels of orexin-A and orexin-B were directly assessed using immunohistochemistry (IHC) within the LH, PFA, and DMH.
Methods
Animals
19
libitum access to food and water except when specified below. All procedures used were in
accordance with the National Institute of Health guidelines and were approved by the University of North Carolina Institutional Animal Care and Use Committee.
Drinking in the Dark
Three groups of fifty C57 mice experienced one or three cycles of “drinking-in-the-dark”
(DID) in order to assess changes in the OX system following binge-like drinking behavior using immunohistochemistry (IHC) and RT-PCR. One cohort each was used for the orexin-A IHC, orexin-B IHC, and RT-PCR experiments. The DID procedure is a commonly used animal model of binge-like ethanol drinking that promotes high levels of consumption and generates physiologically relevant blood ethanol concentrations (BECs) of 80 mg/dl or greater (Rhodes et al, 2005, 2007). On days 1-3, standard water bottles were removed three hours into the dark
cycle and the animals were given access to test bottles containing water, ethanol (20% v/v), or sucrose (3% w/v) solutions for two hours. Binge-like consumption was assessed on the fourth day when access to the test bottles was extended to four hours. Each four day testing period constituted a binge cycle, and there were 3 days with no ethanol access between binge cycles. The start dates of the binging cycles were staggered such that all groups finished testing on the same day and at the approximate same age. Moreover, all animals were sacrificed and perfused immediately following the final binge session in order to assess changes in the OX system while ethanol was still present in the brain.
Immunohistochemical Analysis
20
blood samples from animals in the one and three cycle ethanol groups were analyzed. Animals were then sacrificed and transcardially perfused with 0.1 mM phosphate-buffered saline (PBS; pH7.4) followed by 4% paraformaldehyde in phosphate buffer. Brains were then collected and post-fixed in paraformaldehyde for 48 hr at 4°C, at which point they were transferred to PBS. The brains were cut using a vibratome (Leica Microsystems, Buffalo Grove, IL) into 40 μm sections that were stored in cryopreserve until the IHC assay. Sections were then transferred to PBS for 24 hr before processing with orexin-A or orexin-B antibodies. After rinsing in fresh PBS 4 times (10 minutes each), tissue sections were blocked in 10% goat serum and 0.1% triton-X-100 in PBS for 1 hour. Sections were then transferred to fresh PBS containing primary antibody for 72 hr at 5°C. Protein expression was detected using primary antibody against orexin-A (1:5000, Santa Cruz Biotechnology, Dallas, TX) or orexin-B (1:5000, Santa Cruz Biotechnology, Dallas, TX). After the 72 hr of incubation with antibody, the sections were rinsed four times and then processed with Vectastain Elite kits (Vector Labs, Burlingame, CA). The sections processed for orexin-A and -B were visualized by reacting the sections with a 3,3′-diamino-benzidine tetrahydrochloride (DAB; Polysciences, Inc., Warrington, PA) reaction solution containing 0.05% DAB, 0.005% cobalt, 0.007% nickel ammonium sulfate, and 0.006% hydrogen peroxide.
21
The section for each animal was selected as the section with the most robust OX expression observed in the hypothalamus, which was approximately 1.06 to 1.34 mm posterior to bregma. The entire 40 µm section was examined. We adopted the boundaries set forth by Mahler and Aston-Jones (2012) for the current experiment (Fig. 2.1). Specifically, cells were qualified as LH OX cells if they were in the lateral portions of the hypothalamus between the internal capsule and the lateral edge of the fornix. Neurons found within the lateral edge of the fornix to the lateral edge of the mammillothalamic tract were considered cells of the PFA. Finally, neurons in the most medial portions of the hypothalamus between the lateral edge of the mammillothalamic tract and the third ventricle were recorded as DMH cells. However, upon initial quantification of the levels of orexin-A positive cells in our animals, it became clear that the DMH exhibited minimal orexin-A IR in our samples (grand mean: 3.327, SEM: 0.352); therefore, this subregion was removed from further analysis of both orexin-A and orexin-B peptides.
Real Time Polymerase Chain Rection
22
the PCR primers and fluorogenic probes used in the analysis were as follows: prepro-orexin forward: 5'-AGG CCT CCA GGG ACG GCT-3', reverse: 5'-CAT GGT CAG GAT GCC AGC T-3', probe: 5'-FAG CGC CTC CTT CAG GCC AAC GGT A Q-3'; OX1R forward: 5'-CTT CTC CCA CTG GCT AGT GT-3', reverse: 5'-TGC TCC CGG AAT TTG CCA CT-3', probe: 5'-FTG CCG CCA ACC CTA TCA TCT ACA AC Q-3'; OX2R forward: 5'-CTC ACC AGC ATA AGC ACA CT-3', reverse: 5'-TGG TAC TCC CTG CTG TAG AT-3', probe: 5'-FTG AAG CGG TCC TGC CCC GTT GGC Q-3'; β-actin forward: 5'-CTG CCT GAC GGC CAG GTC-3', reverse: 5'-CAA GAA GGA AGG CTG GAA AAG A-3', probe: 5'-FCA CTA TTG GCA ACG AGC GGT TCC GQ-3'. Measurements were normalized to the water control group and presented as percent change from controls.
Data Analysis
23
cycles (one or three). Finally, separate univariate ANOVAs were used to analyze changes in body mass (g) as a function of group. Tukey’s LSD post-hoc tests and Bonferroni corrections
were used when applicable. Results
Animals’ responses to the test solutions were comparable regardless of DID history as
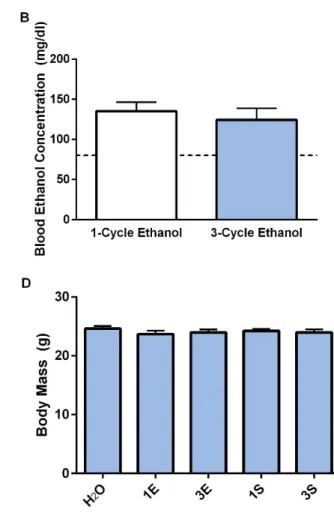
ethanol and sucrose drinking on the final day of testing did not differ between animals that experienced one- or three-cycles of DID (Figure 2.2A,C; t(18) = 0.1316, p = 0.897; t(18) = 0.4746, p = 0.641; respectively). Additionally, both groups of ethanol drinkers achieved similar BECs
regardless of DID history (Figure 2.2B; t(18) = 0.603, p = 0.5540). Moreover, no differences across any of the groups were observed in body mass as measured at the end of testing (Figure 2.2D; F(4, 45) = 0.541, p = 0.706).
Our analysis revealed that binge-like consumption of ethanol or sucrose solutions significantly altered the number of orexin-A positive neurons within the LH (Figure 2.3A-F; F(4,48) = 5.863, p = 0.001). Further probing of this effect revealed that relative to the water group (Figure 2.3B) all test groups (i.e. one-cycle ethanol (Figure 2.3C), three-cycle ethanol (Figure 2.3D), one-cycle sucrose (Figure 2.3E), and three-cycle sucrose (Figure 2.3F)) displayed significantly reduced OX levels (Fig. 1A; p’s < 0.010). Similarly, binge-like consumption of ethanol or sucrose also significantly altered OX levels within the PFA (F(4,48) = 3.702, p = 0.011). Unlike the LH, however, Tukey’s LSD tests indicated that only the three-cycle ethanol group showed significant reductions in OX expression in the PFA relative to the water group (p = 0.006).
24
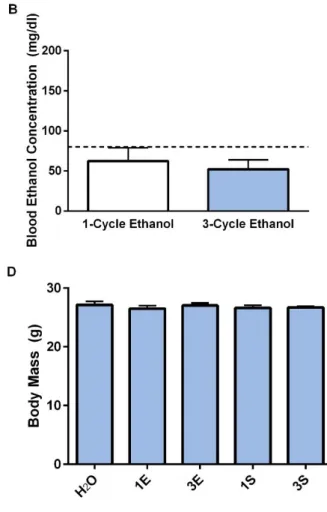
= 0.622, p = 0.542) consumption as well as BECs (Figure 2.4B;t(15) = 0.480, p = 0.638) regardless of the number of DID cycles. Consistent with the previous cohort, no differences were observed in body mass as a function of group (Figure 2.4D; F(4, 47) = 0.338, p = 0.851).
As with the last analysis, we observed that binge-like consumption significantly impacted levels of orexin-B in the LH and PFA (Figure 2.5A-F; F(4,39) = 4.410, p = 0.005; F(4,39) = 4.891, p = 0.003; respectively). Further probing of the effect within the LH revealed that the one-cycle
ethanol group (Figure 2.4C) displayed significantly reduced orexin-B levels relative to water drinking controls (Figure 2.4B; p = 0.005) as well as relative to the three-cycle ethanol group (Figure 2.4D; p = 0.005). Within the PFA, post-hoc analyses revealed that both the one-cycle ethanol and one-cycle sucrose groups exhibited orexin-B levels that were significantly lower than the water drinking controls (p = 0.002 and p = 0.001, respectively).
The group of animals used in the PCR study displayed statistically similar levels of binge-like ethanol (Figure 2.6A; t(18) = -0.935, p = 0.362) and sucrose (Figure 2.6C; t(18) = -0.795, p = 0.437) consumption as well as BECs (Figure 2.6B; t(18) = 1.468, p = 0.159) regardless of the number of DID cycles. The body mass of the animals did not vary as a function of group (Figure 2.6D; F(4, 45) = 0.828, p = 0.515).
We detected a significant difference in prepro-orexin expression within the hypothalamus as a function of group (Figure 2.7A; F(4, 45) = 5.558, p = 0.001). Here, the three-cycle sucrose group was found to have significantly great precursor mRNA relative to all of the other groups except the one-cycle ethanol group (p’s ≤ 0.002). We did not observe any significant changes in
25
driven by the fact that the three-cycle ethanol group displayed elevated OX1R mRNA relative to the water group (p < 0.001) and one-cycle sucrose group (p = 0.003). Levels of OX2R mRNA were below detectable levels in the amygdala and VTA; thus, we were unable to analyze those results. However, there was sufficient OX2R expression within the hypothalamus, but no differences were observed in this region (Figure 2.7C; F(4, 43) = 0.727, p = 0.578).
Discussion
It has previously been reported that experience with ethanol engages the OX system and causes changes to peptide and/or receptor levels (Barson et al, 2015; Lawrence et al, 2006; Morganstern et al, 2010). Findings from the current studies expand upon our current understanding by demonstrating that binge-like ethanol drinking similarly alters the OX system. Moreover, further examination indicates that these changes are not due to differences in ethanol consumption, BECs, or body mass but rather are due to exposure to ethanol.
Our first experiment revealed that the levels of hypothalamic orexin-A are reduced following repeated cycles of binge-like ethanol drinking. Moreover, this effect was not specific for ethanol as a similar pattern of results was observed among animals that experienced binge-like sucrose consumption. However, these effects were specific to the LH, a subregion hypothesized to be mainly involved in reward processing (Harris et al, 2005), as we observed minimal changes in the PFA, a subregion believed to be more involved in stress and arousal (Harris and Aston-Jones, 2006). Although we observed an increase in orexin-A IR in the PFA among animals that experience three cycles of binge-like ethanol consumption, this effect may be due to ethanol’s influence on normal sleep patterns (Ebrahim et al, 2013). Indeed, ethanol has
26
Our orexin-A IR data appears to provide support for the dichotomy of OX function between the LH and PFA in processing reward and arousal/stress, respectively (Harris and Aston-Jones, 2006). Our findings of the changes in orexin-B, on the other hand, do not support this theory. Similar to orexin-A, we observed that levels of orexin-B decline following binge-like ethanol and sucrose. Unbinge-like the other peptide, however, this reduction in orexin-B was observed in both the LH and PFA- indicating an absence of functional dichotomy. In fact, there are several other examples in the literature that do not support the idea of a clear separation of OX function between the LH and PFA. Most notably, González and colleagues (2012) infused retrograde tracers directly into the locus coeruleus (LC) and VTA- two regions that receive dense orexinergic input that are critically involved in sleep and reward, respectively- and found that OX neurons within the LH and PFA each projected substantially to both the LC and VTA. In fact, the authors even reported that OX neurons within the LH were more likely to project to the LC than the VTA. As a whole, these data indicate that the functional roles of OX cannot be so clearly segregated based on hypothalamic origin.
27
mRNA (Figure 2.2, 2.4, & 2.6). This difference in consumption likely stems from the different food diet that these animals were given during binge testing, which has been found to drastically affect ethanol consumption (Marshall et al, 2015). Despite the lower levels of consumption in these animals, we nonetheless observed group differences in orexin-B IR.
Although we observed a reduction in the number of OX peptide IR neurons following binge-like ethanol drinking, we did not observe a similar effect when we measured mRNA expression. Specifically, expression of the precursor, prepro-orexin, did not change following one or three cycles of binge-like ethanol consumption. However, mRNA expression significantly rose following three-, but not one-, cycles of sucrose DID. Similarly, we found that three-, but not one-, cycles of sucrose DID led to elevated OX1R mRNA expression within the amygdala. However, no significant change in OX1R mRNA was observed in the hypothalamus, VTA, or amygdala following binge-like ethanol drinking. Moreover, no alterations in OX2R mRNA were detected in the hypothalamus of any group. Together, these data indicate that production of OX peptides and receptors remain largely unaltered following binge-like ethanol consumption and suggest that binge-like ethanol drinking does not induce plastic adaptations in the OX system.
Previous studies have reported that ethanol consumption upregulates of the OX system by increasing prepro-orexin mRNA expression in the hypothalamus (Barson et al, 2015; Lawrence et al, 2006). Similarly, pharmacological studies indicate that ethanol consumption parallels OX
28
an increase in OX signaling. In this case, OX would be released from its presynaptic stores in response to consumption of salient reinforcers. As our IHC analysis measured the amount of peptide immediately following the last round of DID, a reduction in orexin-A and -B IR may be a sign of depleted stores of OX peptide due to an increase in signaling. Findings from our PCR analysis appear to support this hypothesis. Specifically, a reduction in prepro-orexin mRNA would have indicated a downregulation in the OX system following binge-like ethanol drinking. In this case, DID would have led to decreases in both OX peptide IR and precursor mRNA. However, we did not observe this to be the case. Instead, we found that expression of prepro-orexin mRNA remained unchanged following binge-like ethanol drinking. Thus, rather than a downregulated OX system, the reduced OX peptide IR is most likely a consequence of diminished OX levels due to increased release.
29
immediately after the final binge session whereas others waited 30 min (Barson et al, 2015) or two hours (Morganstern et al, 2010) afterwards to assess OX mRNA. In the case of prepro-orexin expression we may have collected tissue before the system responded to the depleted levels of OX peptide and mobilized prepro-orexin mRNA to replenish those levels. Future studies may benefit from waiting longer after the final binge session to assess OX mRNA levels.
Furthermore, we did not expect expression of OX2R mRNA to be so low as to be largely undetectable in our PCR analysis. That being said, the pattern of regional OX2R expression- particularly the low expression of this receptor subtype- is consistent with the existing literature (Marcus et al, 2001). Other investigators have opted to pool tissue samples in order to augment the signal (Morganstern et al, 2010) and it remains to be seen whether a similar strategy would have resolved this issue in our analysis. In this case, combining tissue samples from mice with comparable drinking levels may have sufficiently improved the OX2R mRNA signal to allow for adequate statistical analysis and interpretation of subsequent results. However, we chose not to pool the samples in the current study as we only had 10 animals per group. Pooling the tissue may have improved the signal, but halving our sample size would have drastically reduced our statistical power- impeding our ability to detect statistical differences in OX expression.
30
hypothalamic prepro-orexin mRNA expression relative to a standard diet (Olszewski et al, 2009). Together with the data from the current study, this suggests that a hypothalamic amygdalar OX circuit is recruited following repeated access to highly palatable reinforcers, such as sucrose.
31
Figure 2.1: The subregions of the hypothalamus investigated in the IHC experiments. 3V, third
32
Figure 2.2: In the orexin-A IHC experiment, mice with access to ethanol bottles drank
33
Figure 2.3: Assessment of hypothalamic orexin-A immunoreactivity (A) revealed that, relative
35
Figure 2.4: In the orexin-B IHC experiment, mice with access to ethanol bottles drank
36
Figure 2.5: Assessment of hypothalamic orexin-B immunoreactivity (A) revealed that, relative
38
Figure 2.6: In the PCR experiment, mice with access to ethanol bottles drank comparable levels
39
Figure 2.7: Expression of prepro-orexin within the hypothalamus (A); OX1R within the
41 CHAPTER 3
PHARMACOLOGICAL INVESTIGATION OF THE ROLE OF OREXIN SIGNALING WITHIN REWARD-RELATED CIRCUITRY IN BINGE-LIKE ETHANOL DRINKING
BEHAVIOR
Introduction
The OX system is comprised of two peptides, orexin-A and -B, that act on two GPCRs, OX1R and OX2R. Orexin-A has been found to bind with a relatively high affinity for both receptors while orexin-B mainly interacts with the OX2R as it has a relatively low affinity for the OX1R (Sakurai et al, 1998). Although neurons that produce the OX peptides are found exclusively within the hypothalamus, they project to various regions throughout the brain to regulate a host of neurobiological functions (Ch’ng and Lawrence, 2015; Peyron et al, 1998; Yoshida et al, 2005). Indeed, relatively recent evidence has emerged that has implicated the OX system in modulating the responses to drugs of abuse, including ethanol (see Mahler et al, 2012 for review).
42
ethanol consumption while OXR agonists enhance drinking behavior (Jupp et al, 2011a; Lawrence et al, 2006; Moorman and Aston-Jones, 2009; Schneider et al, 2007).
Despite this growing body of literature implicating the OX system in ethanol consumption, relatively less research has been dedicated to elucidating its role in binge-like ethanol drinking behavior. Indeed, we and others have recently reported that peripheral administration of either an OX1R or OX2R antagonist reduces binge-like ethanol drinking using the “drinking in the dark” (DID) model (Anderson et al, 2014; Olney et al, 2015). Notably,
these investigations also found that OXR antagonists affect palatable reinforcers regardless of caloric content by demonstrating that these compounds also reduced binge-like sucrose (Anderson et al, 2014) and saccharin consumption (Alcaraz-Iborra et al, 2014; Olney et al, 2015). These observations indicate that peripherally administered OXR antagonists do not selectively modulate ethanol consumption per se, but rather regulates the underlying responses to general, salient reinforcers, which includes ethanol.
43
What is more, the VTA is densely innervated by hypothalamic OX neurons (Ch’ng and Lawrence, 2015; Peyron et al, 1998; Yoshida et al, 2005) and expresses both OXR subtypes (Marcus et al, 2001; Narita, 2006). OX peptides acting on either OXR subtype within the VTA results in a robust depolarization of VTA neurons (Korotkova et al, 2003) and is accompanied by a marked increase in DA release as well (España et al, 2010; Narita, 2006; Vittoz et al, 2008). Moreover, both orexin-A and -B have even been shown to cause plastic changes in dopaminergic neurons within the VTA that facilitates activity in this region (Borgland et al, 2006, 2008). Considering these findings, it is not surprising that infusions of a dual OXR antagonist directly into the VTA has been demonstrated to disrupt operant responding to ethanol in rats (Srinivasan et al, 2012). As a whole, these observations implicate OX neurons- originating from the
hypothalamus- that project to the VTA as the prime circuit that modulates binge-like ethanol drinking.
44 Methods
Animals
Male C57BL/6J mice (C57; Jackson Laboratories, Bar Harbor, ME), aged 6-7 weeks and weighing 20-25 g upon arrival, were used in each of the following studies. Mice were individually housed in plastic cages located in a vivarium with an ambient temperature of approximately 22ºC and a reverse light/dark cycle with lights off at 8:30 am. All animals had ad libitum access to food and water except when specified below. All procedures used were in
accordance with the National Institute of Health guidelines and were approved by the University of North Carolina Institutional Animal Care and Use Committee.
Cannulation Surgery and Infusion Procedures
Prior to testing, mice were bilaterally cannulated targeting the VTA (AP: -3.08 mm, ML: ±0.50 mm, DV: -4.40 mm). As a regional control, a separate group of mice was cannulated slightly dorsal to the VTA (AP: -3.08 mm, ML: ±0.50 mm, DV: -3.40 mm). Mice were given one week to recover from surgery before testing. Cannula placement for each animal was verified histologically and animals in which the cannulas were not in the target area were excluded from the statistical analysis (see Figure 3.1).
45
al, 2003). Both compounds were dissolved in dimethyl sulfoxide (DMSO) to reach the desired
concentration. DMSO was chosen as the solvent for both drugs in order to better equate the actions of SB and TCS. Importantly, a dose higher than 7.5 µg of TCS could not be achieved due to restrictions in the drug’s solubility in DMSO. All infusions were administered in a volume of 0.3 µl per side and were delivered over the course of one minute using an automated syringe pump (Harvard Apparatus, Holliston, MA). Injectors were left in the cannulae for an extra minute before removal to ensure adequate diffusion of the compound and to prevent reflux up the cannula tract. Drug infusions for all studies were performed 30 min prior to the start of the behavioral test.
Drinking in the Dark
A cohort of 17 C57BL/6J (C57) mice was used to assess the effect of pharmacological inhibition of VTA OX1Rs on binge-like ethanol and sucrose consumption. A separate group of 22 mice was used to similarly assess inhibition of VTA OX2Rs. Additionally, another cohort of 12 mice was used to verify the specificity of the effect by infusing the OX1R antagonist into a control region 1.0 mm dorsal to the VTA. The DID procedure is a commonly used animal model of binge-like ethanol drinking that promotes high levels of consumption and generates physiologically relevant blood ethanol concentrations (BECs) of 80 mg/dl or greater (Rhodes et al, 2005, 2007). On days 1-3, standard water bottles were removed three hours into the dark
46
ethanol concentration (BEC) using an alcohol analyzer (Analox Instruments, London, UK). A two hour test period was chosen as we have previously had success capturing the transient effects of the drug using this shortened procedure (Olney et al, 2015). In order to increase power during statistical analysis, a Latin-square design was used such that each animal received all doses of the drug over repeated trials. Mice were given three days of rest between subsequent 4-day DID sessions in order to avoid carryover effects of the drug.
Elevated Zero Maze
A separate cohort of 12 C57s was used to assess the effect of pharmacological inhibition of VTA OX1Rs on anxiety-like behavior using a five minute test on the elevated zero maze (Med Associates, Inc., St. Albans, VT). The elevated zero maze is a common tool used among investigators in order to assess anxiety-like behavior. Here, anxiolytic drugs increase the amount of time spent in the open area while anxiogenic drugs increase the amount of time spend in the closed areas (Shepherd et al, 1994). One hour before testing, animals were brought into a dark room that housed the elevated zero maze. Approximately three hours into the dark cycle, testing on the elevated zero maze began by placing the animal in the open area of the maze. Each session was recorded using a camcorder placed above the apparatus and was scored by an investigator blind to the animal’s group assignment who recorded the time (s) spent in the open
area as well as the number of entries into the open and closed area. The animal was considered to have entered the open area when all four paws left the closed area. Open area time was considered terminated once all of the animal’s paws entered the closed area. We also assessed the number of instances and time (s) spent “exploring” the open area from the closed area.
47
entered the open area or retreated back into the closed area. Animals were returned to their homecage immediately after the conclusion of the test session. Unlike DID testing, a Latin-square design was not used in order to avoid previous experience with the apparatus confounding the animals’ behavior. Treatment groups were equated based on body weight and each animal
received a single, bilateral infusion of either 0.0 or 6.0 µg of SB.
Open-Field Locomotor Activity
The same group of animals from the previous elevated zero maze test was used to assess the effect of pharmacological inhibition of VTA OX1Rs on locomotor activity; however, one animal’s cannula became clogged in the interim time between tests and was unable to be infused.
48
(distance traveled in the center + distance traveled in along the margins)] × 100). Mice were placed back into their homecages after the one hour test period. Like the elevated plus maze, a Latin-square design was not used for the locomotor test. Animals received a single, bilateral infusion of either 0.0 or 6.0 µg of SB. Each animal received the alternate drug treatment based on its assigned drug condition during the previous elevated zero maze test.
Data Analysis
A repeated-measures ANOVA was used to assess hourly binge consumption with both time (hour 1 and hour 2) and dose (0.0 or 6.0 µg for SB; 0.0, 5.0, or 7.5 µg for TCS) being within-subject variables. Additionally, BEC and total binge consumption across the two-hour test period was assessed using separate repeated-measures ANOVAs with dose (0.0 or 6.0 µg for SB; 0.0, 5.0, or 7.5 µg for TCS) as the within-subject variable. We also included drug order as a between-subjects variable in these analyses to ensure the order in which the animals were presented the drug did not have any confounding effects on drinking behavior. Importantly, due to the relatively short half-life and hyper-transient nature of the compounds (Mould et al, 2014; Porter et al, 2001), the effects of these compounds can be rather short-lived (Olney et al, 2015). Thus, planned comparisons were used to assess binge-like consumption of each drug group relative to its respective vehicle during the first hour of testing in order to better capture the short-lived effect of the compound.
49
tests with dose of SB (0.0 or 6.0 µg) being a between-subjects variable while total distance traveled, percent distance traveled in the center, and percent time spent in the center across the twelve 5-min bins were all considered within-subject variables. Tukey’s LSD post-hoc tests and Bonferroni corrections were employed throughout the analyses when applicable.
Results
Our omnibus analysis revealed that binge-like ethanol consumption levels did not change over time (Figure 3.2A; Main effect of Time: F(1,15) = 2.701, p = 0.121) nor did inhibition of OX1Rs in the VTA significantly alter binge-like ethanol drinking (Main effect of Dose: F(1,15) = 2.651, p = 0.096; Time×Dose Interaction: F(1,15) = 2.189, p = 0.160). However, planned comparisons revealed that, relative to vehicle treated controls, SB significantly blunted binge-like ethanol intake during the first hour of testing (t(16) = 2.208, p = 0.042). Moreover, no significant effect was observed in total binge-like ethanol drinking across the two-hour test period (F(1,15) = 3.161, p = 0.096). Despite the reduction in binge drinking during the first hour of testing, no significant difference in BECs was observed between the two drug conditions when blood samples were collected after the full two hour test (Figure 3.2B; F(1,15) = 0.419, p = 0.527). Importantly, binge-like ethanol drinking was not affected by the order in which the animals received their treatment (F(1,15) = 3.489, p = 0.081) nor did it impact BECs (F(1,15) = 0.134, p = 0.720).
50
0.711, p = 0.412); however, we did find a significant interaction effect (Time×Dose Interaction: F(1,15) = 4.876, p = 0.043). Further probing revealed that this effect was driven by the fact that binge-like sucrose intake among vehicle-treated animals was significantly greater during the first hour of testing relative to the second hour (t(16) = 2.473, p = 0.025). Notably, planned comparisons revealed no significant difference in sucrose consumption during the first hour of testing between the two treatment groups (t(16) = 1.463, p = 0.163). Moreover, sucrose consumption across the entire two hour test period did not significantly vary as a function of SB treatment (F(1, 15) = 0.711, p = 0.412). Additionally, the order in which the animal received the compound did not confound binge-like sucrose drinking (F(1, 15) = 0.024, p = 0.878).
Importantly, we found the effect of intra-VTA SB to blunt binge-like ethanol consumption to be specific to the VTA as similar treatment slightly dorsal to the VTA did not produce any significant alterations in binge-like ethanol drinking as a function of treatment (Figure 3.2D; Main effect of Dose: F(1,10) = 4.188, p = 0.068; Time×Dose Interaction: F(1,10) = 3.989, p = 0.074; Total ethanol consumption: F(1,10) = 4.188, p = 0.068; SB versus vehicle planned comparison at the first hour: t(11) = -0.278, p = 0.786) although we did observe that the animals drank significantly more ethanol during the second hour of testing relative to the first hour regardless of treatment condition (Main effect of Time: F(1,10) = 7.037, p = 0.024). Moreover, we did not observe any effect on BEC levels as a function of treatment (Figure 3.2E; F(1,9) = 0.028, p = 0.870). Additionally, whether the animal received treatment with vehicle or SB first did not impact binge-like ethanol consumption (F(1,10) = 0.268, p = 0.616) or BECs (F(1,9) = 0.108, p = 0.750).
51
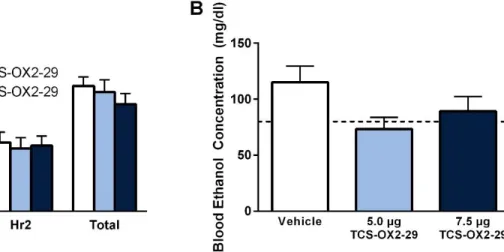
drinking over time but the effect did not reach significance (Figure 3.3A; Main effect of Time: F(1,19) = 3.175, p = 0.091). Similarly, none of the doses tested affected binge-like ethanol intake (Main effect of Dose: F(2,38) = 0.669, p = 0.518; Time×Dose Interaction: F(2,38) = 0.425, p = 0.657). Using planned comparisons, we did not observe any significant effect in the low dose (5.0 µg) of TCS relative to vehicle-treated controls during the first hour of testing (t(21) = -0.005, p = 0.996) but we did see a marginal, yet nonsignificant, trend for the high dose (7.5 µg) of TCS
to reduce binge-like ethanol consumption relative to vehicle (t(21) = 1.790, p = 0.088). Additionally, we did not observe any effect across the total two hours of testing (F(2,38) = 0.669, p = 0.518). Although we did not observe any significant alterations in drinking behavior, there was a marginal, albeit nonsignificant, effect for BEC levels to vary as a function of treatment group (Figure 3.3B; F(2,34) = 3.181, p = 0.054). Moreover, the order in which the animals received the drug treatment did not significantly impact binge-like ethanol drinking (F(1, 19) = 0.194, p = 0.825).
It is well-known that both positive and negative reinforcement may drive an individual to consume ethanol (Eckardt et al, 1998; Koob, 2009; Sinha, 2007). The VTA is perhaps best known as a brain area that is integral to reward processing; however, recent evidence has emerged that indicates that OX activity in the VTA may drive stress responding as well (Hata et al, 2011). In an effort to disentangle the overlaying psychological drive that explains how
52
neither the frequency that the animal explored the open area (Figure 3.4D; F(1, 10) = 1.901, p = 0.198) nor the time engaged in exploratory behavior (F(1, 10) = 1.443, p = 0.257).
Similarly, we did not observe any effect of intra-VTA SB on anxiety-like behaviors as measured in the open-field locomotor test. Inhibiting OX1Rs within the VTA did not alter the proportion of distance traveled in the center of the chamber relative to the margins (Figure 3.5A; Main effect of Dose: F(1, 8) = 0.740, p = 0.415; Time×Dose Interaction: F(11,88) = 1.425, p = 0.254); although the animals did display significant variability in the proportion of distance traveled in the center as a function of time (Main effect of Time: F(11,88) = 4.573, p = 0.007). Further probing of this effect with Tukey’s LSD revealed the significant differences at the
following time points: 10 min > 40 min (p = 0.002), 10 min > 55 min (p = 0.001), 15 min > 25 min (p = 0.002), 15 min > 55 min (p = 0.003), 20 min > 55 min (p = 0.003), 35 min > 45 min (p = 0.002), 35 min > 50 min, (p = 0.004), 35 min > 55 min (p = 0.001). We also did not observe any significant effects in any of the variables assessing the proportion of time spent in the center of the chamber relative to the margins (Figure 3.5B; Main effect of Time: F(11,88) = 1.223, p = 0.318; Main effect of Dose: F(1, 8) = 0.156, p = 0.704; Time×Dose Interaction: F(11,88) = 0.700, p = 0.617). Notably, intra-VTA treatment with SB did not significantly influence gross locomotor activity (Figure 3.5C; Main effect of Dose: F(1, 8) = 2.122, p = 0.183; Time×Dose Interaction: F(11,88) = 1.472, p = 0.231); although the animals exhibited varying amounts of activity across the
53 Discussion
It has previously been reported that peripheral administration of either an OX1R or OX2R antagonist is capable of protecting against binge-like consumption of a salient reinforcer (Anderson et al, 2014; Olney et al, 2015), and that signaling onto the OX1R or OX2R (or both) within the VTA modulates ethanol responding (Srinivasan et al, 2012). Findings from the current report were able to provide a more detailed characterization of the contribution of OX signaling within the VTA in modulating binge-like ethanol drinking behavior. Specifically, we demonstrated that intra-VTA infusion of SB, but not TCS, reduced binge-like ethanol intake. Despite this effect, SB did not significantly reduce BECs; however, this may be due to the very short half-life (Porter et al, 2001) and the fact that BECs were measured at the end of the two hour test period. Moreover, this effect was found to be reinforcer- and brain region-specific as similar treatment with SB did not alter like sucrose consumption nor did it impact binge-like ethanol drinking when infused dorsal to the VTA. Notably, inhibiting OX1Rs in the VTA did not impact general locomotor behavior (Figure 3.5C)-indicating that such treatment does not engage OX circuitry involved in sleep and arousal (de Lecea, 2012). Together, these experiments were able to extend the previous literature by observing OX signaling- specifically onto the OX1R- within the VTA, in part, modulates binge-like ethanol consumption without altering anxiety-like behaviors.
54
modulating ethanol drinking (Anderson et al, 2014; Barson et al, 2015; Shoblock et al, 2011). More importantly, we did observe a slight, albeit nonsignificant, trend for the higher dose of TCS (7.5 µg) to disrupt ethanol drinking during the first hour of testing relative to vehicle-treated animals. Furthermore, we also observed that the lower dose of TCS (5.0 µg) reduced BECs to a level below the threshold to be considered a binge episode and marginally reduced BECs relative to vehicle-treated controls. Together, these findings suggest that OX2Rs in the VTA may have relatively more subtle effects on ethanol consumption that were not fully captured in the present experiments. Thus, it may be the case that signaling onto OX2Rs within the VTA contributes to binge-like ethanol drinking behavior but that its role is secondary to that of OX1Rs- although further testing of this hypothesis is needed before any definitive conclusions can be drawn. Although we used a range of doses in order to better assess the contribution of the OX2R, we were limited in the concentration of TCS we could feasibly use due to restrictions in the solubility of the compound in DMSO; thus, alternative OXR agents may be ideal for future investigations. For example, if the OX2R does contribute to this behavior then intra-VTA administration of orexin-B, which has a much greater affinity for the OX2R over the OX1R, may augment ethanol drinking behavior.