A STUDY OF PREVENTABLE HOSPITAL UTILIZATION AMONG MEDICAID-INSURED PEDIATRIC PATIENTS IN NORTH CAROLINA’S FEDERALLY QUALIFIED HEALTH
CENTERS
Rebecca Garr Whitaker
A dissertation submitted to the faculty at the University of North Carolina at Chapel Hill in partial fulfillment of the requirements for the degree of Doctor of Philosophy in the Department of
Health Policy & Management in the Gillings School of Global Public Health.
Chapel Hill 2019
© 2019
ABSTRACT
Rebecca Garr Whitaker: A Study of Preventable Hospital Utilization among Medicaid-Insured Pediatric Patients in North Carolina’s Federally Qualified Health Centers
(Under the direction of Pam Silberman)
Objective. The goal of this research is to evaluate preventable hospital utilization among Medicaid-insured federally qualified health center (FQHC) patients in North Carolina and to determine organizational factors associated with preventable hospital use.
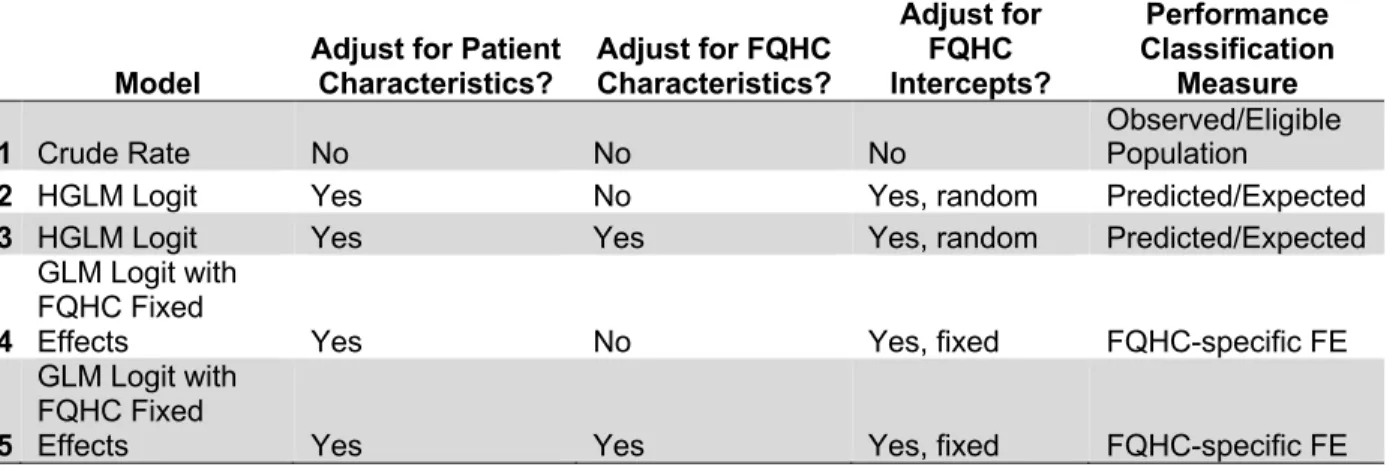
Methods. Using 2013-2015 Medicaid claims data, we applied instrumental variable analysis using two-stage residual inclusion to account for differential patient selection into FQHCs and estimated the association of FQHC use on preventable hospital utilization. Because there is no “gold standard” in performance classification, we applied three different
methodologies to rank FQHC organizations according to their relative rates of preventable hospital use and estimated an overall performance ranking that incorporated the results of the three statistical approaches. Finally, we estimated patient-level regression models with FQHC fixed effects and ran organization-level configurational comparative analyses to identify organizational characteristics associated with preventable hospital utilization.
Results. Across all model specifications in this study sample, we found that FQHC patients had a significantly higher probability of preventable hospital utilization when compared to patients accessing primary care services from non-FQHC providers. We identified variation in the absolute rankings of FQHC organizations across performance classification methodologies, but the organizations comprising the top- and bottom-performance quartiles remained
more likely to experience preventable hospital use even after controlling for patient characteristics. However, these results were associated with significant limitations.
Conclusions. The differential effect of FQHC use may be driven by higher emergency department utilization among FQHC patients, as this comprised the majority of hospital use among pediatric asthma patients in this study. Patients using FQHCs with a broader scope of non-medical services and more of certain types of non-medical services staff were more likely to have preventable hospital utilization, but these organization-level factors do not reflect patient-level utilization of services. Children may be accessing non-medical services in FQHCs less frequently than adults, for example. Future research should incorporate FQHCs’ electronic health record data and qualitative interviews to best identify organization structures and processes associated with performance. This research also underscores the need for
ACKNOWLEDGEMENTS
I would like to thank my advisor and dissertation chair, Pam Silberman, for her wisdom, guidance and reality checks. I would also like to thank the members of my dissertation
committee – Sarah Birken, Marisa Domino, Mark Holmes and Brad Wright – for their expertise and thoughtful feedback.
This dissertation and doctoral journey would not have been possible without the love and support of my family. To Kyle, my partner in all things, I will never be able to thank you enough. Thank you for your patience, for reminding me why I started this journey in the first place, and for your quiet encouragement. To my parents, thank you for always believing in me and for not asking too many questions about my dissertation. To Josh and Sarah, thank you for always demonstrating a love of science. To Normcore, thank you for helping me celebrate my victories and for listening to me complain about my struggles.
To Karen Swietek, Christine Kim and Ruchir Karmali, thank you for being the best comprehensive exam study group I could have asked for and for continuing to let me pester you with questions even after you moved away. To Morris Weinberger, thank you for giving me the push I needed to start this journey in the first place.
To Benjamin Money and the staff at the North Carolina Community Health Center Association, thank you for your ideas, your support and your encouragement. To Michael Baumgartner, thank you for your patient tutelage on coincidence analysis.
TABLE OF CONTENTS
LIST OF TABLES ... x
LIST OF FIGURES ... xii
LIST OF ABBREVIATIONS ... xiii
CHAPTER ONE: INTRODUCTION ... 1
Overview of the Federally Qualified Health Center Program ... 1
Factors Associated with Organization Performance ... 2
Study Objective and Specific Aims ... 4
Conceptual Model ... 7
Study Population ... 8
Significance and Policy Implications ... 10
REFERENCES ... 13
CHAPTER TWO: THE EFFECT OF FEDERALLY QUALIFIED HEALTH CENTER USE ON PREVENTABLE HOSPITAL UTILIZATION FOR ASTHMA IN NORTH CAROLINA ... 17
Overview ... 17
Background ... 18
Methods ... 20
Data Source and Study Sample ... 21
Key Variables and Measures ... 22
Analytic Approach ... 28
Results ... 30
Discussion ... 33
Conclusion ... 35
REFERENCES ... 42
CHAPTER THREE: USING MULTIPLE STATISTICAL METHODS TO GENERATE AN OVERALL PERFORMANCE RANKING FOR PREVENTABLE HOSPITAL USE AMONG FEDERALLY QUALIFIED HEALTH CENTERS ... 48
Overview ... 48
Background ... 49
Methods ... 53
Analytic Approach ... 54
Data Source and Inclusion Criteria ... 58
Key Variables and Measures ... 59
Results ... 62
Discussion ... 63
Limitations ... 65
Conclusion ... 65
REFERENCES ... 73
CHAPTER FOUR: ORGANIZATIONAL CHARACTERISTICS ASSOCIATED WITH PREVENTABLE HOSPITAL UTILIZATION AMONG FEDERALLY QUALIFIED HEALTH CENTERS ... 77
Overview ... 77
Background ... 78
Part 1: Regression Analytic Method ... 83
Methods ... 83
Data Source and Inclusion Criteria ... 83
Key Variables and Measures ... 84
Analytic Approach ... 89
Results ... 90
Part 2: Configurational Comparative Analysis Using Coincidence Analysis ... 92
Methods ... 92
Data Source and Inclusion Criteria ... 92
Key Organizational Characteristics ... 92
Analytic Approach ... 94
Results ... 96
Part 3: Discussion ... 99
Limitations ... 102
Conclusion ... 103
REFERENCES ... 117
CHAPTER FIVE: DISCUSSION ... 122
Overview of Findings ... 122
Policy Implications ... 125
Limitations and Directions for Future Research ... 126
Directions for Future Research ... 126
Conclusion ... 127
REFERENCES ... 129
APPENDIX A: VARIABLE DEFINITIONS FOR AIMS 1-3 ... 131
REFERENCES ... 134
APPENDIX B: AIM 1 SENSITIVITY ANALYSES ... 135
APPENDIX C: OVERVIEW OF CONFIGURATIONAL COMPARATIVE METHODS INCLUDING COINCIDENCE ANALYSIS ... 148
REFERENCES ... 154
LIST OF TABLES
Table 2.1. Bivariate Statistics for Analytic Sample: 2013-2015 Medicaid Children
with Asthma ... 37 Table 2.2. Average Marginal Effects of Model Covariates on Preventable Hospital
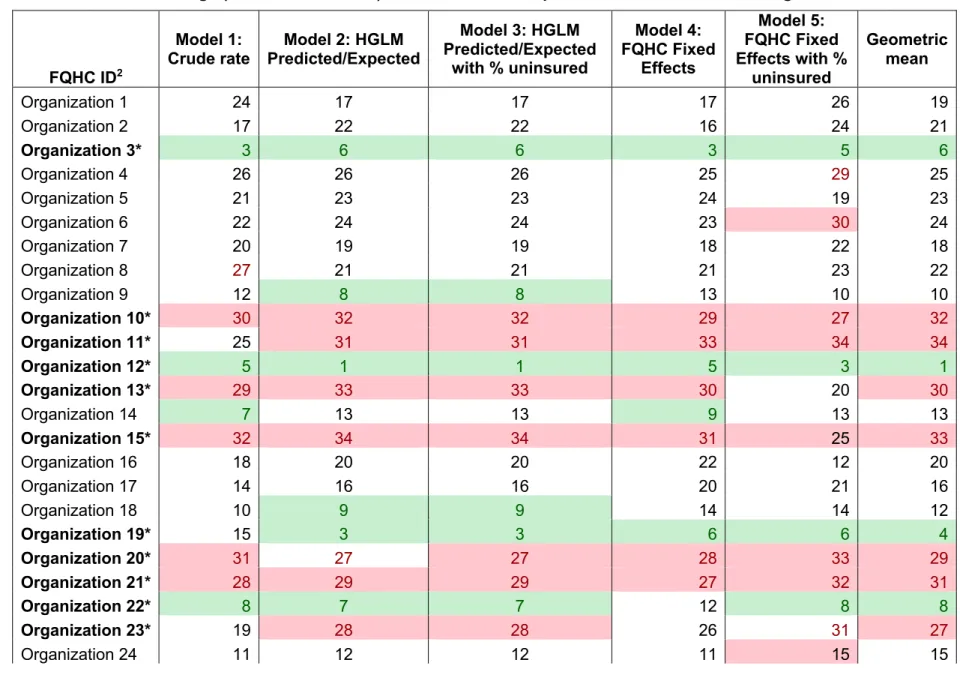
Utilization (Main Model Specification) ... 39 Table 3.1. Summary of FQHC Ranking Methodologies ... 67 Table 3.2. Hospital Utilization by FQHC Organization, 2013-2015 ... 68 Table 3.3. FQHC Rankings (1-35, Best to Worst) for Preventable Hospital
Utilization Rates according to Five Models1 ... 70 Table 4.1. Covariates Derived from FQHC Uniform Data System (UDS) data ... 105 Table 4.2. Descriptive Statistics, 2013-2015 FQHC and Patient Characteristics ... 106 Table 4.3. Average Marginal Effects of FQHC Characteristics on Preventable
Hospital Utilization, 2013-2015 ... 108 Table 4.4. Organizational Characteristics, Factor Names and Set Membership
Definitions for Coincidence Analysis ... 111 Table 4.5. Model 1 Coincidence Analysis Results for Organizations with High
Concentrations of Uninsured Patients and Low Concentrations of Pediatric
Patients (N=11 cases) ... 113 Table 4.6. Model 2 Coincidence Analysis Results for Organizations with High
Concentrations of Uninsured Patients and Low Concentrations of Pediatric
Patients (N=11 cases) ... 115 Table B.1. Differential Effect of Federally Qualified Health Center (FQHC) Use in
All Model Specifications ... 135 Table B.2. Average Marginal Effects of Model Covariates on Preventable
Hospital Utilization with a 60-Day Washout Period ... 136 Table B.3. Average Marginal Effects of Model Covariates on Preventable
Hospital Utilization - CCNC Medical Home Attribution ... 138 Table B.4. Average Marginal Effects of Model Covariates on Preventable
Hospital Utilization - Ever-FQHC Attribution ... 140 Table B.5. Average Marginal Effects of Model Covariates on Preventable
Hospital Utilization with a Principal Diagnosis of Asthma and Lagged FQHC
Attribution, 2014-2015 ... 142 Table B.6. Average Marginal Effects of Model Covariates on Preventable
Hospital Utilization with Any Diagnosis of Asthma and Lagged FQHC Attribution,
LIST OF FIGURES
Figure 1.1 Conceptual Model Illustrating the Influence of Organization Context,
Structures and Processes on Organization Performance ... 12
Figure 2.1. Differential Effect of FQHC Use across Sensitivity Analyses and Model Specifications ... 41
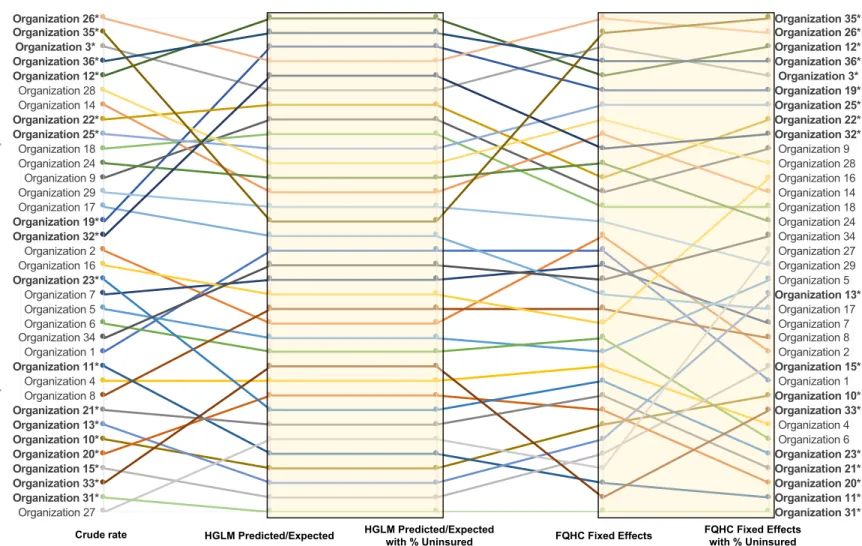
Figure 3.1. Variation in FQHC Ranking by Method and Model1 ... 69
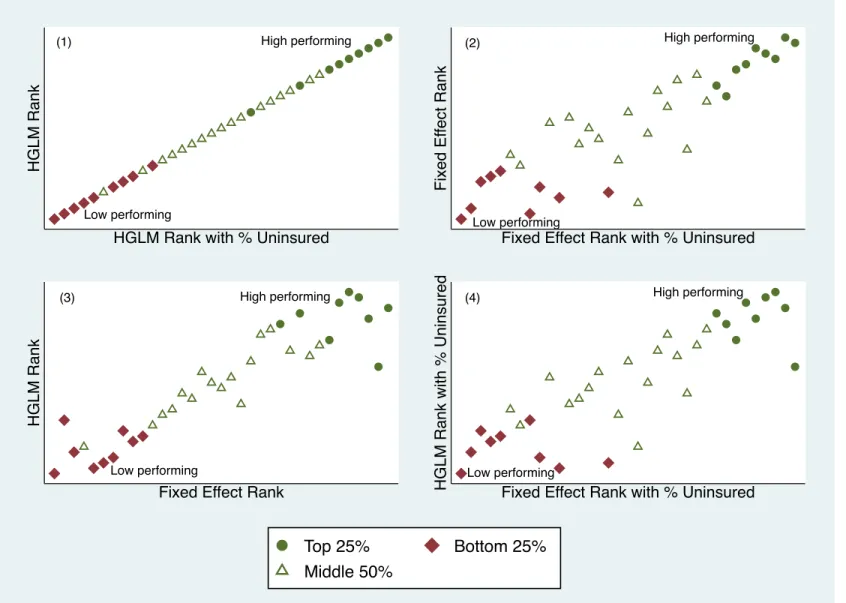
Figure 3.2. Ranking Agreement across Four Regression-Based Methods Relative to Overall Performance Ranking ... 72
Figure D.1. Threshold Placement for Control Factors ... 156
Figure D.2. Threshold Placement for Staffing Ratios ... 157
Figure D.3. Threshold Placement for Individual Enabling Services Staffing Ratios ... 158
LIST OF ABBREVIATIONS 2SRI Two-stage residual inclusion
AHRQ Agency for Healthcare Research and Quality BPHC Bureau of Primary Health Care
CCNC Community Care of North Carolina CCI Chronic Condition Indicator
CCM Configurational Comparative Method CCS Clinical Classification Software CDC Centers for Disease Control
CMS Centers for Medicare & Medicaid Services CNA Coincidence analysis
CPT Current Procedural Terminology
ED Emergency department
EHR Electronic health record
FQHC Federally Qualified Health Center FTE Full-time equivalent
GEE Generalized estimating equation GLM Generalized linear model
HGLM Hierarchical generalized linear model
ICD-9 International Classification of Diseases, 9th Revision, Clinical Modification ICD-10 International Classification of Diseases, 10th Revision, Clinical Modification NPPES National Plan & Provider Enumeration System
QCA Qualitative comparative analysis
CHAPTER ONE: INTRODUCTION Overview of the Federally Qualified Health Center Program
Federally qualified health centers (FQHCs) represent the largest network of independent primary care practices serving vulnerable populations. Of the roughly 26 million patients served in FQHCs in 2016, more than 90% had incomes below 200% of the federal poverty line, more than 60% were racial/ethnic minorities, and nearly 25% were uninsured.1 Because they predominately care for low-income and uninsured patients, FQHCs are uniquely positioned to make substantial improvements to the health of these vulnerable groups. Researching
successful FQHC models can help improve population health and may have the potential to reduce health care costs and utilization.
FQHCs’ focus on vulnerable populations is driven in part by the federal regulations governing the program. The FQHC program is administered by the Bureau of Primary Health Care, part of the Health Resources and Services Administration in the US Department of Health and Human Services. To receive the FQHC designation, facilities must be located in medically underserved areas or serve medically underserved populations.2 The FQHC designation confers certain financial benefits (e.g., grant money to offset some of the costs of caring for the uninsured) in exchange for complying with a series of program requirements related to
Two other program requirements are key features of the FQHC model: serving all patients regardless of ability to pay and operating under a patient-majority governing board.4–6 Serving all patients regardless of ability to pay ensures access to primary health care for everyone, and maintaining a patient-majority board is intended to ensure that the FQHCs are guided by and responsive to community needs.7 Because of these federal requirements, the FQHC primary care delivery model is markedly different from most other primary care providers.
The FQHC primary care model has benefited patients utilizing these clinics. In fact, previous research found that compared to other practice settings, FQHCs attenuated
racial/ethnic disparities in clinical outcomes,8 had equivalent or better ambulatory care quality measures,9 reduced preventable hospitalizations and ED visits,10–12 and lowered annual health expenditures13–16 despite serving more vulnerable patients.17 Other studies exploring area-level effects of FQHCs found that increased FQHC density (sites per 100 square miles) and
increased funding for FQHCs (funding per person living in poverty) were associated with lower ED utilization and greater utilization of office-based care for low-income and uninsured patients in the community.18,19
However, little evidence exists identifying the mechanisms by which FQHCs are able to improve patient outcomes and reduce costs and unnecessary utilization in their patient
population. Identifying factors associated with successful FQHC care delivery models can provide insight into how to address the Triple Aim of health care for vulnerable groups: better population health, better patient experience and lower health care costs.20
Factors Associated with Organization Performance
Previous studies of FQHC characteristics associated with performance have been
inconclusive, finding heterogenous effects of across clinical quality performance measures.8,17 In one study, Shi and colleagues17 measured FQHC performance using six clinical quality
estimated logistic regression models using one year of data to predict membership in the top performance quartile as a function of various organization-level measures. The researchers found no consistent relationships between FQHC organizational characteristics and
performance across the various clinical quality measures, indicating a need for additional research. More definitive research findings could promote the replication of successful care models both within the FQHC program and across other providers caring for vulnerable patients.
In a mixed methods study, Gurewich and colleagues21 identified operational practices associated with high-performing FQHCs. To identify the high performers, Gurewich and
colleagues utilized Medicaid claims to estimate organization performance on six quality of care measures and two cost-related measures. The regression models included FQHC fixed effects to account for unobserved organization-level factors affecting performance and controlled for patient demographic and clinical characteristics, as well as months of Medicaid enrollment. Following the quantitative analysis, they interviewed staff from the high-performing FQHCs to identify common operational practices and systems. The interviews identified four program elements characterized by fourteen operational practices. The program elements and examples of the associated operational practices included: facilitating access to care through extended operating hours or wait-time reduction strategies; managing referrals through a centralized system and patient tracking; supporting providers and patients through care teams and decision support tools; and monitoring/initiating performance improvement through organization-level and provider-level quality measures and performance incentives.
on both the needs of the patient population but also whether other community resources are available to meet those needs. Therefore, organizational characteristics associated with performance could also vary by organizational context. For this reason, methodological approaches are needed to distinguish organizational characteristics associated with performance in different contexts.
An organization’s patient mix can also influence performance. Cross and colleages22 examined private insurance claims to determine how the concentration of high-needs patients (patients with two or more chronic conditions) within a practice influenced health outcomes for high-needs patients across thirteen utilization, spending and quality measures. They found lower spending and utilization but worse quality measures for practices with higher
concentrations of high-needs patients. The authors hypothesized that providers caring for significant proportions of high-need patients might develop specialized approaches and expertise to serve their target population. They suggested these practices might be prioritizing keeping patients out of the hospital instead of compliance with evidence-based guidelines, which could explain the worse quality of care measures but lower spending and utilization for practices with high concentrations of high-need patients.22 Because FQHCs are known to predominately serve low-income, uninsured and underinsured individuals,1 methodological approaches to estimate performance should consider variation in the concentration of high-needs patients both across FQHCs and in FQHCs relative to other practice settings. For this reason, the Bureau of Primary Health Care uses the percent of patients who are uninsured, racial/ethnic minorities, homeless and migrant/seasonal farmworkers to assess FQHCs’ clinical quality rankings relative to other FQHCs with a similar patient mix.23
Study Objective and Specific Aims
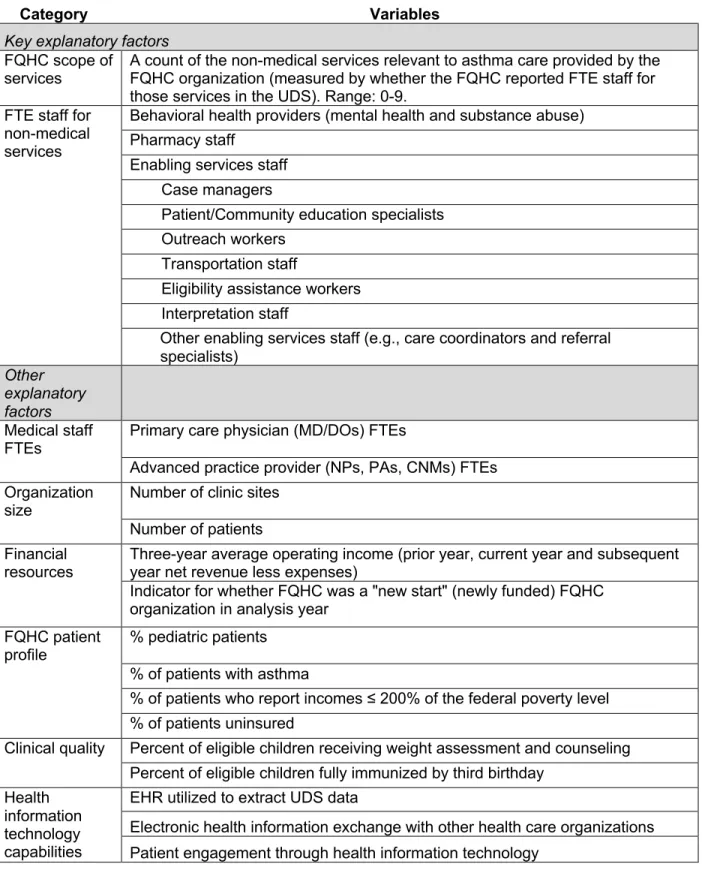
characteristics associated with FQHC performance. We use preventable hospital utilization (including emergency department or ED visits, as well as observation and inpatient stays) as a proxy for FQHC performance, as it is a reflection of the downstream effect of primary care management in the health care system.24–27 We hypothesize that a broader scope of services and more non-medical services staffing (behavioral health, pharmacy and enabling services staff) will be associated with lower preventable hospital utilization rates among FQHC patients. Providing a broader scope of FQHC services and staffing greater numbers of non-medical services FTEs acknowledges a patient population with medical and non-medical barriers to good health and can reduce the likelihood that unmet needs lead to preventable hospital utilization by creating a “one-stop shop” for health services.28
Previous research underscores the importance of non-medical services on improving patient outcomes,29–32 particularly among vulnerable patient populations. For example, Vest and colleauges32 examined whether utilizing one of five “wraparound services” – behavioral health, social work, dietetics, respiratory therapy and patient navigation services – in a large, urban FQHC reduced high-cost hospital utilization among adult patients. Using electronic health record data, they found a seven-percentage point reduction in hospitalizations (p<.001) and a five-percentage point reduction in ED visits (p<.001) following receipt of a wraparound service.32
FQHCs are required to provide enabling services (e.g., transportation and case
management) and access to comprehensive primary care services, including behavioral health and pharmacy services, but requirements do not stipulate how these services are delivered. In fact, the choice of which non-medical, services to provide has been found to vary by
uninsured patients were significantly associated with both broader scope of services and greater volume of enabling services provided in the subsequent year. The authors also found that FQHCs with more managed care contracts and more full-time equivalent (FTE) staff in the previous year provided both a broader scope and larger volume of enabling services in the following year. These studies underscore the need for methodological approaches to account for interdependencies among organizational characteristics.
We organize our research according to the following three aims:
Aim 1: Estimate the performance of FQHCs in reducing preventable hospital
utilization relative to other primary care providers. Hypothesis: FQHC patients will have
lower preventable hospital utilization relative to patients in other primary care settings. In this study, we use instrumental variable analysis to account for the endogeneity associated with differential patient selection into FQHCs.
Aim 2: Establish an overall performance ranking for FQHCs based on multiple
methodological approaches and model specifications commonly used to classify
performance. Hypothesis: Variation will exist in FQHC rankings across statistical
methodologies and model specifications. We apply three common statistical approaches for estimating performance -- crude rate, hierarchical generalized linear models and fixed effect models – and establish an overall ranking using the geometric mean. The rankings from this analysis will be used for the configurational comparative analysis in Aim 3.
Aim 3: Identify organizational characteristics associated with preventable hospital
utilization among FQHC patients. Hypothesis: A broader scope of services and more
performance. In other words, the econometric analysis indicates which FQHC characteristics are significantly associated with the probability a patient experiences a preventable hospital visit, while the configurational comparative analysis uncovers the different combinations of characteristics that high performing organizations have in common.
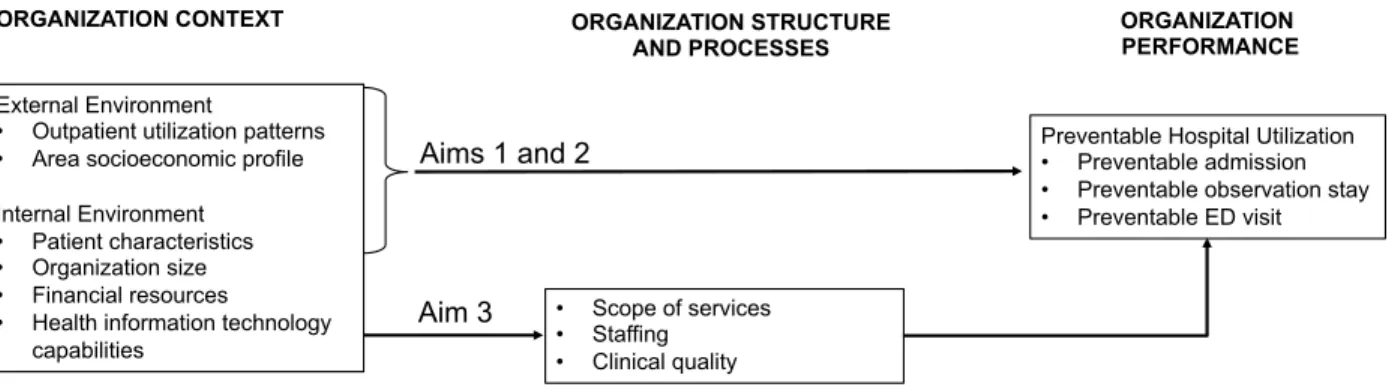
Conceptual Model
FQHCs are constructed to be responsive to community needs. A consequence of this community-driven health care model is wide variation in FQHC organization design, which is reflected in a common saying in the FQHC community: “if you have seen one FQHC, you have seen one FQHC.” Because of the variation across FQHCs, research is needed to identify organizational characteristics associated with high-performing organizations.
The conceptual model for this study (Figure 1) is based on structural contingency theory and is adapted from Hung and colleague’s study of the effects of contextual and structural factors on patient safety.34 Structural contingency theory is a useful conceptual model to explore organizational characteristics associated with FQHC performance because it maintains that there is no optimal organizational design associated with high performance.35 Instead, structural contingency theory holds that organization performance depends on the organization’s
adaptation to changing external and internal environments.36 The external environment encompasses factors that are beyond the control of the organization, while the internal
environment includes factors that shape work processes and activities within an organization.36 Organizations can respond to a changing external context by adapting their internal
environment.37 Organizations can also respond to changes in external and internal
Because they serve predominately vulnerable patients, we expect that FQHCs have shaped their internal environment, structure and processes to better care for these patients. The studies by Gurewich and colleagues21 and Cross and colleagues22 support this notion. Applying their reasoning to this research study, FQHCs’ organizational characteristics might vary based on the patients and communities served. In particular, we expect that FQHCs tailored their scope of services and non-medical services staffing to reflect their patients’ barriers to good health with the goals of addressing patients’ unmet needs and helping to improve health outcomes. A broad scope of services translates to providing FQHC patients with access to behavioral health, pharmacy and enabling services staff.
As illustrated in Figure 1, Aim 1 estimates variation in preventable hospital utilization – including inpatient stays, observations stays, and ED visits – among FQHC and non-FQHC patients. These models adjust for external factors and patient characteristics known to influence preventable hospital utilization. Aim 2 utilizes the same variables to rank FQHC organizations according to their patients’ preventable hospital use. Finally, Aim 3 estimates the relationship between organization performance and a variety of internal FQHC organizational
characteristics. In total, these aims provide insight into how FQHCs reduce preventable hospital use among their patient population. Although this study included patient-level analysis models, an organizational-level conceptual model was appropriate given the intent to make organization-level inferences.
Study Population
The study population is narrowly constructed to include North Carolina Medicaid-insured children with asthma for the following reasons:
managed care limits variation in benefit design in the Medicaid program because there are no managed care intermediaries to impose their own utilization review or quality management systems.
2) Limited research exists on the effect of FQHC use on pediatric populations, and the studies that do exist are limited by imprecise definitions of FQHC use.16,19 One study applied area-level measures of FQHC access (sites per 100 square miles and percent of low-income children served in FQHCs),19 which could capture other area-level changes that might affect health care utilization, such as the availability of non-FQHC providers. Another study measured FQHC use using Medical Expenditure Survey data,16 but this survey broadly defines “community health centers” as facilities that provide services in areas with limited access to care38 which could include other non-FQHC organizations. This study also included neighborhood health clinics in the definition of community health center use.16 Furthermore, the service locations in the Medical Expenditure Panel Survey are based on patient self-report, which could be inaccurate if patients do not know whether their primary care clinic is a FQHC or another type of community provider.11
over recent years, limiting the “noise” present in the measure of asthma-related hospital utilization that could stem from changing practice guidelines.
4) Asthma is a leading cause of preventable hospital utilization in a pediatric population, the cost of which has been estimated to exceed $270 billion in the Medicaid program
nationwide.42 Nearly 18% of North Carolina children have asthma, and 30% of asthmatic children utilized emergency or urgent care because of asthma according to a parent self-report measure.43 Prevalence and utilization rates are even higher among racial/ethnic minority and low-income children.44 Therefore, research identifying organizational factors associated with lower asthma-related preventable hospital utilization can have a
significant impact on population health and health care costs.
Significance and Policy Implications
This study has important implications for the development of health care delivery models targeting vulnerable patients with asthma. Previous research suggests that low-income and uninsured individuals often have worse health outcomes.45,46 Therefore, this study presents an opportunity to improve population health and reduce health care costs by identifying successful FQHC practice models that could be implemented across the FQHC program and translated to other practice settings.
groups. For example, North Carolina’s efforts to reform Medicaid and support the development of advanced medical homes48 could be informed by this research.
Figure 1.1 Conceptual Model Illustrating the Influence of Organization Context, Structures and Processes on Organization Performance
ORGANIZATION PERFORMANCE External Environment
• Outpatient utilization patterns • Area socioeconomic profile Internal Environment • Patient characteristics • Organization size • Financial resources
• Health information technology capabilities
Preventable Hospital Utilization • Preventable admission • Preventable observation stay • Preventable ED visit ORGANIZATION CONTEXT ORGANIZATION STRUCTURE
AND PROCESSES
• Scope of services • Staffing • Clinical quality Aims 1 and 2
REFERENCES
1. Bureau of Primary Health Care. 2016 Health Center Data - National Program Grantee Data. Uniform Data System. https://bphc.hrsa.gov/uds/datacenter.aspx. Published 2017. Accessed October 4, 2017.
2. Section 330 of the Public Health Service Act.
http://uscode.house.gov/view.xhtml?edition=prelim&req=42+usc+254b&f=treesort&fq=tru e&num=20&hl=true. Accessed August 9, 2017.
3. Bureau of Primary Health Care. What is a Health Center?
https://bphc.hrsa.gov/about/what-is-a-health-center/index.html. Accessed August 9, 2017. 4. Bureau of Primary Health Care. Summary of Program Requirements.
https://bphc.hrsa.gov/programrequirements/summary.html. Accessed August 9, 2017. 5. Wright DB. Consumer governance and the provision of enabling services that facilitate
access to care at community health centers. Med Care. 2012;50(8):668-675. doi:10.1097/MLR.0b013e3182551763.
6. Wright B. Who governs federally qualified health centers? J Health Polit Policy Law. 2013;38(1):27-55. doi:10.1215/03616878-1898794.
7. Geiger HJ. The first community health centers: a model of enduring value. J Ambul Care Manage. 2005;28(4):313-320. http://www.ncbi.nlm.nih.gov/pubmed/16172560. Accessed September 14, 2017.
8. Lebrun LA, Shi L, Zhu J, et al. Racial/ethnic differences in clinical quality performance among health centers. J Ambul Care Manage. 2013;36(1):24-34.
doi:10.1097/JAC.0b013e3182473523.
9. Goldman LE, Chu PW, Tran H, Romano MJ, Stafford RS. Federally Qualified Health Centers and Private Practice Performance on Ambulatory Care Measures. Am J Prev Med. 2012;43(2):142-149. doi:10.1016/j.amepre.2012.02.033.
10. Falik M, Needleman J, Wells BL, Korb J. Ambulatory care sensitive hospitalizations and emergency visits: experiences of Medicaid patients using federally qualified health centers. Med Care. 2001;39(6):551-561. http://www.ncbi.nlm.nih.gov/pubmed/11404640. Accessed August 24, 2016.
11. Laiteerapong N, Kirby J, Gao Y, et al. Health care utilization and receipt of preventive care for patients seen at federally funded health centers compared to other sites of primary care. Health Serv Res. 2014;49(5):1498-1518. doi:10.1111/1475-6773.12178. 12. Wright B, Potter AJ, Trivedi A. Federally Qualified Health Center Use Among Dual
Eligibles: Rates Of Hospitalizations And Emergency Department Visits. Health Aff. 2015;34(7):1147-1155. doi:10.1377/hlthaff.2014.0823.
14. Richard P, Ku L, Dor A, Tan E, Shin P, Rosenbaum S. Cost savings associated with the use of community health centers. J Ambul Care Manage. 2012;35(1):50-59.
doi:10.1097/JAC.0b013e31823d27b6.
15. Nocon RS, Lee SM, Sharma R, et al. Health Care Use and Spending for Medicaid Enrollees in Federally Qualified Health Centers Versus Other Primary Care Settings. Am J Public Health. 2016;106(11):1981-1989. doi:10.2105/AJPH.2016.303341.
16. Bruen B, Ku L. Community Health Centers Reduce the Costs of Children’s Health Care.; 2017. http://publichealth.gwu.edu/projects/geiger-gibson-program-community-health-policy. Accessed June 28, 2017.
17. Shi L, Lebrun LA, Zhu J, et al. Clinical quality performance in U.S. health centers. Health Serv Res. 2012;47(6):2225-2249. doi:10.1111/j.1475-6773.2012.01418.x.
18. McMorrow S, Zuckerman S. Expanding federal funding to community health centers slows decline in access for low-income adults. Health Serv Res. 2014;49(3):992-1010. doi:10.1111/1475-6773.12141.
19. Nath JB, Costigan S, Lin F, Vittinghoff E, Hsia RY. Federally Qualified Health Center Access and Emergency Department Use Among Children. Pediatrics. 2016;138(4). doi:10.1542/peds.2016-0479.
20. Berwick DM, Nolan TW, Whittington J. The triple aim: care, health, and cost. Health Aff. 2008;27(3):759-769. doi:10.1377/hlthaff.27.3.759.
21. Gurewich D, Capitman J, Sirkin J, Traje D. Achieving excellence in community health centers: implications for health reform. J Health Care Poor Underserved. 2012;23(1):446-459. doi:10.1353/hpu.2012.0008.
22. Cross DA, Cohen GR, Lemak CH, Adler-Milstein J. Outcomes For High-Needs Patients: Practices With A Higher Proportion Of These Patients Have An Edge. Health Aff.
2017;36(3):476-484. doi:10.1377/hlthaff.2016.1309.
23. Health Resources and Services Administration. Uniform Data System (UDS) Health Center Adjusted Quartile Ranking.
https://bphc.hrsa.gov/datareporting/reporting/ranking.html. Accessed April 21, 2017. 24. Starfield B, Shi L, Macinko J. Contribution of Primary Care to Health Systems and Health.
Milbank Q. 2005;83(3):457-502. doi:10.1111/j.1468-0009.2005.00409.x.
25. Friedman B, Basu J. Health insurance, primary care, and preventable hospitalization of children in a large state. Am J Manag Care. 2001;7(5):473-481.
http://www.ncbi.nlm.nih.gov/pubmed/11388127. Accessed August 24, 2017.
27. Whittaker W, Anselmi L, Kristensen SR, et al. Associations between Extending Access to Primary Care and Emergency Department Visits: A Difference-In-Differences Analysis. PLoS Med. 2016;13(9):e1002113. doi:10.1371/journal.pmed.1002113.
28. Andersen RM. Revisiting the behavioral model and access to medical care: does it matter? J Health Soc Behav. 1995;36(1):1-10.
http://www.ncbi.nlm.nih.gov/pubmed/7738325. Accessed January 27, 2015. 29. Bradley EH, Elkins BR, Herrin J, Elbel B. Health and social services expenditures:
associations with health outcomes. BMJ Qual Saf. 2011;20(10):826-831. doi:10.1136/bmjqs.2010.048363.
30. Bradley EH, Canavan M, Rogan E, et al. Variation In Health Outcomes: The Role Of Spending On Social Services, Public Health, And Health Care, 2000-09. Health Aff. 2016;35(5):760-768. doi:10.1377/hlthaff.2015.0814.
31. Gottlieb LM, Hessler D, Long D, et al. Effects of Social Needs Screening and In-Person Service Navigation on Child Health. JAMA Pediatr. 2016;170(11):e162521.
doi:10.1001/jamapediatrics.2016.2521.
32. Vest JR, Harris LE, Haut DP, Halverson PK, Menachemi N. Indianapolis Provider’s Use Of Wraparound Services Associated With Reduced Hospitalizations And Emergency Department Visits. Health Aff. 2018;37(10):1555-1561. doi:10.1377/hlthaff.2018.0075. 33. Wells R, Punekar RS, Vasey J. Why do some health centers provide more enabling
services than others? J Health Care Poor Underserved. 2009;20(2):507-523. doi:10.1353/hpu.0.0151.
34. Hung C-C, Hsu S-C, Lee L-L, Huang C-M. The Effects of Contextual and Structural Factors on Patient Safety in Nursing Units. J Nurs Res. 2013;21(3):225-233. doi:10.1097/jnr.0b013e3182a0b004.
35. Donaldson L. Strategy and Structural Adjustment to Regain Fit and Performance: In Defense of Contingency Theory. J Manag Stud. 1987;24(1):1-24. doi:10.1111/j.1467-6486.1987.tb00444.x.
36. Donaldson L. The Normal Science of Structural Contingency Theory. In: Clegg SR, Hardy C, eds. Studying Organization: Theory & Method. 1 Oliver’s Yard, 55 City
Road, London EC1Y 1SP United Kingdom: SAGE Publications Ltd; 1999:51-70. doi:10.4135/9781446218556.n2.
37. Donaldson L. The Contingency Theory of Organizations. Thousand Oaks, California: SAGE Publications, Inc.; 2001.
38. MEPS Household Component Main Study Glossary. Medical Expenditure Panel Survey. https://meps.ahrq.gov/survey_comp/hc_ques_glossary.shtml#C. Published 2010.
39. Agency for Healthcare Research and Quality. Pediatric Quality Indicators Technical Specifications - Version 6.0.
https://www.qualityindicators.ahrq.gov/Modules/PDI_TechSpec_ICD09_v60.aspx. Published 2017. Accessed October 3, 2017.
40. Billings J, Parikh N, Mijanovish T. Emergency Department Use in New York City: A Substitute for Primary Care?; 2000.
41. Faculty Research. NYU Center for Health and Public Service Research.
https://wagner.nyu.edu/faculty/billings/nyued-background. Accessed October 3, 2017. 42. Pearson WS, Goates SA, Harrykissoon SD, Miller SA. State-Based Medicaid Costs for
Pediatric Asthma Emergency Department Visits. Prev Chronic Dis. 2014;11:140139. doi:10.5888/pcd11.140139.
43. North Carolina State Center for Health Statistics. 2013-2014 CHAMP Topics. http://www.schs.state.nc.us/data/champ/201314/topics.htm#as. Published 2017. Accessed March 15, 2017.
44. Centers for Disease Control. Asthma - Data, Statistics and Surveillance.
http://www.cdc.gov/asthma/asthmadata.htm. Published 2016. Accessed October 13, 2016.
45. Hadley J. Sicker and poorer--the consequences of being uninsured: a review of the research on the relationship between health insurance, medical care use, health, work, and income. Med Care Res Rev. 2003;60(2 Suppl):3S-75S; discussion 76S-112S. doi:10.1177/1077558703254101.
46. Poulton R, Caspi A, Milne BJ, et al. Association between children’s experience of socioeconomic disadvantage and adult health: a life-course study. Lancet. 2002;360(9346):1640-1645. doi:10.1016/S0140-6736(02)11602-3.
47. Bureau of Primary Health Care. Health Center Program: Impact and Growth.
https://bphc.hrsa.gov/about/healthcenterprogram/index.html. Accessed August 9, 2017. 48. North Carolina Department of Health and Human Services. North Carolina’s Proposed
Program Design for Medicaid Managed Care. Raleigh; 2017.
49. Fingar K, Washington R. Potentially Preventable Pediatric Hospital Inpatient Stays for Asthma and Diabetes, 2003–2012. HCUP Statistical Brief #192. Rockville, MD; 2015.
CHAPTER TWO: THE EFFECT OF FEDERALLY QUALIFIED HEALTH CENTER USE ON PREVENTABLE HOSPITAL UTILIZATION FOR ASTHMA IN NORTH CAROLINA Overview
Purpose. To estimate the effect of federally qualified health center (FQHC) use relative to other sources of primary care on preventable hospital utilization in a population of Medicaid-insured children with asthma.
Methods. A cross-sectional analysis utilized North Carolina Medicaid claims from January 1, 2013 through September 30, 2015. Instrumental variable analysis using two-stage residual inclusion estimated distance from the centroid of the patient’s zip code to the nearest FQHC medical clinic to account for differential patient selection into FQHCs. Generalized linear models predicted the probability of preventable hospital utilization (inpatient stay, observation stay or emergency department visit) for Medicaid-insured children ages 2-17 years with a diagnosis of asthma. Sensitivity analyses varied outcome definitions and the method of patient attribution to organization/organization types.
Results. FQHC use was associated with a statistically significant increase in average preventable hospital utilization among Medicaid-insured children with asthma across all model specifications. The results from main analyses indicated that, compared to children receiving primary care from non-FQHC providers, FQHC use was associated with an average one percentage point increase in preventable hospital utilization (ED visit, observation stay or inpatient stay) with a primary diagnosis of asthma (p<.01) and a nearly three-percentage point increase in preventable hospital utilization for any diagnosis of asthma (p<.001).
with asthma who received care in other primary care settings. Future research should examine processes of care within FQHCs and the availability of non-hospital urgent care resources within FQHC service areas to determine why pediatric FQHC patients with asthma are going to the hospital more frequently than similar patients in non-FQHCs in North Carolina.
Background
Federally qualified health centers (FQHCs) represent the largest network of independent primary care practices serving vulnerable populations. Nationwide, FQHCs served 26 million patients in 2016. More than 90% of these patients had incomes below 200% of the federal poverty line, more than 60% were racial/ethnic minorities, and nearly 25% were uninsured.1 The 2016 patient population in North Carolina FQHCs was even more underrepresented: of the roughly 510,000 patients served, over 40% were uninsured, including 24% of children, and 66% of patients represented racial/ethnic minorities.2 Because they predominately care for low-income and uninsured patients, FQHCs are uniquely positioned to make substantial improvements to the health of these vulnerable groups.
Previous research indicates the FQHC primary care model has benefited patients utilizing these clinics. FQHCs provide guideline-concordant care at the same rate or more frequently than other primary care practices.6,7 Medicaid-insured and uninsured individuals utilizing FQHCs are more likely to report having a usual source of care than similar patients in other settings,8 and greater primary care access is associated with lower hospital utilization.9,10 In fact, previous studies indicate that FQHC patients have lower rates of inpatient admissions,11– 14 but the evidence for ED utilization is mixed.7,15,16 Furthermore, Medicaid patients utilizing FQHCs have lower total annual health care expenditures than patients utilizing other primary care practices.13,17,18 These findings are significant because FQHC patients tend to be sicker, poorer and more socioeconomically disadvantaged than patients in other primary care
practices.6 However, some of these studies comparing FQHCs to other primary care practices fail to account for patient selection into FQHCs,11,15,19,20 which could bias study findings.
Patients utilizing FQHCs may be different from non-FQHC patients in unobservable ways, and these differences can affect their health care utilization, spending and health outcomes. Previous studies of FQHC performance that incorporated methods to address the endogeneity of patient selection into the FQHC utilized either an instrumental variable
approach18 or propensity score analysis.7,13,17 Propensity score analysis has been more
commonly utilized in the FQHC literature to account for patient selection into the FQHC, but this method can only reduce bias to the extent that unobserved variables do not explain a large portion of the variation in FQHC use. For this reason, instrumental variable analysis represents a more rigorous methodological approach.
Expenditure Panel Survey data,17 but this survey broadly defines “community health centers” as facilities that provide services in areas with limited access to care21 which could include other non-FQHC organizations. Additional research is needed to quantify the effect of FQHCs on pediatric populations’ health care utilization, cost and outcomes.
The objective of this study is to generate a causal estimate of the effect of FQHC use on pediatric patients’ preventable hospital utilization for asthma. As the federal FQHC program continues to expand, understanding the effect of FQHC use on specific population groups is important in order to focus quality improvement efforts.
We chose to focus this study on Medicaid-insured children with asthma in North Carolina. At the time of this writing, North Carolina represented one of the few states without fully capitated Medicaid managed care, which decreased the “noise” in claims data stemming from variation in clinical guidelines and processes across managed care companies. Moreover, asthma is a leading cause of preventable hospital utilization in a pediatric population, the cost of which has been estimated to exceed $270 billion in the Medicaid program nationwide.22
According to parent self-report, nearly 18% of North Carolina children have asthma, and 30% of this population utilize emergency or urgent care for asthma.23 Prevalence and utilization rates are even higher among racial/ethnic minority and low-income children.24 Identifying primary care practices associated with lower pediatric asthma morbidity can help reduce health care spending and improve child health.
Methods
Our analysis focused on children with asthma because asthma represents the most commonly diagnosed chronic condition among children.29 Moreover, asthma is amenable to primary care intervention: it is one of two pediatric chronic conditions2 considered ambulatory care-sensitive,30 and chronic conditions are better reflections of ongoing care management and systems of care than are acute conditions. According to an algorithm developed by Billings and colleagues to classify emergency department utilization, 98% of all emergency department visits for asthma are considered emergent but preventable/avoidable,31,32 meaning that asthma has high face validity as an ambulatory care-sensitive condition. Additionally, the evidence-based guidelines for asthma care have remained consistent over recent years, limiting the “noise” present in the measure of asthma-related hospital utilization that could stem from changing practice guidelines.
Data Source and Study Sample
This study analyzed North Carolina Medicaid claims submitted by Medicaid providers to receive payment for services delivered from January 1, 2013 through September 30, 2015. Claims dated after September 30, 2015 were excluded from the analysis due to the transition to International Classification of Diseases, 10th Revision, Clinical Modification (ICD-10) coding and unresolved questions regarding the reliability and validity of coding after the transition.33
All continuously Medicaid-enrolled pediatric patients ages 2-17 years (inclusive) were included in the analysis sample beginning with the first year (2013-2015) they had a hospital or outpatient clinic claim with an asthma diagnosis. Children remained in the analysis sample regardless of whether they had a visit for asthma in a given analysis year if they demonstrated a pattern of utilization of care for asthma, i.e., if they had two or more visits for asthma across analysis years. (Roughly 33,000 person-years were excluded from the analysis for having only a single visit for asthma over multiple analysis years.)
Asthma diagnoses were identified using International Classification of Diseases, 9th Revision, Clinical Modification (ICD-9) codes 493.0-493.92. Replicating Domino and
colleagues’ approach, we applied a broad definition of asthma in order to maintain variation in the outcome variables.34
Children were excluded from the analysis sample if they were pregnant or had a diagnosis of cystic fibrosis or other respiratory system anomalies consistent with AHRQ’s Pediatric Quality Indicator for asthma (n=237,051 claims dropped).35 After exclusions,
approximately 382,000 person-years representing Medicaid-insured children ages 2-17 years with a diagnosis of asthma were eligible for this study. Analyses were conducted using
complete case analysis, which dropped approximately 671 (<1%) person-years due to missing county-level data.
Key Variables and Measures
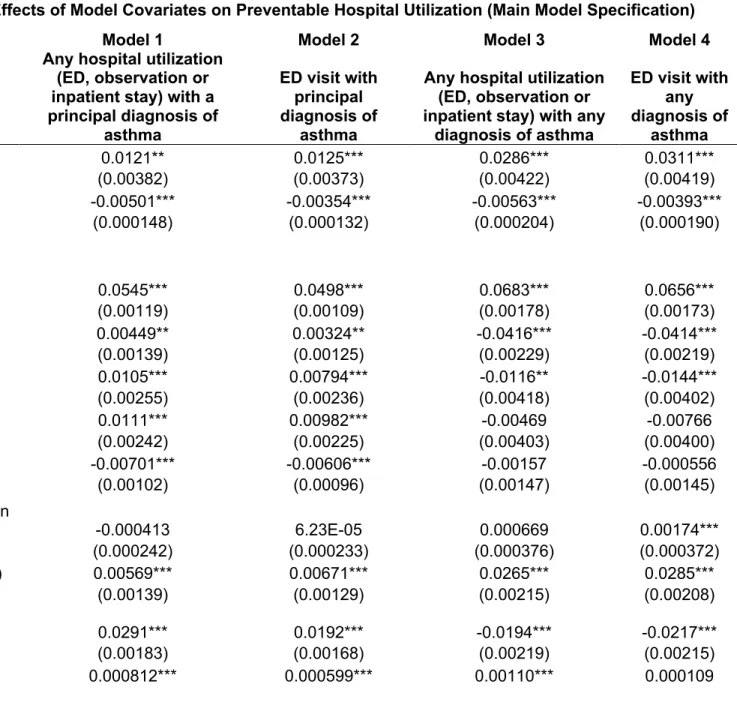
Outcome specifications were developed using AHRQ’s Pediatric Quality Indicator for asthma. The primary outcome was a binary variable, any hospital utilization with a principal diagnosis of asthma. Any hospital utilization encompassed emergency department (ED) visits, observation or inpatient stays. Given the increasing frequency of hospital observation stays, we felt it important to include this type of hospital utilization in our outcome measures.36–38 ED visits represented the majority of hospital utilization, so we modeled a binary indicator for ED visits with a principal diagnosis of asthma as a secondary outcome. Although AHRQ’s Pediatric Quality Indicator for asthma is specific to inpatient admissions, previous studies applied the same definition to ED use.39–41 Secondary model specifications included hospital utilization with any diagnosis of asthma – i.e., if asthma was included in any one of the ten diagnosis claim fields.
in the ED), followed by an observation stay, and finally an ED visit that resulted in a discharge. In other words, a visit to the ED counted only if the patient did not also have an observation or inpatient stay during the same visit.
Sensitivity analyses modified the outcome definitions and modeled hospital utilization after a “washout” period. To create a washout period, we excluded patients’ hospital utilization if it occurred within 60 days of their first visit to their attributed practice each year. As a
consequence, hospitalizations in the first two months of each calendar year were censored, which could bias the results downward.
Key explanatory variable. The key explanatory variable was a binary indicator for FQHC versus non-FQHC patient. Organizations were identified as FQHCs in Medicaid claims using any of the following identifiers: FQHC taxonomy code, taxonomy qualifier code (provider type and specialty code), place of service code, and billing provider National Provider Identifier (NPI) after an organization name-based search using CMS’s National Plan & Provider Enumeration System (NPPES). To the extent possible given data constraints, this approach mirrored the recommended approach for identifying rural health clinics in claims data.42
Non-FQHC organizations were restricted to primary care practices and were identified using rendering provider (when available) and billing provider taxonomy codes, as well as primary care-specific Current Procedural Terminology codes, an approach applied in previous research.18 Current Procedural Terminology codes classified as primary or preventive services in the Affordable Care Act or by the American Academy of Pediatrics were used to identify primary care services. A list of these codes can be found in Appendix A.
Patients were attributed to either a FQHC or non-FQHC organization based on where they received the plurality of their primary care each year (determined by billing provider NPI). Attributing patients to practices based on where they received the plurality of primary care services has been utilized in previous research19,42 and by the Centers for Medicare & Medicaid Services for Accountable Care Organizations.44 If patients had the same number of primary care visits to more than one primary care organization, patients were attributed to the organization with the latest visit chronologically in that calendar year.44 Patients without a primary care visit during the calendar year were assigned to the organization where they received the plurality of primary care services the previous year. (No observations were dropped because of a lack of a primary care visit in the current or prior year.) Attributing patients to a specific organization reflects the value of having a regular source of care for patients with chronic conditions;45,46 the place where patients receive most of their primary care should have the greatest influence on their outcomes.
FQHC Look-Alikes, a sub-category of FQHCs, were not eligible organizations for patient attribution because these organizations are sufficiently different from both federally-funded FQHCs and non-FQHC practices. Unlike grant-funded FQHCs, FQHC Look-Alikes do not receive federal grant dollars to support care for the uninsured and often serve a greater proportion of publicly- or privately-insured patients. They are sufficiently different from non-FQHC private practices because they receive additional resources and technical support from state Primary Care Associations. Only two FQHC Look-Alikes existed in North Carolina during the study period.
plurality of primary care services. Covariates that depended on practice attribution (e.g., continuity of care, number of Medicaid-insured children with asthma served) were recalibrated using the CCNC medical home practice.
An additional sensitivity analysis attributed patients to a practice type – FQHC or non-FQHC – instead of a specific practice. The attribution was based on whether the patients ever used an FQHC for primary care in the analysis year, the weakest definition for being an FQHC patient. A final sensitivity analysis utilized a lagged attribution in which hospital utilization was estimated using the prior year’s attribution to a FQHC or non-FQHC organization; this method excludes the first year of claims data (2013). We also applied a lag to the instrumental and organization-level variables for this analysis. This lagged analysis was based on the assumption that the prior year’s source of care might better explain the current year’s hospital utilization.
For each of the four sensitivity analyses modifying the outcome definition and method of patient attribution, we compared the 95% confidence intervals around the estimated average differential effect of FQHC use to determine whether there were meaningful differences across the various model specifications.
Patient selection into the FQHC is likely endogenous – unobserved variables affect both whether a patient utilizes an FQHC and preventable hospital utilization rates. We applied an instrumental variable, distance from the centroid of a patient’s zip code to the nearest FQHC medical care delivery site (based on mailing address), to account for patient selection into an FQHC practice. Distance from patient zip code to the nearest FQHC has been used
successfully as an instrument in previous research.18
between rural residence and specialty provider utilization, total number of primary care visits to any provider, the number of comorbidities identified using the Agency for Healthcare Research and Quality’s Chronic Condition Indicator (CCI)47, and continuity of care as defined by Breslau and Reeb’s Usual Provider of Care measure.48
We include a binary indicator for whether the patient utilized specialty care for asthma in a calendar year because FQHC patients are known to have limited access to specialty care.49 The CCI defines chronic conditions as lasting 12 months or more and associated with either limitations to self-care or ongoing interventions with medical devices.47 Breslau and Reeb’s Usual Provider of Care measure was developed for a pediatric research study and is defined as the proportion of primary care visits with the attributed organization in a calendar year.
Sensitivity analyses varied both the measure of patient acuity and the continuity of care definition. Measuring patient acuity in a pediatric population is complicated by relatively low morbidity and mortality rates, utilization of non-traditional health care sites like school-based health clinics, and different application of diagnoses, drugs and procedures in pediatric populations than adult populations.50 Therefore, it was important to test for the robustness of results under different measures of patient acuity. As an alternative specification for patient acuity, Clinical Classification Software (CCS) diagnosis groups associated with the following asthma comorbidities were included in regression models as individual dummy variables: obesity (CCS 3 - Endocrine; Nutritional; and Metabolic Diseases And Immunity Disorders), mental illness (CCS 5 – Mental Illness), and atopic dermatitis (CCS 12 – Skin and
Subcutaneous Tissue Infections).47,51 Including the CCS category inclusive of allergic reactions (CCS 17 - Symptoms; signs; and ill-defined conditions and factors influencing health status), another co-occurring condition complicating asthma management,52 created problems with model convergence.
whether patients had at least one primary care visit every six months to their current-year attributed provider to align with the American Academy of Pediatrics’ recommendation for visit frequency for children with controlled asthma.54 The first visit served as the index visit. The models applying this modified Wolinsky Continuity measure also included a variable measuring the number of months enrolled in Medicaid over a two-year period.
We also ran models without the utilization covariates – any specialty provider utilization for asthma in the calendar year and total number of primary care visits in the calendar year – and found qualitatively similar results to the main model specification in effect size, direction and significance.
Using the patient’s modal county of residence – where the patient lived for most of the calendar year – we included several county-level measures to account for area-level influences on health: the percent of population living below the federal poverty line, median household income and air quality measured as fine particulate matter concentration (annual PM2.5 level). Poverty and income data were from the U.S. Census Bureau’s Small Area Income and Poverty Estimates, and air quality data were from the CDC’s National Environmental Public Health Tracking Network. The percent of the population living below the federal poverty line has been found to be a valid proxy for area-level socioeconomic deprivation.55,56 The county-level air pollution measure adjusted for area-level environmental factors affecting hospital utilization. Maps from the NC Rural Health Research Program suggested area-level variation in ambulatory sensitive hospital admissions for asthma.57 Hereafter, these covariates are referred to under the larger umbrella of patient-level characteristics.
number of Medicaid patients with asthma served by the practice relative to other organizations in a given year.) Models also included year fixed effects to account for secular time trends. Analytic Approach
Unadjusted differences between FQHC and non-FQHC patients were examined using chi-square tests for categorical and binary variables and t-tests for continuous variables. We estimated multivariate regression models using generalized linear models (GLM) with a binomial family and a logit link given the distribution of the outcome variables. We explored using generalized estimating equations to account for the correlation of observations for the same patient across analysis years (n<=3); however, an independent correlation structure was associated with the lowest quasi-likelihood under the independence model criterion (QIC) and thus the best-fitting model. Because an independent correlation structure is equivalent to a pooled model, we applied GLMs. Differences in average marginal effects between GLM and GEE models ranged between 0.02- 0.4 percentage points, which translated to an average hospital utilization rate of 8.18-8.20% with a principal diagnosis of asthma and an average hospital utilization rate of 22.8%-23.2% with any diagnosis of asthma.
We assessed model specification by adding one additional quadratic term at a time to the models and examining the z-statistic on the quadratic term to determine statistical
significance. These tests indicated the following quadratic terms were significant (p<.05) and therefore should be included in the models: quadratic terms for age, continuity of care, percent of county living in poverty and county median household income.
Using 2SRI, the endogenous FQHC indicator was regressed on the instrumental variable – distance from the centroid of the patient’s zip code to the nearest FQHC – and the other covariates. This first-stage regression is specified below:
Pr (%&'()*+= 1) = / + 123456789:)++ 1;<764:86)+ + 1=>?@784A764B8*++ 1CD:7?++ E)*+
where Distance represents the instrumental variable, Patient represents the series of patient-level covariates, Organization represents organization-patient-level covariates, and Year represents year fixed effects. We estimated Pearson residuals after this first-stage model and included the residuals (Stage1residuals) in the second-stage outcome estimation model to control for the endogeneity of patient selection into the FQHC. After bivariate probit, 2SRI with Pearson residuals has the lowest bias in average treatment effect estimates in samples with similar treatment and outcome rates.58 The second-stage regression model is specified below:
Pr (D)*+ = 1) = / + 12%&'()++ 1;F67@:1?:54GH7I5)*++ 1=<764:86)++ 1C>?@784A764B8*+
+ 1JD:7?++ E)*+
where D)*+ is the patient-level outcome variable (person-year hospital or ED utilization) and %&'()+ indicated whether the patient received the majority of primary care services in an FQHC.
Instrumental variable tests for endogeneity and strength passed accepted thresholds: Durbin-Wu-Hausman tests for endogeneity59 using a linear model specification rejected exogeneity of the FQHC variable in all models (p<.001 for models predicting any hospital utilization and ED utilization with a principal diagnosis of asthma; p<.05 for any hospital
utilization with any diagnosis of asthma and ED utilization with any diagnosis of asthma.) After a logistic regression, distance to the nearest FQHC was associated with a Wald statistic of over 5700 (p<.001); the strength of the instrument far exceeded the recommended statistic of 10.60
Bootstrapped standard errors were clustered at the patient-level to account for repeated observations across analysis years. All analyses were performed using Stata version 13.0.
Results
Table 2.1 highlights descriptive statistics for the final analysis sample. Roughly 6% of the total sample population were attributed to an FQHC organization using the plurality of primary care services rule. Bivariate comparisons revealed marked differences between FQHC and non-FQHC patients (Table 2.1). non-FQHC patients were more likely to go to the hospital for asthma, more likely to represent racial/ethnicity minorities and were less likely to utilize specialty providers for asthma. FQHC patients had fewer primary care visits than non-FQHC patients, fewer chronic conditions, and lived in communities with higher poverty rates and lower median household income. Bivariate comparisons indicated slightly better continuity of care for FQHC patients compared to non-FQHC patients (p<.001).
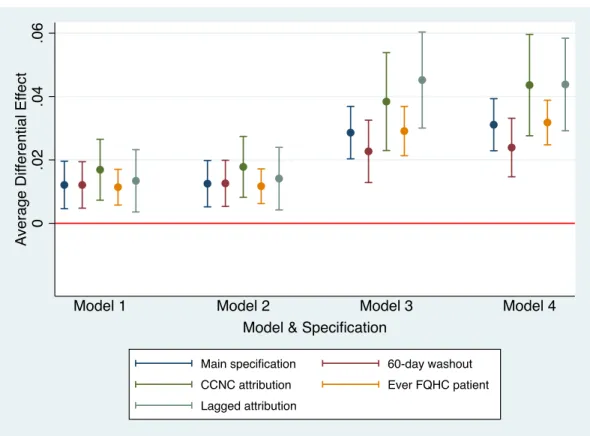
Average marginal effects with bootstrapped standard errors are presented in Table 2.2 for the main model specification. Sensitivity analysis results are reported in Appendix B. Across all outcome definitions and model specifications, FQHC patients were more likely to utilize the hospital for asthma even after controlling for selection bias. Figure 2.1 highlights the differential effect estimates and 95% confidence intervals for each of the model specifications.
The effect size was greater for the models predicting hospital utilization with any diagnosis of asthma: FQHC patients were 2.86 percentage points more likely to go to the hospital for any reason (p<.001) and 3.11 percentage points more likely to utilize the ED
(p<.001). These increases translate to a hospital utilization rate of 26.1% relative to the baseline rate of 23.2% and an ED utilization rate of 24.1% relative to the baseline rate of 21.0%. It is worth noting that ED use comprised the majority of hospital utilization in this analysis sample, which is evident in the qualitatively similar average differential effects of FQHC use across the models estimating any hospital use and ED use (Model 1 compared to Model 2 and Model 3 compared to Model 4).
Even after applying a 60-day washout period to hospital utilization, the differential effect of being an FQHC patient was still associated with a higher predicted probability of hospital utilization, though the difference between FQHC and non-FQHC patients was smaller relative to the main models predicting hospital utilization with any diagnosis of asthma. (The differential effects were virtually the same in the models predicting hospital use with a principal diagnosis of asthma.) These results are presented in Table B.2 in Appendix B.
Patient attribution robustness checks. To determine whether the results were robust to different methods of patient attribution, we ran models in which attribution was based on CCNC medical home payment – the practice receiving the per member per month payment to manage the care of the patient – as well as models where patients were attributed to FQHCs if they ever visited an FQHC for primary care in the analysis year. These models produced results similar to the primary analyses in direction and significance, though the effect size associated with FQHC use was larger in the CCNC-based attribution models and variable according to principal versus any diagnosis of asthma in the ever-FQHC attribution models. The results are presented in Tables B.3 and B.4 in Appendix B.
In the models for which preventable hospital utilization was estimated as a function of the prior year’s FQHC/non-FQHC attribution, the differential effect of being an FQHC patient on hospital use was 0.2-1.4 percentage points higher in the lagged models than the un-lagged models run on the same analysis sample with 2013 excluded (Tables B.5 and B.6 in Appendix B). A summary table (Table B.1) containing the differential effect of being an FQHC patient from all model specifications is included in Appendix B.
Other sensitivity analyses. The results were robust to different specifications for the number of Medicaid-insured children with asthma served in each attributed provider
Discussion
Across all outcome definitions and model specifications, FQHC patients in North Carolina were more likely to utilize the hospital for asthma even after controlling for patient selection into FQHCs and other patient characteristics. Differences across model specifications were not meaningful; Figure 2.1 highlights the average differential effect estimates and
overlapping 95% confidence intervals for each of these model specifications. These results suggest that there may be unmeasured patient-, organization- or community-level factors increasing the probability that FQHC patients use the hospital compared to patients accessing primary care from non-FQHC organizations.
This study’s findings are in contrast to previous research that found FQHC patients had lower overall hospital utilization relative to patients utilizing other primary care practices.7,16,43 Few of these earlier studies examined hospital utilization among Medicaid-insured children, however, which could explain the divergent findings. In particular, the magnitude of the FQHC effect is largely driven by ED utilization, as children rarely have inpatient stays associated with asthma. Furthermore, North Carolina’s Community Care of North Carolina (CCNC) primary care case management and medical home model may contribute to better performance among non-FQHC providers in the state, reducing the magnitude of the effect of non-FQHCs in this patient population. CCNC deploys local case management and care coordination strategies for select patient populations and has reduced hospital utilization, lowered costs and improved health outcomes.61 Relative to Medicaid managed care enrollees in other states, more CCNC enrollees had better process and outcome measures for chronic disease management for diabetes, hypertension, asthma and cardiovascular disease.62 Pediatric asthma has been a targeted condition for intervention through CCNC,63,64 which may have helped improve quality of care among all providers and reduced the effect of FQHCs documented in other states.
hospital utilization among dual-eligible patients, FQHC use was associated with decreases in any inpatient hospitalization but increases in ED utilization.15,16,65 Although their study focused on spending, Bruen and colleagues17 applied inverse propensity weights and found that children utilizing FQHCs had significantly lower overall health care spending than similar children
utilizing other primary care providers except for ED spending; ED spending for children utilizing FQHCs was no different than the spending for similar children utilizing other primary care practices.
Greater ED utilization among FQHC patients may be driven by appointment availability, clinic accessibility66 or availability of other non-hospital-based urgent care resources in the community. A study of FQHC access in California found increased geographic density of
FQHCs was associated with significant decreases in ED utilization among Medicaid-insured and uninsured children.12 Non-hospital-based urgent care centers are more prevalent in higher-income communities67 where FQHCs are less likely to be located, which could limit access to non-hospital urgent care for patients in FQHC service areas.
It is important to note that FQHCs’ quality of care may have declined during the analysis years because 2013-2015 also represented a period of tremendous growth and organizational change in the FQHC program: With funding allocated in the Patient Protection & Affordable Care Act of 2010,68 six new FQHC organizations (“new start” organizations) were established and 23 new clinic sites were added to existing FQHC organizations in North Carolina from 2013-2015.69,70 Interestingly, the year fixed effects suggest that the likelihood of preventable hospital use declined in 2014 and 2015 relative to 2013 for the entire sample.
Limitations