NUMERICAL STUDY OF THE EFFECT OF SEA SURFACE
TEMPERATURE PERTURBATIONS ON A DESERT
DEPRESSION
Said. M. K
Egyptian Atomic Energy Authority, NCRRT, Protection and Radiation doses Department, Cairo,
Egypt
H. Abdel Basset
Astronomy and Meteorology Department,
Faculty of Science, Al-Azhar University, Cairo, Egypt
M. Abdel Wahab
Astronomy and Meteorology Department,
Faculty of Science, Cairo University, Giza, Egypt
A. A. Abdallah
Astronomy and Meteorology Department,
Faculty of Science, Al-Azhar University, Cairo, Egypt
ABSTRACT
This work aimed to investigate the effect of the perturbations in Mediterranean Sea surface temperature (SST) on the development and track of a desert depression which occurred on 22 to 25 March 2003. The desert depression formed over Algeria in the lee of the Atlas Mountains on 22/00 March in response to midlatitude trough intrusion. It migrated eastward with a high speed and reached Egypt 24/12 March before exiting the northeast African continent toward eastern Mediterranean Sea on 25/12 March. The horizontal scale of the cyclone at the surface varied between 800 and 1000 km during its lifetime, while on the vertical the cyclone extended over 8 km. The cyclone was characterized by a surface pressure anomaly of about 9 hPa with respect to the environment, a pronounced rise of temperature (about 8o C above normal), and strong southerly surface wind that cause rising sand and sand storm over North Africa. Ten simulations in this study are conducted using the Weather Research and Forecasting coupled with Chemistry Model (WRF-Chem) to explain the Sensitivity of our depression to perturbations in Mediterranean SST. The simulations conclude that the model was able to reasonably reproduce the structure, lifetime, and trajectory of the cyclone. Also, it’s found that a warmer sea increases the surface latent heat fluxes and the upward moisture, favoring development of convection in the storm. The dust was transported all around the cyclone leaving a clear eye at its center and was lofted to altitudes as high as 7 km, becoming subject to long-range transport.
Keywords
WRF-Chem, Desert depression, Mediterranean Sea surface temperature, structure of the desert depression, lifetime of the desert depression, trajectory of the desert depression, dust transported in the desert depression.
1.
INTRODUCTION
meteorologists in terms of its general characteristics, origin and development. The phenomenon in question most frequently appears as a strong southerly (or southeasterly), hot, dry and dust laden wind causing occasional severe sandstorms over North African countries [1][2][3]. In the meteorological literature, this wind is usually referred to as chili in western Arab countries, Gibli in Libya and Khamsin in Egypt [1]. North Africa is the world’s most important dust source area [4]; providing an estimated dust production of 50% of the global annual total [5][6]. For Saharan dust emission, numerous atmospheric processes on synoptic, regional and local scales provide the meteorological conditions suitable for dust mobilization over areas rich in deflectable sediments [7].
Dust storms have been documented to be associated with high near surface wind speeds resulting from the downward mixing of momentum from the nocturnal low level jets (LLJs) [8][9][10][11]. Dust emission over the Sahara has also been shown to be connected with the low‐level dynamics associated with the penetration of an upper level trough to low latitudes [12][13][14][15]. Furthermore, heavy dust storms over North Africa, especially in winter and spring time, have been reported to be associated with Saharan depressions [11][16][17][18][19]. The development of these Saharan depressions, mostly in the lee of the Atlas Mountains, is favored by the strengthening of the meridional temperature gradient over northern Africa in this time of the year. They frequently bring strong winds and sandstorms [18], with dust transported over long distances, affecting the Mediterranean Basin [20]. [21] have noted that the most Saharan dust transport toward Europe occurs in spring and is caused by intense cyclones traveling eastward that pass the North African coast of the Mediterranean.
There is a lot of literature on the impact of SST on tropical storms [22], however the effects of SST on extra-tropical cyclones have been the object of only a few case studies [23][24]. Indirect appreciation of SST impact on extra-tropical cyclone intensity can be found in a few climatological studies, where a moderate positive effect of SST on the number of intense storms is establishing [25][26][27]. [28] suggest that variability in the SST gradient can cause changes in low-level atmospheric baroclinicity that force variability in the storm tracks. In this work the impact of Mediterranean Sea surface temperature perturbations on the evolution
and track of a desert depression is analyzed by numerical simulations.
2.
EXPERIMENT DESIGN
In this study the effects of Mediterranean SST changes on the movement and development of the desert cyclone investigated. To make clear the role of SST and air–sea fluxes in the dynamics of the cyclone, ten hydrostatic synoptic simulations performed. The simulations in this study conducted by WRF-Chem Model (version 3.8.1), a control simulation (SST0) performed followed by nine other runs in which the SST increased from 1 K (SST1) to 9 K (SST9). Most of these variations may seem too large and unrealistic even in a warmer climate; however it is our intention to explore how large the effects of such SST variations might be on the development, in terms of mean sea level pressure (MSLP) and wind speeds, of a desert depression. The numerical simulations started at 00 UTC 22 March 2003. Six-hourly 0.1°x0.1º NCEP FNL analysis data provided as initial and boundary conditions. The model domain was 270×175 grid points with 30 km horizontal resolution and 31 vertical levels. The model domain chosen to limited by a box spanned between the following geographical coordinates: 30ºW, 5ºN and 60ºE, 50ºN, which covers Southern Europe with most of the North-Africa and the Western Asia (Figure 1).
3.
SYNOPTIC DISCUSSION
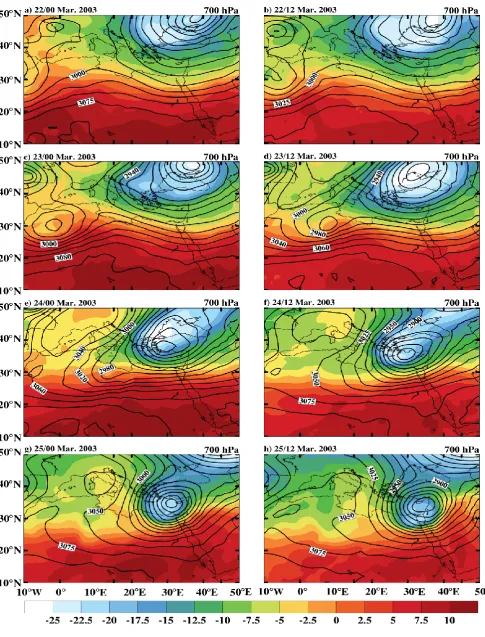
During 22 to 25 March 2003, most stations in Algeria, Libya and Egypt observed a vigorous sandstorm. On March 24/00 UTC, the surface stations in west Egypt reported the storm in this area with visibility of a few meters. The storm continued is active in Egypt until 25/12 UTC, then the visibility improved, the storm calmed down completely in 25/18 UTC March. The main synoptic feature of the surface at 22/00 March 2003 is an anticyclone centered over Europe and Mediterranean extending southerly to cover the middle and east of northern Africa (Figure 2a). An inverted weak trough on the northern west coast of Africa associated with a thermal ridge which is a part of the dominant baroclinic zone extending parallel to the southern Mediterranean coast (Figure 2a). During the next 12 hour, the short wave in the mid and lower troposphere was shifted slightly southeast ward developed (Figure 2b, 3b). By 23/00 March, this short wave trough moved eastward to become over west Libya at the surface (Figure 2c). At lower layer the differential heating associated with the southerly flow reinforces the baroclinic zone in turn. The net result is that the boundary layer air warmed and dried, while an anticyclone developed behind the depression over the Mediterranean accompanied with cold advection. Figure 2d shows that the cyclone moved eastward and affected middle and east of Libya on the 23/12 March, it elongated southwards. The cyclone started to move with speed of more than 60 km/hr south the Mediterranean coast producing a storm over the area of the north Sahara reaching west of Egypt during 24/00 March (Figure 2e). Although the center of the cyclone was over the north of Egypt and the eastern Mediterranean during the next day (25 March), a moderate sandstorm continued with a gradual decrease in its activity (Figure 2f, g). Figure 3 illustrates the horizontal distribution of geopotential height and temperature at 700 hPa from 22/00 to 25/12 March 2013. At 700 hPa, an upper trough over northwest Africa appeared as extension of the traveling depression that occurs over northeast of Mediterranean and Turkey (Figure 3a). At 22/12 March, a cut-off low formed and a well-defined cyclone becomes clear over northwest Africa. By 23/12 March the cut off low moved eastward as it is weakening. During the period 24/00 to 25/12 March the main cyclone is situated over east Mediterranean (Figure 3e-3h).
The NCEP FNL analyses enabled the description of the structure of the cyclone. They showed a desert depression of a horizontal scale at the surface of 800–1000 km with a vertical extent of 8 km in altitude and a surface pressure anomaly of 9 hPa. Its warm front was marked at the surface by an increase in temperature of 5°C; its cold front was typified at the surface by a drop in temperature of 8°C and an increase in 10 m wind speed of 15 m s−1.
4.
RESULTS AND DISCUSSIONS
Please use a 9-point Times Roman font, or other Roman font with serifs, as close as possible in appearance to Times Roman in which these guidelines have been set. The goal is to have a 9-point text, as you see here. Please use sans-serif or non-proportional fonts only for special purposes, such as distinguishing source code text. If Times Roman is not available, try the font named Computer Modern Roman. On a Macintosh, use the font named Times. Right margins should be justified, not ragged.
4.1
The Control Experiment (SST0)
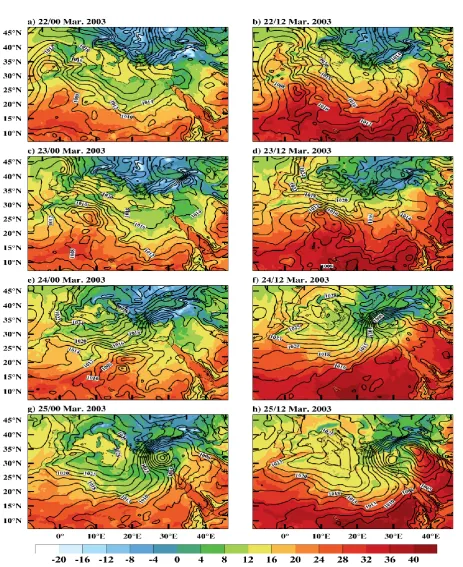
Fig.4: The horizontal distribution of Mean Sea Level Pressure and temperature (color) for control simulation during the period 22/00 to 25/12 March 2003.
4.2
Role of SST on Storm Evolution
The simulated mean sea level pressure, dust concentration and wind speeds compared as functions of SST as well as the modeled surface latent heat and moisture convergence. This comparison covers the first 72 hours of the storm evolution, until the cyclone was over Egypt. The domain of calculations has 24×43 grid points covering the center of the cyclone throughout its live cycle.
4.2.1 Pressure, 10 m Wind Speed: Sensitivity to SST
runs during the period from 22/00 UTC up to 24/18 UTC. A small difference of minimum MSLP appears with the beginning of 25/00 UTC at the end of the period of our study. Figure 7 illustrates the track of our cyclone for SST0 and SST9. It is obvious that the cyclone have the same track for SST0 and SST9 during the period from 22/00 UTC to 25/12 UTC, which means that there is no difference in the central pressure and track of the cyclone where it moves over the desert.
Fig.5: Minimum of MSLP [hPa] over area cyclone active as a function of SST anomaly.
Fig.6: Maximum of 10 m wind speed (ms-1) over area cyclone active as a function of SST anomaly.
Fig.7: cyclone track for control experiment SST0 and SST9.
994 996 998 1000 1002 1004 1006 1008
Min
.
Valu
es
o
f
MSL
P
ress
u
re
(h
p
a)
UTC TIME (dd/hh) March, 2003
Figure 6 shows the maximum values of wind speed at 10 m over the cyclone area for the control run (SST0) and SST9 experiments during the period of study. Generally, the maximum values of wind speed increase when the center of the cyclone approaching the south coast of Mediterranean, while it decrease when the center of the cyclone move away the Mediterranean coast. When the cyclone approaching the Mediterranean the gradient of pressure and temperature increase causing increase of the surface wind. So, the higher increase of maximum wind appears during the end period when the cyclone becomes over the northeast of the Mediterranean. However, the impact of SST on maximum wind speed is not significant during the period from 22/00 to 23/18, a small differences of maximum wind speeds appears from 24/00 to the end of study.
4.2.2 Surface latent heat flux
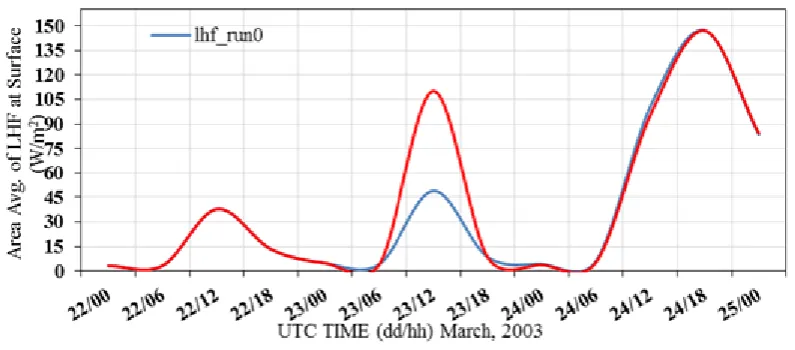
Air-sea interaction has long been recognized as one of the factors leading to explosive cyclones. The seas provided heat, through sensible and latent surface heat fluxes, and water vapour through the evaporation and convergence of moisture. Evaporation associated with positive surface latent heat flux, i.e. the sea provides energy to the atmosphere. Figure 8 illustrate the area average of the surface latent heat fluxes, the average was obtained over a varied box (24×43 grid points) covering the central area of our cyclone during the period of study. Figure 8 shows that there is no difference of LHF for simulations SST0 and SST9 during the period from 22/00 to 23/06. A considerable difference appears between 23/06 and 23/18 with a highest value at 23/12, the difference reaches about 60W/m2.
Fig.8: Area average of latent heat flux at surface for simulations SST0 and SST9.
Figure 9 illustrates the horizontal distribution of the surface latent heat fluxes for simulations SST0 and SST9 at 23/12 UTC. It is clear that, the surface latent heat fluxes in the control simulation are less than that corresponding of SST9 experiment (Figure 9a, b). The higher values of surface latent heat fluxes of simulation SST9 appears in the region of the cold air outbreak over the Mediterranean Sea and south of Europe. The larger the SST anomalies, the higher the surface latent heat fluxes, an unsurprising result, not only because of a warmer sea, but also because of the deeper cyclone and higher wind speed, after that cyclone move fare away from coastal line to south so again there is no significant difference of LHF between the two simulations (SST0 and SST9) occurs.
4.2.3 Surface Heat Flux
It is known that the main features of our desert depression are very hot weather, dry and strong southwesterly winds tends to occur over northern Africa and passes over a strong baroclinic zone extending from west to east parallel to the southern Mediterranean coast. Figure 7 illustrates the track of our cyclone for SST0 and SST9. It is found that the cyclone have the same track for SST0 and SST9 during the period from 22/00 UTC to 24/12 UTC, which means that there is no difference in the central pressure and track of the cyclone where it moves over the desert . Also, we found that the difference in the track of the cyclone occurs and becomes significant during the period from 25/00 UTC to 25/12 UTC, where the track of SST9 during this period becomes over the Mediterranean Sea. The above discussion indicate why the differences in heat flux at surface (over varied grid point box covered cyclone activity area) for simulations SST0 and SST9 appears during the period 24/12 UTC to 25/12 UTC (Figure 10) are small.
Fig.10: Area average of surface heat flux for simulations SST0 and SST9.
4.2.4 Surface MoistureFlux
The track of our cyclone (Figure 7) illustrates that, it moves over the desert of North Africa throughout the period of study except at 25/00 UTC. Figure 11 shows the area average of the surface upward moisture flux throughout the period of study. Obviously, there is no considerable difference of the surface upward moisture flux between the two simulations (SST0, SST9) during the period of study except at 25/00 UTC where the cyclone becomes over east of Mediterranean. It is clear that once more vapour reaches the atmosphere it contributes to the adiabatic processes that play an important role in increasing the surface upward moisture flux in the last time (25/00 UTC).
Fig. 11: Area average of upward moisture flux at surface.
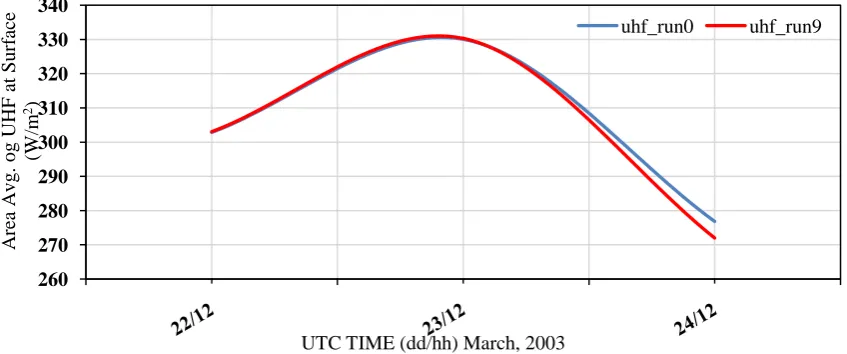
260 270 280 290 300 310 320 330 340 A rea A v g . o g UHF at Su rf ac e (W /m 2)
UTC TIME (dd/hh) March, 2003
uhf_run0 uhf_run9 0 10 20 30 40 50 60 70 80 A re a A v g . o f UMF a t S u rf ac e (Kg .m -2 .s -1)
4.2.5 Dust Concentration
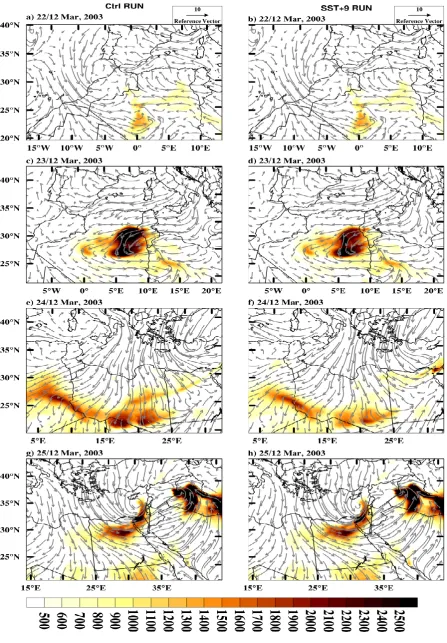
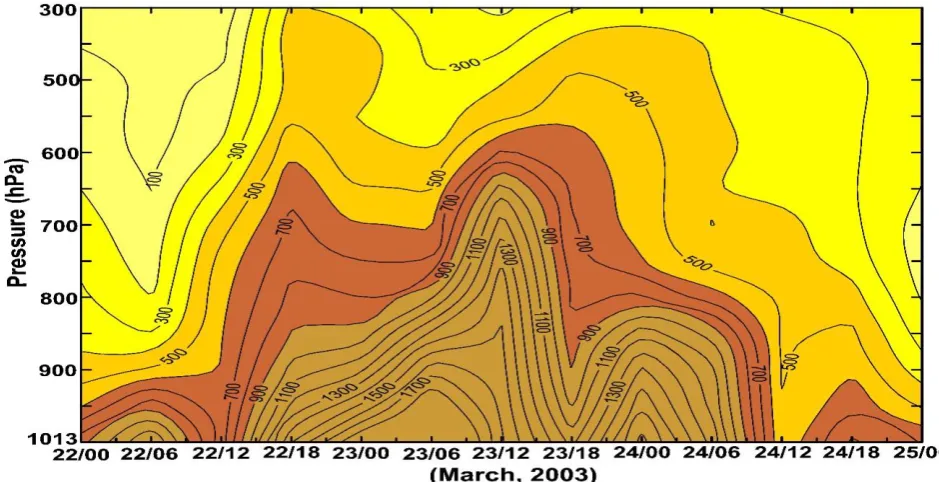
This situation was typically dust storm weather case at early spring season. Also, here the model experiments are carried out using WRF-Chem Model version 3.8.1, which able to predict dust transport along with the meteorology. We will focus only on the simulation of dust particles, five discrete size bins of dust particles were considered, with idealized spherical shapes whose radii range from 0.1 to 8.0 μm. The five dust bins in the model are 0.5:1, 1.4:2, 2.4:3, 4:4.5 and 5:8.0 μm, with corresponding effective radii of 0.5, 1.4, 2.4, 4.5, and 8.0 μm for SST0 and SST9 simulations. Figures 12 display the horizontal distribution of dust concentration, the wind speed and direction associated with the cyclone development at only four times for each simulation (22, 23, 14 and 25 March at 1200 UTC). Generally, the patterns of dust concentration for the two simulations during the four times are similar. Also, the shape of dust of the two simulations at different times is nearly similar to the corresponding synoptic pattern that was affected by the wind field which has a dynamical role in the movement and distribution of dust. Figure 13 illustrates the time height variation of the area average of dust concentration throughout the period of study. Generally, it shows that the lowest values of dust concentration occurs at the cyclone formation (22/06 and 22/12 UTC) and when the cyclone becomes over the Mediterranean (24/12 to 25/00). The higher values of dust concentration appears in association the period of cyclone activity from 22/12 to 24/06 UTC.
On 22/00 March when the center of the cyclone was formed over south western Algeria, the greater part of southern and eastern Algeria as well as western Libya was covered by a heavy dusty layer which was uplifted previously at the beginning of cyclogenesis (Figure 12). Figure 13 shows a considerable amount of dust located in the lower troposphere below 900 hPa; the dust was present within the convergence area between a relatively cold air mass from west and northwest of the cyclone with the south and southeast warm air. The dusty layer seemed to be well mixed through 1.5 km in altitude due to the turbulence associated with the cyclone cold front. To the north west of the dust plume, sparse clouds at 8 km above the surface, corresponding to the western edge of the cyclone associated cloud cover (not shown).
The cyclone moved eastward to become located over west Algeria, Tunisia and western Libya in 23/00 March (Figure 2c), its dense cloud band reached south of 30oN. The strong winds associated the cold front provided the dynamical forcing to lift large amount of dust over west Algeria, Tunisia and west Libya. High dust load was transported within the northern branch of the cyclone associated with the strong south and southwesterly winds of the western edge of the cyclone (figure 13). During 23/00 to 24/18 March (Figure 13), the highest layer of dust concentration was between the ground and 2.5 Km in altitude. Further north, a heavy dust layer extended from the ground to 3 km in altitude between 26°N and 33°N. In this region, where strong turbulent mixing associated with the cyclone cold front is expected, vertical mixing of dust was apparent (Figure 13). Furthermore, a layer of lesser dust content associated with the region near the cyclone center was observed between 3 and 7 Km in altitude where strong upward motion is present (Figures 13).
Fig. 13: Time height cross section of dust concentration over model levels for SST0 simulation.
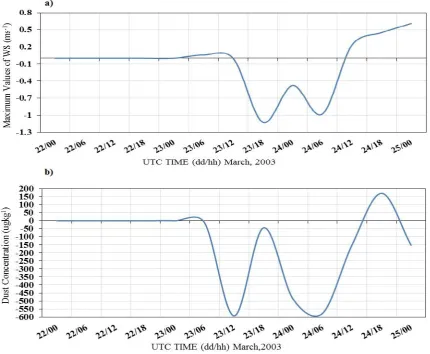
25/00 March, as the cyclone continued to move northeast ward over the eastern Mediterranean sea, the dust front was advected over northeast of Egypt and east Mediterranean (Figure 12g). The vertical advection of dust decreased during the period from 24/12 to 25/00 (Figure 13) and the cyclone becomes out the area of our interest. Figure 14a illustrates the difference of Max 10m wind speed for SST9 from SST0, while figure 14b shows the difference of dust concentration of SST9 from SST0. It’s clear that the amount of dust concentration of SST0 is less than those corresponding of SST9 during the period from 23/06 to 24/18, which is due to the increase of wind speed in SST9 than in SST0 during this period (Figure 14a).
Fig. 14: a) The difference of Max 10m wind speed for SST9 from SST0 b) The difference of Dust Concentration for SST9 from SST0.
5.
DISCUSSION AND CONCLUSIONS
In this paper, the sensitivity of a desert depression to the perturbations in Mediterranean Sea surface temperature (SST) was studied by mean of limited area model initialized by NCEP FNL analysis. Ten simulations were performed, the first simulation with NCEP FNL RTG_SST field (SST0) and nine other simulations using SST analysis raised by 1 to 9 K. In all of the experiments, the perturbations to the SST changed the land–sea temperature gradients along the coast. However, these gradients did not affect the storms studied here, because they were too far from the coast. If the storms had traveled closer to the coastline, it is likely that the land–sea contrast created by our SST perturbations would have affected the results. This might also have been the case for a storm that took place in spring, when the land–sea contrast is greater. For our storms, however, the monotonic response to the perturbation amplitude suggests that the storm behavior is realistic, and not the result of unrealistic land–sea baroclinicity, or numerical noise associated with a sudden SST or flux change (as discussed in [25]).
The dust activity accompanying our desert depression over North Africa has been investigated. The development of the cyclone was favored by strong meridional temperature gradient and initiated this region of strong low level baroclinity on the lee side of the Atlas Mountains. The cyclone and its associated cold front were the major dynamic features that mobilized and transported the dust during this event. Important dust emissions occurred as the cyclone cold front and their associated strong surface winds (∼25 m s−1) cross over Algeria, Libya and Egypt. Dust emission was then followed by an upward mixing to high altitudes (∼3 km) and by a cyclonic transport all around the eye of the cyclone. During its movement across the continent, the cyclone continued to produce dust locally in addition to the transported dust air masses. The dust storm was associated with dramatic visibility conditions with 0 km visibility rates at different locations and for more than 1 day. The mean dust loads over the cyclone area were simulated during the study period. This represents a large amount of dust compared to what was discussed in previous studies concerned with dust emissions [30][31][32][33]. Hence, Saharan cyclones may contribute significantly to the total dust load over West and North Africa observed annually.
6.
REFERENCES
[1] EL-Fandy, M.G., 1940. The formation of the depression of the Khamsin type. Q. J. R. Meteorol. Soc., 66, 323-335.
[2] EL-Tantawy AI; 1964. The role of jet stream in the formation of desert depression in the Middle East. WMO, Tech.Note 64, 159-171.
[3] EL-Tantawy AI; 1969. On the cyclogenesis and structure of spring desert depressions in subtropical Africa, Meteorol Res Bull 69: 68-107, Dep of Meteorol, United Arab Republic, Cairo.
[4] Prospero, J. M., P. Ginoux, O. Torres, S. E. Nicholson, and T. E. Gill (2002), Environmental characterization of global sources of atmospheric soil dust identified with the Nimbus 7 Total Ozone Mapping Spectrometer (TOMS) absorbing aerosol product, Rev. Geophys., 40(1), 1002, doi:10.1029/2000RG000095.
[5] Engelstaedter, S., I. Tegen, and R. Washington (2006), North African dust emissions and transport, Earth Sci. Rev., 79, 73–100, doi:10.1016/j.earscirev. 2006.06.004.
[6] Laurent, B., B. Marticorena, G. Bergametti, J. F. Léon, and N. M. Mahowald (2008), Modeling mineral dust emissions from the Sahara desert using new surface properties and soil database, J. Geophys. Res., 113, D14218, doi:10.1029/2007JD009484.
[7] Péwé, T. L. (1981), Desert dust: An overview, Spec. Paper Geol. Soc. Am., 186, 1–10.
[8] Washington, R., and M. C. Todd (2005), Atmospheric controls on mineral dust emission from the Bodélé Depression, Chad: The role of the low-level jet, Geophys. Res. Lett., 32, L17701, doi:10.1029/ 2005 GL023597.
[9] Todd, M. C., R. Washington, S. Raghavan, G. Lizcano, and P. Knippertz (2008a), Regional model simulations of the Bodélé low‐level jet of northern Chad during the Bodélé Dust Experiment (BoDEx 2005), J. Clim., 21, 995–1012, doi:10.1175/2007JCLI1766.1
[10]Knippertz, P. (2008), Dust emissions in the West African heat trough: The role of the diurnal cycle and of extratropical disturbances, Meteorol. Z., 17, 553–563, doi:10.1127/0941-2948/2008/0315.
[11]Schepanski, K., et al. (2009), Meteorological processes forcing Saharan dust emission inferred from MSG‐SEVIRI observations of sub‐daily dust source activation and numerical models, J. Geophys. Res., 114, D10201, doi:10.1029/2008JD010325.
[12]Jankowiak, I., and D. Tanré (1992), Satellite climatology of Saharan dust outbreaks: Method and preliminary results, J. Clim., 5, 646–656, doi:10.1175/1520-0442(1992)005<0646:SCOSDO>2.0.CO;2.
[13]Knippertz, P., and A. H. Fink (2006), Synoptic and dynamic aspects of an extreme springtime Saharan dust outbreak, Q. J. R. Meteorol. Soc., 132, 1153–1177, doi:10.1256/qj.05.109.
[14]Tulet, P., M. Mallet, V. Pont, J. Pelon, A. Boone (2008), The 7–13 March 2006 dust storm over West Africa: Generation, transport and vertical stratification, J. Geophys. Res., 113, D00C08, doi:10.1029/ 2008JD009871.
[15]Cavazos, C., M. C. Todd, and K. Schepanski (2009), Numerical model simulation of the Saharan dust event of 6–11 March 2006 using the Regional Climate Model version 3 (RegCM3), J. Geophys. Res., 114, D12109, doi:10.1029/2008JD011078.
[16]Lee, I. Y. (1983), Simulation of transport and removal processes of the Saharan dust, J. Clim. Appl. Meteorol., 22, 632–639, doi:10.1175/ 1520-0450(1983)022<0632:SOTARP>2.0.CO;2.
[17]Westphal, D. L., O. B. Toon, and T. N. Carlson (1985), A numerical investigation of Saharan dust storms, Ph. D. thesis, Penn. State Univ., Univ. Park.
[18]Alpert, P., and B. Ziv (1989), The Sharav cyclone: Observations and some theoretical considerations, J. Geophys. Res., 94, 18,495–18,514, doi:10.1029/JD094iD15p18495.
[19]Abdel Basset. H., 2001: Energy conversion of a desert depression. Meteorol. Atmos. Phys. 76, 203-222.
[21]Barkan, J., P. Alpert, H. Kutiel, and P. Kishcha (2005), Synoptics of dust transportation day from Africa toward Italy and central Europe, J. Geophys. Res., 110, D07208, doi:10.1029/2004JD005222.
[22]Emanuel, K., 2005. Increasing destructiveness of tropical cyclones over the past 30 years, Nature, 436, 686- 688.
[23]Booth, J.F., L. Thompson, J. Patoux and A.K. Kathryn., 2012. Sensitivity of midlatitude storm intensification to perturbations in the sea surface temperature near the Gulf Stream, Mon. Wea.Rev., 140, 12411256.
[24]Ludwig, P., J.G. Pinto, M. Reyers and S.L. Gray (2014).The role of anomalous SST and surface fluxes over the southeastern North Atlantic in the explosive development of windstorm Xynthia, Q. J. Roy. Meteor.Soc., 140, 1729-1741.
[25]Semmler, T., S. Varghese, R. McGrath, P. Nolan, S. Wang, P. Lynch and C. O’Dowd., 2008a. Regional model simulation of North-Atlantic cyclones: present climate and response to increased sea surface temperature,J.Geophys.Res.,113,02107;doi:10.1029/2006 JD008213.
[26]Semmler, T., S. Varghese, R. McGrath, P. Nolan, S. Wang, P. Lynch and C. O’Dowd., 2008b. Regional climate model simulations of North Atlantic cyclones: frequency and intensity changes, Clim.Res. 36, 1-16.
[27]Bengtsson, L., K.I. Hodges and E. Roeckner., 2006. Storm tracks and climate change, J. Clim., 19, 3518- 3543.
[28]Nakamura, M., and S. Yamane, 2009: Dominant anomaly patterns in the near-surface baroclinicity and accompanying anomalies in the atmosphere and oceans. Part I: North Atlantic basin. J. Climate, 22, 880–904.
[29]Hoskins, B. J., M. E. McIntyre, and A. W. Robsertson (1985), On the use and significance of isentropic potential vorticity maps, Q. J. R. Meteorol. Soc., 111, 877–946, doi:10.1256/smsqj.47001.
[30]Todd, M. C., et al. (2008b), Quantifying uncertainty in estimates of mineral dust flux: An inter‐comparison of model performance over the Bodélé Depression, northern Chad, J. Geophys. Res., 113, D24107, doi:10.1029/2008JD010476.
[31]Bou Karam, D., C. Flamant, P. Knippertz, O. Reitebuch, P. Pelon, M. Chong, and A. Dabas (2008), Dust emissions over the Sahel associated with the West African Monsoon inter‐tropical discontinuity region: A representative case study, Q. J. R. Meteorol. Soc., 134, 621–634, doi:10.1002/qj.244.
[32]Bou Karam, D., C. Flamant, P. Tulet, M. C. Todd, J. Pelon, and E. Williams (2009a), Dry cyclogenesis and dust mobilization in the intertropical discontinuity of the West African Monsoon: A case study, J. Geophys. Res., 114, D05115, doi:10.1029/2008JD010952.