ISSN: 2501 - 1235 ISSN-L: 2501 - 1235 Available on-line at: www.oapub.org/edu
Copyright © The Author(s). All Rights Reserved.
doi: 10.5281/zenodo.2005549 Volume 5 │ Issue 2 │ 2018
EXAMINITATION OF THE SOME MOTORIC AND
ANTHROPOMETRIC PROPERTIES OF
PRIMARY SCHOOL STUDENTS
Esra Kurt1i,
Cemali Çankaya2,
Ramiz Arabacı2,
Tonguç Vardar2
1Physical Education Teacher,
College of Osmangazi, Bursa, Turkey
2Bursa Uludag University,
Faculty of Sport Sciences, Turkey
Abstract:
The aim of the present study was to examine some motoric and anthropometric properties of primary school students who do sport (DS) and who don’t do sports (DNS) between 6-10 years of age. The sampling of the study consisted of a total of 120 students between 6-10 years of age and who were randomly selected at the Private Osmangazi School. A total of 60 randomly selected participants only participated in physical education classes, and the other 60 students participated in a 12 week training program as 90 minutes two days a week in addition to the physical education classes. The descriptive characteristics of the students who were randomly selected in were as follows: mean age 7.3±0.7 years; height 128.7±8 cm, weight 28.9±7 kg, Body Mass Index 57.6±32.3 %, hand length 13.4±2.1 cm, and foot length 19.4±3.2 cm. Measurements of the students who do sports after 12 weeks training program were as following, mean age 7.4±0.1 years, height 128.7±9.3 cm, weight 29.1±7.9 kg, body mass index 60.3±31.4 %, hand length 13.3±2.4 cm and foot length 19.5±3.6 cm. The mean age for the students who do not do sports was mean age 7.2±0.9 years, height 128.6±8 cm, weight 28.6±7 kg, body mass index 57.9±33.3 %, hand length 13.6±1.9 cm and foot length 19.7±2.9 cm. When we examined some motoric performances, it was determined that reaction pre-test was DS - 12.10±9.67 cm and DNS - 18.86±10.05 cm; the post-pre-test was DS - 6.90±9.16 cm and DNS - 16.05±10.49 cm (F = 5.26, p<0.05), flexibility pretest was DS - 5.80±4.80 cm and DNS - 3.40±4.22 cm, posttest was DS -5.68±4.79 cm and DNS - 3.50±4.30 cm (F = 5.26, p<0.05), speed pretest was DS - 5.42±.55 sec and DNS - 6.03±.68 sec, posttest was
DS -5.24±.45 sec and DNS - 5.88±.50 sec, vertical jump pretest was DS - 18.58 ± 3.80 cm and DNS - 22.91 ± 4.93 cm, posttest was DS - 18.40±4.97 cm and DNS - 23.71 ± 5.30 cm. The statistical analyses were performed with the SPSS 21 Package Program. Student t and One-Way Anova Test (Two-Way) was applied to determine the statistical differences between the subgroups of all the variables and in the repeated measurements. The statistical significance level was accepted as p<0.05. As a result, it was determined that anthropometric development did not make any significant differences only due to sports in these age groups. Although the training program did not have any statistically significant effects on speed and vertical jumping scores, it had significant effects on reaction and flexibility.
Keywords: children, sports, physical fitness
1. Introduction
The most important purpose of societies among many other purposes is to raise mentally and psychologically healthy individuals. The continuous growth and development of children has caused that the attention has been focused on this age group. Since all development processes of children is related closely with their physical development, it is necessary that those who are interested in this subject should know their anatomical structures, their physical development stages and determine the factors that affect their development and take proper measures (Oğuz, 1998).
Children between 8-10 years of age are in the latest period of their developmental periods, and the psychomotor development periods related with sports. In terms of physical development, there are no differences between boys and girls in terms of growth patterns; in other words, it is at the lowest level. The slow change in height, weight and body structure enable children to better recognize and use their bodies; and therefore, children have great progress in the skills that require coordination and control. (Gökmen, Karagül, & Afiçı, 1995; Lıppıncott, 2000; Tekelioğlu, 1999; Zorba, 2001).
Although the growth of children depends on several factors like their genetic structures, biological clocks, nutrition and environment, it changes depending on the physical activity. It has been observed in previous studies that the children who did not participate in any sportive activities had weaker muscle structures, their heights were shorter, had a fat or weak body structure due to excessive or malnutrition, and had weaker perception and learning abilities (Açıkada, Ergen, 1990).
This study is conducted for the purpose of investigating whether there are some motoric and anthropometric properties of elementary school students between the ages 6-10 who do and do not do sports.
Our study is quite important in terms of sharing the dada on positive or negative effects of doing sports on physical and motor skills of children at school age school administrations, students and their families and trainers and monitors who provide training for the athletes in this age group.
2. Material and Method
2.1 Participants
The universe of the study consists of the students of Bursa Private Osmangazi School. The sampling of the study consisted of 60 students who were doing sports and who were selected randomly in the Private Osmangazi School; and 60 randomly selected students who were at the same age group and who did not do sports at the same school.
This study was approved by Uludağ University Clinical Research Ethics Committee on 24 October 2017 with the decision no. 2017-15 / 29. In addition, the permission of the Special Director of Osmangazi Schools was obtained before the application.
2.2 Experimental Procedure
After permission was obtained from the school administrators for the study, the students, who would be included in the study, and randomly selected by the physical education teacher and then would be informed about the study. After informing the students, 120 students who do not do sports among 300 students were selected randomly. Some motoric and anthropometric measurements were applied as pre-test to the students who were selected. While a total of 60 students who were randomly selected were not interested in any sports, the other 60 students would perform training for a 12-week period, 2 days a week, 90 minutes for the each training. The same tests were applied to these two groups for the second time after the 12-week period. Some of the Motoric Tests that were measured in a total of four different motoric tests applied were; Speed Test, Vertical Jump Test, Reaction Test and Elasticity Test, respectively. In these tests, some motor skills like promptness, general flexibility, running speed and ability to act with the whole body were measured. Some of the Anthropometric Tests measured were; five different anthropometric measurements that include age, height, weight, hand length and foot length, respectively.
2.3 Measurements
measurements like reaction, flexibility, 20-m speed and vertical jump scores, and at the end of the study period for the purpose of evaluating these scores in a total of 10 measurements.
A. Flexibility Test
The child was seated on flat floor, and the soles of the feet were made to stay flat on the test table. The body was then extended forward, and the arms and fingers were stretched and held straight for two seconds at the last point; and after two attempts, the best scores were recorded (Tamer, 2000).
B. 20-m Speed Test
A 30-m long gym was determined as the application field for the speed run test. The student was stopped in the standing position at the starting line of the 20-m; and the test manager who was standing at the starting line gave the ‚Ready? Go!‛ command. The student then ran on a straight line until exceeding the end-point at the highest possible speed. The other test manager who stands on the finish line recorded the running time between the start and finish points as seconds and split-seconds with a Casio hand stopwatch. The students were given a 2-minute resting time, and performed 2 repetitions, and the grade that was good was taken as a result (Mackenzie, 2005).
C. Hand Reaction Test
The upper part of the thumb and index finger of the student was held parallel to each other, the arms were angled 90 degrees, and the student was made to take a standing position. The tester held the test ruler at a distance of 5 cm between the student’s thumb and index fingers, and made the student to look at the concentration site directly (to the eyes of the tester. The student was told to catch the ruler when it was dropped. The student was based on the line with the little finger, and in this way, 3 attempts were made. The average score was recorded as the result. Each trial preparation was started after the command ‚Ready!‛ (Özer, 2006).
D. Vertical Jump Test
When the student faced the tester on a flat surface, the arm that was closer to the wall was raised, and the distance to the wall is taken from the longest finger (middle finger). Then, finger paint is dropped onto the middle finger of the student and s/he is asked to jump in the same position and touch the wall. The distance before and after the jump was measured by employing a ruler. This test was repeated 3 times; and the best score was recorded as the result (Özer, 2006).
E. Height and Body Weight Measurements
Body Mass Index (BMI): BMI = Weight (kg)/Height2 (m)
To determine the Body Mass Index, the Body Mass Index (BMI) formula (Body weight / Height²) was used (Mackenzie, 2005).
Hand - Feet Length Measurements:
Hand length: The measurement was made while the forearm of the student was
in the horizontal position, one end of the caliper on the styloid process of the radius and the other end was on the longest fingertip.
Foot Length: The measurement was made while the volunteer was standing, the
end of the measurement tape on the koxis and the other end on the base (Fişekçioğlu, Metin & Murat, 2008).
2.4 Statistical Analyses
The statistical analyses were performed with the SPSS 21 Package Program. Student t and One-Way Anova Test (Two-Way) was applied to determine the statistical differences between the subgroups of all the variables and in the repeated measurements. The statistical significance level was accepted as p<0.05.
3. Findings
Average values and comparison results of the measurements that applied to participants are shown in the table below.
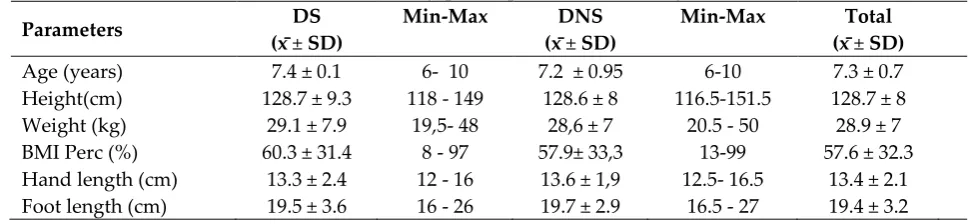
Table 1: Mean and standard deviation values of the definition properties of
female and boy participants of this study
Parameters DS
(x± SD)
Min-Max DNS
(x± SD)
Min-Max Total
(x± SD)
Age (years) 7.4 ± 0.1 6- 10 7.2 ± 0.95 6-10 7.3 ± 0.7 Height(cm) 128.7 ± 9.3 118 - 149 128.6 ± 8 116.5-151.5 128.7 ± 8 Weight (kg) 29.1 ± 7.9 19,5- 48 28,6 ± 7 20.5 - 50 28.9 ± 7 BMI Perc (%) 60.3 ± 31.4 8 - 97 57.9± 33,3 13-99 57.6 ± 32.3 Hand length (cm) 13.3 ± 2.4 12 - 16 13.6 ± 1,9 12.5- 16.5 13.4 ± 2.1 Foot length (cm) 19.5 ± 3.6 16 - 26 19.7 ± 2.9 16.5 - 27 19.4 ± 3.2 DS: Do sports, DNS: Do not sports
There are not statistically significant differences between two groups (p>0.05).
Table 2: Comparison of the motoric properties of
the primary school student who do not do sports and do sports
Parameters Groups Pre-Test Post-Test F
Reaction (cm) DS
DNS
12.10 ± 9.67 18.86 ±10.05
6.90 ± 9.16
16.05 ±10.49 5.26*
Flexibility (cm) DS DNS
5.80 ± 4.80 3.40 ± 4.22
5.68 ± 4.79 3.50 ± 4.30
Speed (sec) DS DNS
5.42 ± .55 6.03 ± .68
5.24 ± .45 5.88 ± .50
.159
Vertical Jump (cm) DS DNS
18.58 ± 3.80 22.91 ± 4.93
18.40 ± 4.97 23.71 ± 5.30
1.55
*: There are statistically sıgnificant difference (p<0.05). DS: Do sports, DNS: Do not sports
A meaningful difference (p<0,05) can be observed on the flexibility and the reaction values once motoric properties of the children who do sports and do not do sports are separately compared.
4. Discussion and Conclusion
In this study, in which some motoric and anthropometric features and the relations between the variables of primary and secondary school students were examined in the study and control groups were examined and the following results were obtained.
Graph 1: A meaningful difference can be observed between students who do sports and do not do
sports once reaction test results are compared
Graph 2: A meaningful difference can be observed between students who do sports and do not do sports
once flexibility test results are compared
Graph 3: A meaningful difference can be observed between students who do sports and do not do sports
once speed test results are compared
Graph 4: A meaningful difference can be observed between students who do sports and do not do sports once
When some definitive features of the students who were included in the study were examined it was determined that (Table 1) the average values of the age, height, weight, BMI, hand length, feet length, estimated length were 7,4 ± 0,1 years, 128,7 ± 9,3 cm, 29,1 ± 7,9 kg, 60,3 ± 31,4, 13,3 ± 2,4 cm, 19,5 ± 3,6 cm, respectively in those who did sports; and 7,3 ± 0,95 years, 128,6 ± 8 cm, 28,6 ± 7 kg, 57,9 ± 33,3, 13,6 ± 1,9 cm, 19,7 ± 2,9, respectively in those who did not do sports.
According to these findings, when we consider the pre-test and post-test average scores of the students who did sports and who did not do sports, the average values did not have a statistically significant difference according to p<0.05; however, an increasing change was observed with the effect of their growth and development.
The basic reason of the increase in the height of all groups is that it is because children are physically in their growth and development periods. As a matter of fact, Yörükoğlu & Koz (2007), stated that the increase in the heights of children is a process continuing from birth to maturity. In addition, age factor plays an important role in the sportive performance development of children (Kale & Kara 1998). Stated that the growth process must be considered in evaluating the physical performance in children and adolescents.
When we consider the weight values, it was reported that there were decreases at significant level in the body weights of children, who were directed to sports like swimming, which is parallel to the findings of our study (Gökdemir & Koç., 2000; Sevinç, 2008; Kurşunel et al., 2010).
The BMI is shown as the relation between the height and body weight. For this reason, the BMI values increase in parallel with the increase in the height and body weight scores. When we consider the average BMI scores, we see that they are quite close to each other. We also see some different studies that reported parallel results with ours. In addition, these studies are supported by other studies which concluded that children in growth period levels have different levels of BMI at different age levels (Pınar et al., 2001; Saygın et al., 2003).
When some motoric features of the children who did and who did not do any sports participating in the study were compared (Table 2), when the reaction test was examined, while the pre-test score was 12,10 ± 9,67 cm and the post test was 6,90 ± 9,16 cm in those who did sports; the pretest scores were 18,86 ±10,05cm, and the post test was 16,05 ±10,49 cm in those who did not do sports. The values were statistically significant according to p<0.05.
When the flexibility test was examined, it was determined that while the pre-test was 5.80 ± 4.80 cm and the post test was 5.68 ± 4.79 cm in those who did do sports; the pretest was 3,40 ±4,22cm, posttest was 3,50 ±4,30 cm in those who did not do sports. The values were statistically significant according to p<0.05.
When the speed test was examined, while the pre-test was 5,42 ±, 55 s, the post
developed with the effect of physical growth and maturation in students who did and who did not do sports.
When the vertical jump test was examined, while the pre-test was 18,58 ± 3,80 cm and the post test was 18,40 ± 4,97cm in those who did sports; and pretest was 22,91 ± 4,93 cm, posttest was 23,71 ± 5,30 cm who did not do sports. Although the values that were found in the vertical jump test did not show a statistical significance according to (p>0.05), it was found that it developed with the effect of physical growth and maturation of the students who did and who did not do sports.
According to Koşar & Demirel, the muscle mass, muscle strength, endurance in strength, muscle nerve and reaction time development, the metabolic structure of the muscle, and body dimensions increase in children in growth period.
In the study conducted by Şahin and colleagues (2010) on the effect of taekwondo training on motor development levels of children regular taekwondo-do training applied for a period of 10 weeks on the motor development values of children, it was determined that there were increases at a significant level. However, it was concluded that the development in motor skills of children who did not have regular training was more limited.
In our study, it was seen and it was supported that the students who did sports
had higher motoric features than those who did not do sports; and their development was more advanced than those who did not do sports.
A significant difference in the flexibility parameter, it was seen that there were decreasing elasticity values in contrast to the increasing age. Polat & Saygın (2003) and Berg and colleagues (1995) they stated that stated that as the age increased in adolescent athletes, the flexibility decreased significantly in adolescent athletes. Right at this point, we believe that the difference in the flexibility values in primary school students in 6-10 years of age period will differ significantly in further ages. Based on this view point, we believe that it is necessary to consider the joint mobility trainings in adolescence period. We see that there are different research results in similar studies about flexibility, (Yenal et al., 1999; Çalış et al., 1992).
Muratlı (1997) stated that speed is an important motor feature in many sports types. In addition, he also stated that the velocity feature development was related closely to the features like rapid force, width of movement, and ability of the muscles to relax. When we consider our study, we believe that there are no significant differences between the values that were found in the different sports branches, which was due to the short training period.
this reason, when studies are conducted on children, it is necessary to understand the growth and maturation (Koşar & Demirel, 2004; Siner et al., 2001).
The physical and physiological tests that are applied to children are employed to evaluate the effects of regular physical activity on growth, development and health, and to examine the exercisability of children in adolescence period (Docherty, 1996).
As a result, when the results of the present study and those reported in the literature are compared, we see that the students of 6-10 years’ age group at primary school age who did not do sports have similar physical characteristics. In terms of motoric features, although there was a significant awareness on the reaction and flexibility scores of the students who did sports, positive developments were recorded although there were no significant awareness scores on speed and vertical jump.
In the light of our study, we hope that if the number of students and training period increases, more accurate results may be achieved.
We recommend school and club managers, trainers and athletes, parents and everyone that children are started to do sports at earlier ages provided that with appropriate exercise types that are proper for the age and level of our children.
References
Açıkada, C. Ergen, E. 1990. Science and Sports, TEK Offset Printing, Ankara.
Berg K.E., LaVoie J.C., Latin R.W. 1995. Soc Physiological Training Effect Of Youth Soccer. Med. Sci. Sports Exerc. Erc Dec; 17 (6): 656-60.
Docherty D. 1996. Measurement of Pediatric Exercise Science, Human Kinetics, 34-86. Fişekçioğlu, B., Metin, Ş. and Murat, B.E. 2008. etr Investigation of Physical and
Physiological Parameters of Children Participating in the City Sports Center Summer Term Program an (Case of Konya Province)
Gökmen, H., Karagül, T., Afiçı, F.H.: Psychomotor Development, GSGM Publication No: 139, Ankara, 1995.
Hofman J.R., Stavsky H., Falk B. 1995. Basketball The Effect Of Water Restriction And ‚‚ ‚‚ Int J Sport Med. Sport May; 16 (4): 214-8. 10. Butcher H .: Electronic Flexiometer in Sports
Katie M.M., Brad S.M., Joanne K., Linda D.V., Terence J.W. 2003. Physical Education In Primary School Children: Cross Sectional Study, To BMJ Volume, 327, 13 September
Kosar N.Ş., Demirel H.A. 2004. Olojik Physiological Characteristics of Children Athletes. ACTA Orthopaedica et Traumatologica Turcica suplementum, 38: 115 Lippincott, W., Lippincott, W. 2000. ACSM ,s Guidelines for Exercise Testing, American
College of Sport Medicine, 78-82, 217-234, USA.
Oğuz, H. 1998. Investigation of Physical Performance and Anthropometric Properties of 8, 9 and 10 Year - Old Children in Different Socio - Economic Level Families in Bursa, (M.Sc.), U.Ü. Institute of Social Sciences, Bursa.
Özer, K. 2006. Physical Fitness el 2.Print, Nobel Publications, Ankara
Pınar S., Saygın Ö. 2001. Kucuker M. : kil ini Evaluation of Two Hand Eye Coordination and Factors Affecting Balance Features of Girls, (gın Sports Researches Der. 5 (2-3): 76-91,
Polat Y., Saygın Ö. 2003. Investigation of Age-Related Development of Some Physical Fitness Parameters of ler ’12 -14 Age Group Footballer Children, IX. National Sports Hek Kong. Scarce. S: 401, Nevsehir
Sallis J.F., Patrick K. 1994. Physical activity guidelines for adolescents: Consensus statement. Pediatr Exerc Sci 6: 314.
Saygın Ö., Polat Y., Karacabey K. (2003). A aThe Effect of Movement Training Applied to 16 -12 Year Old Children Over 16 Weeks on Some Health Related Physical Fitness Parameters, ‘IX. National Sports Hek Kong. Scarce. S: 400, Nevsehir Tamer K. 2000. Kı Measurement and Evaluation of Physical-Physiological Performance
in Sports esi, 2nd Edition, Bağırgan Publication, Ankara.
Tekelioglu, A. 1999. Ation Physical Fitness Girls and Boys Aged 11-13 Years ‛(Doctoral Dissertation). GU Institute of Medical Sciences, Ankara.
Yenal T.H., Camlıyer H., Saraçoğlu A.S. 1999. Eden The Effect of Physical Education and Sport Activities on Motor Skills and Abilities in Secondary Secondary School Children, İkinci G.Ü. BESBD, Volume 4 (3): 15-24, Ankara
Ziyagil M.A., Zorba E, Bozatli S, Imamoglu O. 1999. The effect of age, gender and sports habits on speed and anaerobic power in 6-14 age group children. G.Ü BESBD Ankara, 3: 3
Creative Commons licensing terms