ARTIGO ORIGINAL
Diabetes Screening in Patients with Macrovascular
Coronary Disease: Are the New European Guidelines a
Step Backwards?
Rastreio da Diabetes em Doentes com Doença
Macrovascular Coronária: As Novas Guidelines
Europeias são um Retrocesso?
1. Faculdade de Medicina. Universidade de Lisboa. Lisboa. Portugal. 2. Serviço de Cardiologia. Hospital Fernando Fonseca. Amadora. Portugal.
Autor correspondente: Sérgio Baptista. [email protected]
Recebido: 28 de junho de 2016 - Aceite: 13 de fevereiro de 2017 | Copyright © Ordem dos Médicos 2017
Andreia RIBEIRO1, Sérgio Bravo BAPTISTA2, Mariana FAUSTINO2, Paulo ALVES2, Pedro Farto e ABREU2,
Victor Machado GIL2, Carlos MORAIS2
Acta Med Port 2017 Jun;30(6):434-442 ▪ https://doi.org/10.20344/amp.7990
RESUMO
Introdução: As novas recomendações europeias de diabetes mellitus tipo 2 e doença cardiovascular sugerem que o risco de diabetes
mellitus tipo 2 deve ser avaliado através do score de risco FINnish Diabetes RIsk SCore e que o rastreio de diabetes mellitus tipo 2 na população com doença arterial coronária deve ser efetuado apenas com a glicemia plasmática em jejum e a HbA1, remetendo a prova de tolerância oral à glicose para os casos ‘inconclusivos’. Pretendemos avaliar os resultados desta estratégia, que difere da previamente defendida nas guidelines.
Material e Métodos: A glicemia plasmática em jejum, HbA1c e a prova de tolerância oral à glicose (75 g, 2 horas) foram avaliadas prospectivamente num grupo de doentes consecutivos submetidos a intervenção coronária percutânea, sendo usada a classificação da ADA para pré-diabetes mellitus tipo 2 e diabetes mellitus tipo 2. O risco de diabetes foi avaliado de acordo com o FINnish Diabetes RIsk SCore.
Resultados: Foram incluídos 135 doentes (idade média 62,3 +/- 13,1 anos; 99 homens). Usando a prova de tolerância oral à glicose e a HbA1c, foram diagnosticados 18 (13,3%) novos casos de diabetes mellitus tipo 2 e 77 (57,0%) casos de pré-diabetes mellitus tipo 2. A glicemia plasmática em jejum + HbA1c identificou 12/18 doentes com diabetes mellitus tipo 2 (Sens 66,7%; valor preditivo nega-tivo 95,1%; Kappa 0,78; p < 0,0001) e 83 do total (pré-diabetes mellitus tipo 2/ diabetes mellitus tipo 2) de 95 doentes com distúrbios da glucose (Sens 87,4%; valor preditivo negativo 76,9%). Realizar adicionalmente prova de tolerância oral à glicose nos 29 doentes com um FINnish Diabetes RIsk SCore elevado permitiu diagnosticar 15/18 doentes com diabetes mellitus (Sens 83,3%; valor preditivo negativo 97,5%; Kappa 0,85; p < 0,0001) e 86/95 dos doentes com distúrbios da glucose (Sens 90,5%; valor preditivo negativo 81,6%).
Discussão: Apesar da melhoria diagnóstica, um em cada seis doentes com diabetes mellitus tipo 2 não seria diagnosticado por esta estratégia.
Conclusão: A utilização do FINnish Diabetes RIsk SCore como forma de selecionar os doentes candidatos a rastreio com prova de tolerância oral à glicose melhora a capacidade diagnóstica, quando comparada com a simples avaliação da glicemia plasmática em jejum e da HbA1c. No entanto, um em cada seis doentes com diabetes mellitus tipo 2 não é identificado com esta metodologia.
Palavras-chave: Diabetes Mellitus Tipo 2; Doença da Artéria Coronária; Hemoglobina A Glicosilada; Rastreio; Teste de Tolerância a Glucose
ABSTRACT
Background: The new European guidelines on diabetes mellitus and cardiovascular diseases propose that the FINnish Diabetes RIsk SCore should be used to evaluate the risk of diabetes mellitus and that diabetes mellitus screening in coronary artery disease patients should be based on fasting glucose and HbA1c. The 2 hour oral glucose tolerance test, recommended for all pts in the previous guide-lines, is now only recommended for ‘inconclusive’ cases. We aimed to evaluate this new strategy.
Material and Methods: Fasting glucose, HbA1c and glucose tolerance test (75 g, 2h) were prospectively evaluated in a consecutive group of pts with coronary artery disease. ADA criteria (both glucose tolerance test and HbA1c) were used to define diabetes mellitus and pre-diabetes mellitus. Diabetes mellitus risk was evaluated according to the FINnish Diabetes RIsk SCore.
Results: A total of 135 patients were included (mean age 62.3 +/- 13.1 years, 99 males). Glucose tolerance test and HbA1c together diagnosed 18 (13.3%) new cases of diabetes mellitus and 77 (57.0%) patients with pre-diabetes mellitus. Fasting glucose + HbA1c (guidelines strategy) identified 12/18 patients with diabetes mellitus (Sens 66.7%; negative predictive value 95.1%; Kappa 0.78; p <
0.0001) and 83/95 patients with glucose anomalies (pre- diabetes mellitus + diabetes mellitus) (Sens 87.4%; negative predictive value 76.9%). Performing glucose tolerance test in the 29 patients with an elevated FINnish Diabetes RIsk SCore would allow identifying 15/18 patients with diabetes mellitus (Sens 83.3%; negative predictive value 97.5%; Kappa 0.85; p < 0.0001) and 86/95 patients with glucose anomalies (Sens 90.5%; negative predictive value 81.6%).
Discussion: Although this strategy improved the screening accuracy, one in each six patients with diabetes mellitus would still remain undiagnosed, as compared to measuring HbA1c and performing an glucose tolerance test in all patients.
Conclusion: Using the FINnish Diabetes RIsk SCore to select candidates to additional glucose tolerance test improves the accuracy for identifying diabetic patients, as compared with fasting glucose + HbA1c alone. However, 1/6 patients diabetes mellitus is still left undiagnosed with this strategy proposed by the current guidelines.
ARTIGO ORIGINAL INTRODUCTION
Despite the ever-increasing number of patients with diabetes, an estimated 30% of the population with type-2 diabetes mellitus (DM) remains undiagnosed and 25% of these patients already have overt retinopathy or micro-albuminuria at the time of diagnosis.1,2 Despite DM has
been defined according with the level of hyperglycaemia corresponding to an increased risk of glucose-induced microvascular disease (including retinopathy, nephropathy or neuropathy), the presence of macrovascular complications, particularly related to coronary heart disease (CHD) is very relevant in patients with diabetes and their outcome is greatly affected.3
On the other hand, the disorders of glucose metabolism are very prevalent, even though they frequently remain unnoticed in these patients.4,5 This is also a very relevant
issue, as these disorders are associated with poorer outcome in patients with CHD, when compared with normoglycaemic patients.6-9
In line with this mutual impact between CHD and DM, the European Society of Cardiology – ESC and the European Association for the Study of Diabetes – EASD have for the first time issued in 2007 their recommendations on the diagnosis of diabetes in the presence of cardiovascular disease.10 The need for a screening program for disorders
of glucose metabolism (including diabetes, impaired fasting glucose and impaired glucose tolerance) in all the patients with CHD was for the first time assumed by these guidelines as well as the assessment of fasting plasma glucose levels supplemented with an oral glucose tolerance test (OGTT) in all the patients with CHD not previously diagnosed with diabetes.
A new evidence has emerged and the HbA1c level became a diagnostic criterion for diabetes.11-14 The
European guidelines were reviewed in 2013 and aimed at the inclusion of this new evidence3 with the recommendation
for the use of fasting plasma glucose (FPG) and HbA1c levels in patients with established cardiovascular disease. According with this new document, the OGTT has only an indication for patients with an inconclusive diagnosis, whose identification has not been clearly defined. The new guidelines have also recommended that the risk of diabetes in patients with overt CHD should be based on the FINnish Diabetes RIsk SCore (FINDRISC) which in fact has not yet been validated for the population of patients with CHD.15
This is a different approach and the percentage of patients who would remain undiagnosed should the OGTT not been systematically carried out in patients with CHD has still not been clearly established.
This study aimed at: 1) The assessment of the diagnostic capability of the approach recommended by the European guidelines for the identification of new cases of DM in a population of patients with overt CHD; 2) The assessment of the FINDRISC score in patients with CHD with an indication for the use of OGTT.
MATERIAL AND METHODS
Study design and group of patients
This was a prospective observational study involving consecutive patients who underwent coronary angioplasty and attended the Cardiology outpatient clinic at a single hospital between Jan 2013 and Jul 2014. The following data were obtained, including epidemiological (age, gender) physical (body mass index and waist circumference) and clinical characteristics (including cardiovascular risk factors: high blood pressure, dyslipidaemia and smoking) and those related to coronary heart disease (number of affected arteries, history of myocardial infarction or revascularization). The risk for the development of diabetes has been assessed by theFINDRISC score for each patient and the presence of disorders of glucose metabolism by FPG, OGTT and HbA1c level was obtained from all the patients.
FINDRISC
The FINDRISC score15 was obtained for each patient,
including the following variables: patient’s age, waist circumference, BMI, physical exercise habit, dietary habit, history of high blood pressure, previously known disorders of glucose metabolism and family history of DM (Fig. 1). The overall risk was calculated by adding the individual scores and is shown in terms of the chance of developing DM over the following 10 years:
• Low risk: Score < 7 (1/100 patients will develop DM); • Slightly elevated: Score 7-11 (1/25 will develop DM); • Moderate: Score 12-14 (1/6 will develop DM); • High: Score 15-20 (1/3 will develop DM);
• Very high: Score > 20 (estimated that 1 in 2 will develop DM).
Laboratory assessment and diabetes diagnostic criteria
Laboratory tests were performed to all the patients with no known diabetes (approximately two months upon hospital discharge) on the first medical examination upon coronary angioplasty, between the fourth and the fifth month upon discharge from hospital, including FPG, OGTT and HbA1c. The OGTT was carried out according with the WHO recommendations (FPG, followed by a 2-h 75 g OGTT). The HbA1c level was determined by high-resolution liquid chromatography at the time of the first blood sampling for OGTT. Disorders of glucose metabolism have been diagnosed according with the recommendations of the American Diabetes Association (Table 1)16 and prediabetes
was defined in patients with impaired fasting glucose (IFG) and with impaired glucose tolerance (IGT).
Statistical analysis
ARTIGO ORIGINAL
Figure 1 – FINish Diabetes Score (FINDRISC)3
FINish Diabetes Risk Score
(FINDRISK) for the assessment of the
10-year risk of type-2 diabetes in adult patients.
(Available at: www.diabetes.fi/english)
Type-2 diabetes assessment form
Circle the right alternative and add up your points.
1. Age
0 p. Under 45 years of age
2 p. 45 - 54 years
3 p. 55 - 64 years
4 p. Over 64 years
2. Body mass index
0 p. Lower than 25 kg/m
21 p. 25 - 30 kg/m
23 p. Higher than 30 kg/m
24. Do you usually have daily at least 30 minutes
of physical at work or during leisure time
(including normal daily activity)?
0 p. Yes
2 p. No
5. How often do you eat vegetables, fruit or
berries?
0 p. Every day
1 p. Not every day
6. Have you ever taken antihypertensive
medication regularly?
0 p. No
2 p. Yes
7. Have you ever been found to have high blood
glucose (eg. in a health examination, during an
illness or during pregnancy)?
0 p. No
5 p. Yes
8. Have any of the members of your immediate
family or other relatives been diagnosed with
diabetes (type 1 or type 2)?
0 p. No
3 p. Yes: grandparent, aunt, uncle or first cousin
(but no own parent, brother, sister or child)
5 p. Yes: parent, brother, sister or own child
Total risk score
The risk of developing type-2
diabetes within 10 years is:
< 7 Low: estimated 1 in 100 will
develop disease
7 - 11 Slightly elevated: estimated 1
in 25 will develop disease
12 - 14 Moderate: estimated 1 in 6
will develop disease
15 - 20 High: estimated 1 in 3 will
develop disease
> 20 Very high: estimated 1 in 2
will develop disease
Test designed by Professor Jaakko Tuomilehto, Department of Public Health, University of Helsinki and by
Dr. Jaana Lindström, MFS, National Public Health Institute.
3. Waist circumference measured below the
ribs (usually at the level of the navel)
MEN
0 p. Less than 94 cm
3 p. 94 - 102 cm
4 p. More than 102 cm
ARTIGO ORIGINAL
assessment of quantile-quantile plots. Discrete variables were represented by percentages. Comparisons were established between the variables of the different groups (classification of disorders of glucose metabolism and risk groups according with the FINDRISC score) by using Chi-square test for categorical variables, Student’s t-test or one-way ANOVA test for normally-distributed continuous variables or the Kruskal-Wallis test for non-normally distributed continuous variables. The agreement between the different techniques for the assessment of disorders of glucose metabolism was assessed through the value of kappa. For all the comparisons, a p-value < 0.05 has been considered as statistically significant. The statistical analysis has been carried out using SPSS® Statistics version 19.0
(SPSS Inc., Chicago, IL) IBM® software.
RESULTS
Characteristics of the study population
Fifty (27.0%) patients from an initial group of 185 with overt CHD were excluded from the study, as these were previously diagnosed with DM (Fig. 2). The main characteristics of the study population, including their cardiovascular risk factors, major cardiovascular history data, patient’s lipid profile and the analysis of diabetes diagnosis are shown in Table 2.
Results according with the presence of disorders of glucose metabolism
The overall assessment of OGTT and HbA1c led to the identification of 77 (57%) patients with prediabetes and 18 (13%) patients with DM. Only 40 (30%) patients did not show any disorder of glucose metabolism (Fig. 2). Apart from the 50 patients who were excluded from the analysis due to having been previously diagnosed with diabetes, 18 additional patients with diabetes were identified, showing an overall 36.8% prevalence of diabetes (68/185) in our group of patients. The characteristics of our group of patients according with the presence of disorders of glucose metabolism are shown in Table 2. Newly diagnosed patients with DM showed higher BMI and a tendency for higher waist circumference and no other significant differences were found, namely as regards patient’s age and the presence of cardiovascular risk factors. As regards laboratory tests, the patients with DM and pre-diabetes showed higher triglyceride levels and no other differences were found as regards the remaining parameters included in patient’s lipid profile. Progressively higher FPG, 2-h glucose and HbA1c
levels were found in patients with DM when compared with patients with prediabetes and with normoglycaemic patients.
Results according with the FINDRISC score
A low risk of developing diabetes according with the FINDRISC score has been found in 17 (13%), slightly
Figure 2 – Patient inclusion flowchart. Prevalence of disorders of glucose metabolism (according with the determination of HbA1c levels and the oral glucose tolerance test).
CHD – coronary heart disease Normal
Prediabetes
Diabetes
40 (30%) 18 (13%)
OGTT and HbA1c 135 patients included 185 patients with CHD
50 patients with diabetes (27.0%)
77 (57%)
Table 1 - Diagnostic criteria for diabetes (American Diabetes Association, 2016)16
Fasting plasma glucose
(mg/dL) 2-h. blood glucose (mg/dL) HbA1c
Normal < 100 < 140 < 5.7
Prediabetes Impaired fasting glucose (IFG) 100 – 126 < 140 5.7 – 6.4
Impaired glucose tolerance (IGT) < 126 140 – 200
ARTIGO ORIGINAL
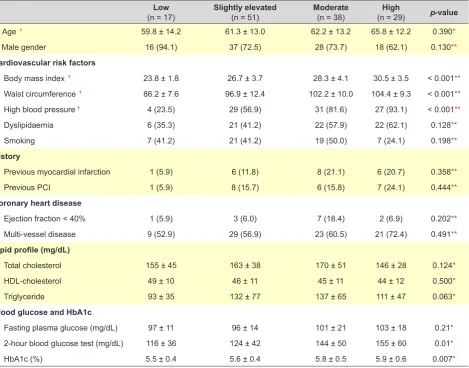
elevated in 51 (38%), moderate in 38 (28%) and high/ very high in 29 (21%) patients. The characteristics of the population according with the FINDRISC score are shown in Table 3. Apart from the parameters included in the score (BMI, waist circumference and history of high blood pressure), no other significant differences were found between populations, namely as regards other risk factors, the presence of cardiovascular history, the characteristics of coronary heart disease or the lipid profile. No significant differences were found between the groups as regards the FPG levels, unlike what was found regarding the 2-h OGTT and HbA1c, that progressively and significantly showed higher levels as the FINDRISC score increased.
Diagnostic approach to the disorders of glucose metabolism (diabetes and prediabetes)
The results of the different approaches to DM in patients with overt CHD are shown in Fig. 3A. The approach recommended by the current European guidelines showed a 66.7% sensitivity and a 95.1% negative predictive value (NPV) for the identification of new patients with DM (Kappa 0.78; p < 0.0001, for the comparison with OGTT + HbA1c approach). A percentage of 33% of new patients with DM would remain undiagnosed should this approach had been used.
On the other hand, a 83.3% sensitivity and 97.5% NPV (Kappa 0.85; p-value <0.0001) would have been found should the approach involving the OGTT only performed in patients in high risk of developing DM according with the FINDRISC score had been used. Even so, 17% of the new patients with DM would remain undiagnosed should this approach had been used, when compared with the OGTT + HbA1c approach performed in all the patients.
As regards the patients with disorders of glucose metabolism (prediabetes and DM), the approach that was recommended by the guidelines showed an 87.4% sensitivity and a 76.9% NPV, while the additional use of OGTT in patients with high FINDRISC score increased the sensitivity to 90.5% and the NPV to 81.6% and 10% of the patients with disorders of glucose metabolism would remain undiagnosed, when compared to the OGTT + HbA1c approach performed in all the patients.
DISCUSSION
In short, the main results of the study were: 1) a very high prevalence of disorders of glucose metabolism and particularly of diabetes has been found in patients with CHD; 2) the diagnostic approach recommended by the new European guidelines provides for the identification of only part of these new patients with diabetes and prediabetes; 3) Table 2 - Characteristics of our group of patients according with the presence of disorders of glucose metabolism
Total population
(n = 135) Normal blood glucose(n = 40) Prediabetes(n = 77) Diabetes(n = 18) p-value
Age 62.3 ± 13.1 61.3 ± 13.0 63.0 ± 13.4 61.4 ± 12.1 0.755*
Male gender 99 (73.3) 30 (75.0) 55 (71.4) 14 (77.8) 0.826**
Cardiovascular risk factors
Body mass index 27.6 ± 4.1 26.5 ± 3.8 27.8 ± 4.2 29.3 ± 2.8 0.041*
Waist circumference 98.7 ± 11.9 96.6 ± 12.1 98.4 ± 11.0 104.2 ± 13.8 0.076*
High blood pressure 91 (67.4) 28 (70.0) 48 (62.3) 15 (83.3) 0.212**
Dyslipidaemia 67 (49.6) 21 (52.5) 34 (44.2) 12 (66.7) 0.208**
Smoking 54 (40.0) 22 (55.0) 27 (35.1) 5 (27.8) 0.059**
History
Previous myocardial infarction 21 (15.6) 7 (17.5) 8 (10.4) 6 (33.3) 0.050**
Previous PCI 22 (16.3) 6 (15.0) 10 (13.0) 6 (33.3) 0.106**
Coronary heart disease
Ejection fraction < 40% 13 (9.7%) 2 (5.0) 10 (13.2) 1 (5.6) 0.301**
Multi-vessel disease 82 (60.7) 21 (52.5) 49 (63.6) 12 (66.7) 0.433**
Lipid profile (mg/dL)
Total cholesterol 160 ± 82 153 ± 34 164 ± 45 162 ± 42 0.406*
HDL-cholesterol 46 ± 11 49 ± 11 45 ± 11 43 ± 9 0.148*
LDL-cholesterol 90 ± 36 86 ± 29 92 ± 40 92 ± 32 0.658*
Triglyceride 124 ± 65 96 ± 36 136 ± 75 133 ± 51 0.004*
Blood glucose and HbA1c
Fasting plasma glucose (mg/dL) 99 ± 17 88 ± 6 100 ± 13 120 ± 26 < 0.001*
2-hour blood glucose test (mg/dL) 135 ± 50 94 ± 24 139 ± 34 222 ± 39 < 0.001*
HbA1c (%) 5.7 ± 0.5 5.3 ± 0.2 5.7 ± 0.3 6.4 ± 0.015 < 0.001*
ARTIGO ORIGINAL
Table 3 - Characteristics of our group of patients according with the FINDRISC score
Low
(n = 17) Slightly elevated(n = 51) Moderate(n = 38) (n = 29)High p-value
Age Ϯ 59.8 ± 14.2 61.3 ± 13.0 62.2 ± 13.2 65.8 ± 12.2 0.390*
Male gender 16 (94.1) 37 (72.5) 28 (73.7) 18 (62.1) 0.130**
Cardiovascular risk factors
Body mass index Ϯ 23.8 ± 1.8 26.7 ± 3.7 28.3 ± 4.1 30.5 ± 3.5 < 0.001**
Waist circumference Ϯ 86.2 ± 7.6 96.9 ± 12.4 102.2 ± 10.0 104.4 ± 9.3 < 0.001**
High blood pressure Ϯ 4 (23.5) 29 (56.9) 31 (81.6) 27 (93.1) < 0.001**
Dyslipidaemia 6 (35.3) 21 (41.2) 22 (57.9) 22 (62.1) 0.128**
Smoking 7 (41.2) 21 (41.2) 19 (50.0) 7 (24.1) 0.198**
History
Previous myocardial infarction 1 (5.9) 6 (11.8) 8 (21.1) 6 (20.7) 0.358**
Previous PCI 1 (5.9) 8 (15.7) 6 (15.8) 7 (24.1) 0.444**
Coronary heart disease
Ejection fraction < 40% 1 (5.9) 3 (6.0) 7 (18.4) 2 (6.9) 0.202**
Multi-vessel disease 9 (52.9) 29 (56.9) 23 (60.5) 21 (72.4) 0.491**
Lipid profile (mg/dL)
Total cholesterol 155 ± 45 163 ± 38 170 ± 51 146 ± 28 0.124*
HDL-cholesterol 49 ± 10 46 ± 11 45 ± 11 44 ± 12 0.500*
Triglyceride 93 ± 35 132 ± 77 137 ± 65 111 ± 47 0.063*
Blood glucose and HbA1c
Fasting plasma glucose (mg/dL) 97 ± 11 96 ± 14 101 ± 21 103 ± 18 0.21*
2-hour blood glucose test (mg/dL) 116 ± 36 124 ± 42 144 ± 50 155 ± 60 0.01*
HbA1c (%) 5.5 ± 0.4 5.6 ± 0.4 5.8 ± 0.5 5.9 ± 0.6 0.007*
Numbers represent mean ± standard deviation or n(%); Ϯ Included into the risk score; * One-way ANOVA test; ** Chi-square test; PCI: percutaneous coronary
A New cases of diabetes
No. of identified patients (%)
Sensitivity NVP % undiagnosed patients
12
HbA1c + FPG 66.7 95.1% 33%15
HbA1c + FPG + OGTT (with high FINDRISC) 83.3 97.5% 17%18
OGTT + HbA1cB New cases of diabetes and prediabetes
No. of identified patients (%)
83
HbA1c + FPG 87.4 76.9% 13%86
HbA1c + FPG + OGTT (with high FINDRISC) 90.5% 81.6% 10%95
OGTT + HbA1cARTIGO ORIGINAL the diagnostic capability of the approach recommended by the guidelines is improved by the inclusion of the FINDRISC
score in the selection of the patients with an indication for the use of OGTT, even though it still does not allow for the identification of a significant number of patients with diabetes (one in six).
Prevalence of diabetes/prediabetes in patients with
CHD
The high prevalence of disorders of glucose metabolism was clearly shown in the Euro Heart Survey on Diabetes.4
The use of the OGTT in all the patients with stable or acute CHD with no previously diagnosed diabetes was recommended in this international multicentric study. A 14 and 37% incidence of de novo diabetes or prediabetes in clinically stable patients who underwent this test have been found, respectively, while a 22 and 36% incidence, respectively, were found in patients with acute CHD. These numbers were added to the 31% percentage of patients already diagnosed with diabetes at the time of study inclusion. The authors found that most of the patients with CHD had an abnormal glucose metabolism and have recommended the use of OGTT in all the patients with no previously diagnosed diabetes. We have also confirmed these results in our study: only 40 from the initially assessed 185 patients (21.6%) showed a normal glucose metabolism and 68 (36.8%) patients had diabetes (including 50 patients previously diagnosed with diabetes and 18 patients with previously unknown diabetes) and 77 (41.6%) had prediabetes. It should be mentioned that, according with what has been described by the Euro Heart Survey on Diabetes,4 the prevalence of diabetes found in
our study is much higher than the prevalence described in the Portuguese population (13.1%, according with the most recent results).17 These results have confirmed the crucial
need for the screening of disorders of glucose metabolism in all the patients with CHD, considering the impact on patient’s outcome produced by this metabolic disorder in this population. Even though there are no published data allowing for the assessment of the percentage of patients with CHD in whom this screening is carried out, the general feeling is that this is probably a very small percentage and that most physicians (including cardiologists) following these patients are not aware of the problem.
Diabetes diagnostic approach to patients with CHD
The most recent European recommendations (2013)3
have introduced a very relevant change when compared to the previous recommendations as regards the diagnostic approach to disorders of glucose metabolism in patients with CHD: diagnosis became only based on FPG and on HbA1c levels and OGTT was reserved for ‘doubtful’ cases. This has been a somewhat surprising change, considering that previous recommendations were based on the already mentioned Euro Heart Survey on Diabetes, in which OGTT was a crucial element.10 The inclusion of HbA1c levels as
diagnostic criterion seems obvious, taking into account that
it became a diagnostic criterion in general population;16,18,19
however, the limitation of the use of OGTT for ‘doubtful’ cases has not been clearly reasoned in the new guidelines. In fact, a ‘doubtful’ case is not clearly defined in recommendations and may be interpreted as involving patients with inconclusive laboratory results or eventually patients in higher risk of developing diabetes. The recommendations have suggested the FINDRISC score for the assessment of the risk of diabetes, even though considering that this is a score that has been developed in populations with no known CHD.
In our study, the approach recommended by the guidelines allowed for the identification of only 66% of new patients with diabetes, when compared to the systematic use of OGTT + HbA1c in all the patients. Even when selecting the ‘doubtful’ patients – defined as those with a risk of developing diabetes (high or very high FINDRISC score) – for the use of OGTT, only 83.3% of the patients with diabetes were correctly identified, meaning that 1 in 6 patients remained undiagnosed.
Obviously, it should not be expected that different diagnostic strategies would identify exactly the same patients with diabetes. All techniques involve advantages and disadvantages and, while the OGTT involves the use of an oral glucose load and a second blood sampling and is not absolutely reproducible, the level of HbA1c, even though allowing for a more reliable assessment of the chronic exposure to glucose, is a more expensive test and may be influenced by some pathologies.19
In a previous study, at the time when the European recommendations only suggested the use of OGTT, we showed that diagnostic capability was improved with the use of HbA1c level, allowing for the identification of approximately 15% of new patients who were not identified by the OGTT.14 In the present study, we have also confirmed
that the opposite also occurs: the use of OGTT allows for the identification of around 17% of patients with diabetes who were not identified by the level of HbA1c and by FPG. In addition, the use of OGTT allows for the identification of 13% more patients with disorders of glucose metabolism (diabetes and prediabetes), when compared with the approach recommended by the guidelines (HbA1c + FPG). The discussion around the use of OGTT in patients with CHD is not confined to its capability for the identification of different populations of patients with diabetes, rather regarding its capability for the identification of patients with increased insulin resistance and subsequently in higher risk for cardiovascular events.20
Current diagnostic criteria, defined for the general population, are based on the levels of blood glucose and HbA1c that are associated with an increased risk for developing microvascular disease.16 Macrovascular disease
and its consequences were not correctly taken into account for the definition of diabetes diagnostic criteria and recent trials (ACCORD,21 ADVANCE22) were not able to show
ARTIGO ORIGINAL
results must be analysed considering that microvascular disease seems to be mainly associated with the decreased function of pancreatic beta-cells, while macrovascular disease (such as coronary heart disease) seems to mainly relate to a decreased sensitivity to insulin.23 Knowing that the
studies ACCORD and ADVANCE have assessed the events according with the levels of HbA1c (mainly corresponding to the function of pancreatic beta-cells), a closer relationship with microvascular disease should be expected and the fact that no reduction in macrovascular events has been shown is not surprising.
In addition, sensitivity to insulin is better assessed by the use of OGTT: postprandial status requires a quick and high release of insulin, which is reduced in patients resistant to insulin. In patients with CHD, this fact is associated with an increased risk of macrovascular events and is not assessed by FPG of by HbA1c levels.20,24 In addition, the analysis
of the levels of HbA1c does not allow for the assessment of another relevant aspect of glucose metabolism – the fluctuations that occur during the postprandial period in patients with insulin resistance. These fluctuations in blood glucose levels have shown a deleterious action at different levels: activation of the protein kinase C pathway, induction of the production of different inflammatory markers and induction of deeper endothelial dysfunction, when compared with higher yet more stable levels of blood glucose.25-27
In patients with predominant macrovascular disease, the levels of HbA1c may therefore underestimate the risk associated with disorders of glucose metabolism, explaining for the routine use of OGTT in this population. Considering the high prevalence and the impact of disorders of glucose metabolism in the outcome of patients with CHD,6,7 it is at
the very least questionable that the information provided by this technique would be overlooked, even considering the inconvenience associated with the use of a glucose load and the need for a second blood sampling. The early identification of DM and prediabetes stages is particularly important in these patients, allowing for pharmacological approaches as well as over patient’s lifestyle28,29 in
preventing or delaying the progression to diabetes and reducing the risk of macrovascular complications. Finally, it should be mentioned that a small additional cost is involved with the systematic use of OGTT, as supported in our study: according with the current price chart of the Portuguese Ministry of Health,30 the assessment of blood glucose has a
cost of €1.20 (when compared to €7.30 for the determination of HbA1c) and this would be the additional cost per patient, when compared to the diagnostic approach recommended
by the current guidelines (FGP + HbA1c).
Limitations
This has been a monocentric study and involved a selected small population with clinically relevant coronary heart disease – with an indication for angioplasty and therefore the results must be considered within this background. In addition, diagnostic tests for diabetes were not repeated, as recommended by the guidelines, suggesting that diagnosis should not be based on a single determination of blood glucose or HbA1c levels.
CONCLUSION
The approach recommended by the new guidelines only allows for the identification of 66.7% new patients with DM and a significant percentage of patients remains undiagnosed. The use of the FINDRISC score for the selection of patients with an indication for screening with OGTT allows for an improvement in diagnostic capability, when compared with the simple use of FPG together with the HbA1c level. However, 17% of these patients remained undiagnosed with the use of this approach, meaning that 1 in 6 patients remains undiagnosed. According with the results of this study and considering the impact of DM in the outcome of CHD, the identification of all the patients is crucial and the systematic use of the OGTT in all the patients with CHD and not previously diagnosed with DM should continue to be recommended.
HUMAN AND ANIMAL PROTECTION
The authors declare that the followed procedures were according to regulations established by the Ethics and Clinical Research Committee and according to the Helsinki Declaration of the World Medical Association.
DATA CONFIDENTIALITY
The authors declare that they have followed the protocols of their work centre on the publication of patient data.
CONFLICTS OF INTEREST
The authors declare that there were no conflicts of interest in writing this manuscript.
FINANCIAL SUPPORT
The authors declare that there was no financial support in writing this manuscript.
REFERENCES
1. Saudek CD, Herman WH, Sacks DB, Bergenstal RM, Edelman D, Davidson MB. A new look at screening and diagnosing diabetes mellitus. J Clin Endocrinol Metab. 2008;93:2447–53.
2. Harris MI. Undiagnosed NIDDM: clinical and public health issues. Diabetes Care. 1993;16:642–52.
3. Ryden L, Grant PJ, Anker SD, Berne C, Cosentino F, Danchin N, et
al. ESC Guidelines on diabetes, pre-diabetes, and cardiovascular diseases developed in collaboration with the EASD: the Task Force on diabetes, pre-diabetes, and cardiovascular diseases of the European Society of Cardiology (ESC) and developed in collaboratio. Eur Heart J. 2013;34:3035–87.
ARTIGO ORIGINAL
The prevalence of abnormal glucose regulation in patients with coronary artery disease across Europe. The Euro Heart Survey on diabetes and the heart. Eur Heart J. 2004;25:1880–90.
5. Wang JS, Lee IT, Lee WJ, Lin SY, Fu CP, Ting CT, et al. Performance of HbA1c and fasting plasma glucose in screening for diabetes in patients undergoing coronary angiography. Diabetes Care. 2013;36:1138–40. 6. Bartnik M, Malmberg K, Norhammar A, Tenerz A, Ohrvik J, Ryden L.
Newly detected abnormal glucose tolerance: an important predictor of long-term outcome after myocardial infarction. Eur Heart J. 2004;25:1990–7.
7. Doerr R, Hoffmann U, Otter W, Heinemann L, Hunger-Battefeld W, Kulzer B, et al. Oral glucose tolerance test and HbA(1)c for diagnosis of diabetes in patients undergoing coronary angiography: [corrected] the Silent Diabetes Study. Diabetologia. 2011;54:2923–30.
8. de Vegt F, Dekker JM, Ruhe HG, Stehouwer CD, Nijpels G, Bouter LM, et al. Hyperglycaemia is associated with all-cause and cardiovascular mortality in the Hoorn population: the Hoorn Study. Diabetologia. 1999;42:926–31.
9. Glucose tolerance and mortality: comparison of WHO and American Diabetes Association diagnostic criteria. The DECODE study group. European Diabetes Epidemiology Group. Diabetes Epidemiology: Collaborative analysis Of Diagnostic criteria in Europe. Lancet. 1999;354:617–21.
10. Ryden L, Standl E, Bartnik M, Van den Berghe G, Betteridge J, de Boer MJ, et al. Guidelines on diabetes, pre-diabetes, and cardiovascular diseases: executive summary. The Task Force on Diabetes and Cardiovascular Diseases of the European Society of Cardiology (ESC) and of the European Association for the Study of Diabetes (EASD). Eur Heart J. 2007;28:88–136.
11. Sacks DB. A1C versus glucose testing: a comparison. Diabetes Care. 2011;34:518–23.
12. Sattar N, Preiss D. HbA1c in type 2 diabetes diagnostic criteria: addressing the right questions to move the field forwards. Diabetologia. 2012;55:1564–7.
13. de Mulder M, Oemrawsingh RM, Stam F, Boersma E, Umans VA. Comparison of diagnostic criteria to detect undiagnosed diabetes in hyperglycaemic patients with acute coronary syndrome. Heart. 2012;98:37–41.
14. Baptista S, Abreu P, Gil V. Impact of glycosylated hemoglobin evaluation on the diagnosis of glucose metabolism abnormalities in patients with coronary artery disease. J Am Coll Cardiol. 2012;59:E1665.
15. Lindstrom J, Tuomilehto J. The Diabetes Risk Score: a practical tool to predict type 2 diabetes risk. Diabetes Care. 2003;26:725–31. 16. Classification and diagnosis of diabetes. Diabetes Care. 2016;39:S1–
112.
17. Relatório Anual do Observatório Nacional da Diabetes – “Diabetes: Factos e Números”, Edição de 2015. [consultado 2016 jun 16]. Disponível em: https://www.dgs.pt/estatisticas-de-saude/estatisticas-de-saude/publicacoes/diabetes-factos-e-numeros-7-edicao-pdf.aspx.
2015;
18. World Health Organization. Use of glycated haemoglobin (HbA1c) in the diagnosis of diabetes mellitus. [consultado 2016 jun 16]. Disponível em: http://www.who.int/diabetes/publications/diagnosis_diabetes2011/en/ index.html
19. Gillett MJ. International Expert Committee report on the role of the A1c assay in the diagnosis of diabetes: Diabetes Care. 2009; 32: 1327-34. Clin Biochem Rev. 2009;30:197–200.
20. Sourij H, Saely CH, Schmid F, Zweiker R, Marte T, Wascher TC, et al. Post-challenge hyperglycaemia is strongly associated with future macrovascular events and total mortality in angiographied coronary patients. Eur Heart J. 2010;31:1583–90.
21. ACCORD. Effects of intensive glucose lowering in type 2 diabetes. N Engl J Med. 2008;358:2545–59.
22. ADVANCE. Intensive blood glucose control and vascular outcomes in patients with type 2 diabetes. N Engl J Med. 2008;358:2560–72. 23. Mulvey CK, McNeill AM, Girman CJ, Churchill TW, Terembula K,
Ferguson JF, et al. Differential associations of oral glucose tolerance test-derived measures of insulin sensitivity and pancreatic beta-cell function with coronary artery calcification and microalbuminuria in type 2 diabetes. Diabetes Care. 2014;37:124–33.
24. Schutt M, Schmidt T, Schwaab B. Cardio-metabolic characterisation of patients with coronary heart disease: specific consideration of the 1-h postprandial plasma glucose. Exp Clin Endocrinol Diabetes. 2012;120:435–8.
25. Quagliaro L, Piconi L, Assaloni R, Martinelli L, Motz E, Ceriello A. Intermittent high glucose enhances apoptosis related to oxidative stress in human umbilical vein endothelial cells: the role of protein kinase C and NAD(P)H-oxidase activation. Diabetes. 2003;52:2795–804. 26. Azuma K, Kawamori R, Toyofuku Y, Kitahara Y, Sato F, Shimizu T, et
al. Repetitive fluctuations in blood glucose enhance monocyte adhesion to the endothelium of rat thoracic aorta. Arterioscler Thromb Vasc Biol. 2006;26:2275–80.
27. Quagliaro L, Piconi L, Assaloni R, Da Ros R, Maier A, Zuodar G, et al. Intermittent high glucose enhances ICAM-1, VCAM-1 and E-selectin expression in human umbilical vein endothelial cells in culture: the distinct role of protein kinase C and mitochondrial superoxide production. Atherosclerosis. 2005;183:259–67.
28. Tuomilehto J, Lindstrom J, Eriksson JG, Valle TT, Hämäläinen H, Ilanne-Parikka P, et al. Prevention of type 2 diabetes mellitus by changes in lifestyle among subjects with impaired glucose tolerance. N Engl J Med. 2001;344:1343–50.
29. Knowler WC, Barrett-Connor E, Fowler SE, Hamman RF, Lachin JM, Walker EA, et al. Reduction in the incidence of type 2 diabetes with lifestyle intervention or metformin. N Engl J Med. 2002;346:393–403. 30. Tabela de meios complementares de diagnóstico e terapêutica