CHEMICAL ANALYSIS OF PIGMENT PRODUCED BY
HALOALKALOTOLERANT BACTERIA PARACOCCUS
BEIBUENSIS SL2
Deepti D. Dhere
[a]*and S. M. Dharmadhikari
[b]Keywords:Paracoccus beibuensis; chemical analysis; pigment.
Paracoccus beibuensis SL2 is a halo-alkalotolerant bacteria isolated from Lonar Crater, Buldhana, Maharashtra, India and was identified by conventional and advanced techniques. The 16s rRNA sequence was deposited to NCBI GenBank with accession number KY129665. In recent studies the bright orange pigment produced by Paracoccus beibuensis SL2 was extracted and purified. The analysis of purified pigment was done by spectrophotometric method, chemical method, TLC, FT-IR and HPLC to know the chemical nature of pigment. The overall studies showed that bright orange pigment produced by Paracoccus beibuensis SL2 is a carotenoid group pigment which is mainly a xanthophyll pigment showing similar characters with that of Astaxanthin. It has a great commercial value as a natural colorant and therapeutic molecule.
*Corresponding Authors
E-Mail: [email protected]
[a] Deogiri College of Arts, Science and Commerce, Aurangabad, (M.S.), India
[b] Government College of Arts and Science, Aurangabad, (M.S), India
INTRODUCTION
Color is an indistinguishable character which decides aesthetic value of the matter. It is the first characteristic property perceived by senses. Color has been added to food to make it more attractive and appealing. Due to increased awareness about toxicity of synthetic colors, a demand for colors from natural origin has been increased and creating pressure to ‘go natural’. Natural colors can be derived from plants and plant products but they have seasonal variation, different geographical distribution and year around availability. The microbial pigments are promising alternative to other color additives extracted from vegetables or synthetic one because it poses no seasonal variation and show high production.
Microorganisms produce various pigments like carotenoids, melanin’s, flavins, monascins, violacein and indigo.1 In recent studies the chemical analysis of the pigment produced by Haloalkalotolerant bacteria
Paracoccus beibuensis SL2 was done. The recent studies focus on chemical characterization of bright orange pigment produced by Paracoccus beibuensis SL2.
MATERIALS AND METHODS
The bacteria used in this study was an orange pigment producing bacterium isolated from hypersaline-hyperalkaline soil collected from Lonar Crater, District-Buldhana, Maharashtra, India on nutrient agar (Himedia) with pH 8.5 and screened out of 105 pigmented isolates. The
isolate was identified as Paracoccus beibuensis SL2 by 16s rRNA sequencing approach at Agharkar Research Institute, Pune, Maharashtra, India and sequence was deposited to NCBI gen bank with Accession number KY 129665. The
Paracoccus beibuensis SL2was stored on nutrient agar slant pH 8.5 during experimental studies.
Production and extraction of the pigment
Production medium with composition: glucose 5 g L-1, meat extract 15 g L-1 and NaCl 10 g L-1 with pH 9.5 was used for production of pigment at shake flask level and fermenter level. The Paracoccus beibuensis SL2 was inoculated (1 %) in statistically optimized media having initial pH 9.5 and incubated at 30 °C for 72 h with shaking condition (120 rpm) in white light. The extraction was done by slight modification of the procedure used by Bhat et al.2 The centrifugation of culture medium was done to separate cells at 8000 rpm for 15 min. at 4 °C. Pellet obtained was washed twice with sterile distilled water by centrifugation at 8000 rpm for 10 min. The washed cell pellet was suspended in acetone and kept overnight for pigment extraction followed by centrifugation at 8000 rpm for 10 min. at 4 °C.
The acetone extract of pigment was dried using sodium sulphate and concentrated by using vacuum evaporation at room temperature in dark. The repartition was done by using two liquid phases i.e. petroleum ether and methanol which are immiscible. 2 mL of pigment concentrate was added in 5 mL petroleum ether and partitioned with equal volume of 90 % methanol followed by shaking in separating funnel. The mixture in separating funnel kept aside until two distinct layer appears i.e. epiphase and hypophase which were further analyzed for determining its chemical nature.
Chromatographic fractionation of carotenoids
similar polarity.3 A plastic syringe (20 mL) was used as column packed with silica gel 60 (60-120 mesh). The stationary phase was equilibrated by suspending in the mobile phase (hexane) by gently stirring until an even suspension was formed. Glass wool was introduced at the bottom of column and column was clamped in an upright position with the tap firmly closed. The suspension was then slowly added to the column while tapping the walls of the column gently to allow air bubbles to rise to the surface. The suspension was then allowed to settle, and the tap opened leaving the mobile phase to run out slowly until the height of the supernatant liquid reaches 2 cm above the column packing. To prepare the sample, the carotenoid extract was placed in an evaporating dish in dark till it is concentrated. The carotenoid extract was introduced as a concentrated liquid from the top of the column. The chromatogram was developed in a dark room to minimize the light’s decolorizing effect on the pigment. The first aliquot of mobile phase hexane was introduced, and the tap opened to adjust the flow. A flow rate of 1 mL min-1 was adjusted, as recommended for conventional column chromatography by Houghton and Raman.4 The mobile phase was allowed to move down through the column under gravity. The constituents of the extract moved through the column as bands. Separation of the carotenoid pigments was followed visually, and glass test tubes used to collect 2 mL aliquots of elute which were analysed spectrophotometrically.
Analysis of pigment by TLC
The silica gel TLC plates were used instead of simple glass slides. The marked TLC plates were then activated by placing in an oven at 80 °C for 20 min to drive off water molecules that were bonded to the polar sites on the plate. The TLC procedure was performed in dark room. The TLC plates were spotted by placing the narrow end of the capillary tube into a vial containing the pigment extract. The spotted samples were then resolved using a mobile phase (methanol: benzene: ethyl acetate 5:70:25). To develop the TLC plate, the solvent was poured into a chromatography chamber. The TLC plate was then introduced in the chromatography chamber and the plate left in the chamber until solvent had advanced to the top pencil line on the slide. The slide was then removed from the developing chamber and visualized. The immediate visualization was done by drying the TLC plates in air at room temperature followed by observation. The retention front (Rf) was calculated and compared with the Rf of the standards pigment.
Pigment identification
The carotenoid pigment identification was done by spectrophotometric analysis of acetone extract and chemical identification of chloroform extract of pigment. The absorption spectrum of purified pigment extract was measured within range of 400-600 nm using acetone as reference.
Chemical identification of the polyene group of carotenoids was done according to protocol for detection of carotenoid by Ajayi.5 For chemical identification, 1 g dry pellet of harvested cells was taken in dry tube and 10 mL of chloroform was added and shake vigorously. The resulting extract was filtered through Whatmann filter Paper No.1.
and then few drops of 85 % sulfuric acid were added and observed the presence of blue colored ring.
The FT-IR analysis was done to know the presence of IR bands of characteristic functional groups present with the carotenoid molecule extracted from Paracoccus beibuensis
SL2. The FT-IR analysis was carried out at Government Institute of Forensic science, Aurangabad. For FT-IR analysis drop of purified pigment was placed on the face of highly polished salt plate made with KBr and scanned within 400-500 nm for IR spectra at room temperature.
Purity of extracted pigment was confirmed by using HPLC (Jasco UV-2075 Plus) analysis. Prior to each analysis, samples were filtered through 0.45 μ Millipore disposable sterile syringe filters. The standard solutions were injected
first, followed by a 10 μL aliquot of the filtered extracted
carotenoid sample. The aliquots were loaded in a HPLC column C-l8, 250 mm x 4.6 mm column, 5 mm guard column and a diode array detector. The flux rate was maintained at 0.6 mL min-1 and the pressure at 0.30 psi. The mobile phase was a mixture of acetonitrile, methanol, and water in the proportion 47:47:16 at 30 °C. The degassing of solvent system was done before use by sonication for 10 min. The pigments were separated and analyzed by measuring the absorbance at 472 nm and peak identification were achieved by comparing the retention time of samples with the retention times of the standard pigment.
RESULT AND DISCUSSION
The acetone extract showed presence of bright orange pigment. The separation techniques are employed as non-chromatographic procedures because these are advantageous in large scale preparative work. These methods are precipitation methods which helps to remove major contamination of the solvents by lipids. For separation and purification of carotenoids polar and non-polar solvents are used which separate carotenoids in to polar and non-polar pigments This method is helpful for large preparative work and to facilitate the subsequent purification of pigment by separating contaminants.
According to Britton and Young,6 the phase separation involves partitioning of an extract between two immiscible solvent phases of different polarities. The most commonly used solvents are petrol hexane and aqueous methanol (90 %). The non-polar pigments, like carotene, carotene epoxides and esters are recovered in petrol hexane epiphase. The polar pigments like xanthophylls form the lower or hypophase. The most specific separation can sometimes be achieved by modifying the solvent composition.
Vallentyne7 elaborated that the reason for such classification is based on the structural basis of carotenes and xanthophylls, the former does not contain any hydroxyl group while the later contains two hydroxyl groups. Carotenoid pigment containing two or more hydroxyl groups occupied the hypophasic layer and those without hydroxyl group occupied the epiphase.7-9
Similar extraction studies were carried out by Bhat2 and Shatila.10 The absorption maxima of the pigment were found to be 450 nm, and 467 nm respectively which is characteristic of carotenoid pigment. Separation of crude carotenoid extract from Paracoccus beibuensis SL2 deduced that, extract contained both non-polar carotenes and the more polar xanthophylls. The concentration of xanthophyll pigment was highest as compared to epiphasic carotenes in low concentration. The spectra of epiphasic carotene layer did not showed characteristic absorption pattern of carotenes and hence, hypophasic xanthophyll pigment containing layer was subjected to further processing and purification.
Chromatographic fractionation of carotenoids and TLC analysis
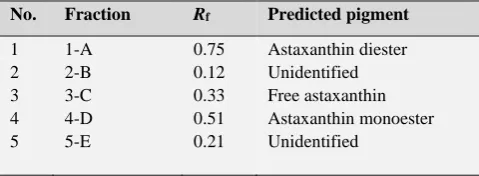
Isolation and purification of carotenoid was carried out using an open column chromatographic technique. Several fractions with differing polarity were obtained from open column chromatography. Spectrophotometry at 480 nm was then used to group the fractions into 5. The drawback experienced in open column chromatography was the time involved for elution. According to Houghton and Raman,4 the long retention time in open column chromatographic technique was attributed to the water present in the stationary phase. This was attributed to the slow flow rate of elution. The reported results confirmed that fractions 1, 3 and 4 were pure fractions of astaxanthin and Figure 2 shows the absorbance of fractions collected from OCC, measured at 480 nm. The collected fractions were pooled in the form of 5 fractions as represented in Table 1. This indicates that
Rf value of standard carotenoid pigment astaxanthin matches with fraction 1.
The pure fractions 1 from open column chromatography was further analyzed by UV-visible spectroscopy along with chemical identification, FT-IR and high-pressure liquid chromatography. Thin layer chromatography analysis was reported as an efficient monitoring process for qualitative identification purposes.4 However, the disadvantage observed in the present study was the degradation of pigment on the plate because of atmospheric exposure. Upon the identification of the thin layer chromatography bands, Rf value was determined (Fig. 3).
Table 1. Rf values of different fractions of pigment
No. Fraction Rf Predicted pigment
1 1-A 0.75 Astaxanthin diester
2 2-B 0.12 Unidentified
3 3-C 0.33 Free astaxanthin
4 4-D 0.51 Astaxanthin monoester
5 5-E 0.21 Unidentified
Pigment identification
Bridoux11 mentioned that, most of carotenoid pigment absorb light maximally at three wavelengths thus resulting in three peak spectra. Liakopoulou-Kyriakides et al.12 mentioned that carotenoid pigment absorbs light mainly in visible region between 400-500 nm; and the obtained absorption spectra can be used for the identification of pigment. Carotenoids that contain polyene system of 10 or 11 double bonds and shows three banded absorption spectra, in which the band of maximum intensity is located at an intermediate distance from the other two bands, thus form broad bands having fine details of a shoulder.13
According to Britton,3 conjugated ketocarotenoids such as canthaxanthin, astaxanthin and echinenone, the spectrum consists of broad single maximum having no defined structure. The acetone extract of pigment was analyzed by spectrophotometer within range 400-600 nm. The extracted pigment demonstrated the presence of shoulder region with maximum absorbance at 480 nm with single peak of ketocarotenoids (Fig. 1). From λmax value, this ketocarotenoid can be predicted as astaxanthin. Only one report on astaxanthin producing Paracoccus beibuensis SL2 is available which was isolated by Zheng et al.14 from marine water, China.
Figure 1. Spectral analysis of hypophasic pigment extract
The chemical identification of pigment extract was done by using pharmacological test for detection of carotenoid pigment as the spectrophotometric studies indicated presence of carotenoid pigments. In chemical identification, concentrated sulfuric acid gives blue-green or green-blue coloration at the interface of carotenoid extract and sulfuric acid which confirms presence of polyene group in pigment extract. The presence of polyene group confirms carotenoid nature of the pigment.
In order to understand functional groups present in pigment, FT-IR analysis of pigment was performed. The purified fraction of pigment was subjected to FT-IR analysis. The Figure 6 shows IR spectrum with major peaks at 3380, 3506, 1739, 1647, 1516 and 1349 cm-1 . The majority of peaks obtained on analysis showed close resemblance to ketocarotenoids. Peaks at 1739 cm-1 is due to >C=O and peaks at 3380 and 3506 cm-1 are for -OH group. The absorption in the region of 3200-2200 cm-1 are normally characteristic of carbon and hydrogen containing species and can be assigned to various forms of C-H stretching. The absorption above 3000 cm-1 suggest that the compound is likely to have unsaturated -C=C-. The absorption showing broad peak at 3380 cm-1 i.e. region of 3380-3506 cm-1 mainly occurs for -OH group. The additional intense bonds in 1647 and 1349 cm-1 confirms that compound consist of C=C and C-C.
The structural confirmation by IR analysis in concurrence with UV-visible analysis and reported on chemical test infer that the produced pigment is exclusively close to ketocarotenoid all aspects. Similar studies were carried out by Korumilli et al.16 for structure of β-carotene extracted from Bacillus clausii.
Analysis of ketocarotenoid pigment by HPLC
HPLC analysis of extracted and purified pigment from strain SL2 showed presence of five peaks first four peaks were identical to peaks showed by standard carotenoid- astaxanthin. The first peak at retention time 3 min. was for all trans-astaxanthin and is major constituent of the pigment extract (Fig.7). The rest of peaks are showed asymmetrical spectra and predicted as 9-cis-astaxanthin and 13-cis-astaxanthin. According to Britton,2 in addition to the all-trans form, carotenoids tend to isomerize and form a mixture of mono-and poly-cis isomers in homogenous solutions, where, stereochemical and energetic state decides the isomer pattern. Any compound is more resistant to isomerization when it is incorporated into the food. In general, the all-trans form of carotenoids are more rigid and most stable thermodynamically which occur predominantly in nature.
The pigment produced by Paracoccus beibuensis SL2 strain was predicted as carotenoid -astaxanthin. The resulted spectra were also compared with the similar studies carried out for astaxanthin identification by Dalal et al.,17 where, astaxanthin extracted from Spingomonas astaxanthinifaciens
was identified by HPLC and showed retention time 3 min. for all trans-astaxanthin.
Figure 2. HPLC analysis of the purified pigment
The fractions showing λmax at 480 nm were identified as carotenoid-astaxanthin, by comparing these samples to the retention times of the standard carotenoid-astaxanthin.
Paracoccus beibuensis SL2 produces the carotenoid pigment i.e. astaxanthin as major carotenoid. Production of astaxanthin by this isolate was found to be substantive enough to prompt its biotechnological applications in the food, feed, pharmaceutical and nutraceuticals as a natural colorant.
CONCLUSION
In these studies, after extraction, separation and purification of carotenoid extract was done by using polar-non-polar solvent systems followed by open column chromatography and TLC. Majority of pigment was accumulated in lower polar alcoholic phase suggest the presence of xanthophyll group pigments. The analysis of purified extract by spectrophotometry between 400-500 nm showed one peak spectra with broad shoulder region with absorption maxima at 480 nm in acetone which is similar to carotenoid pigment-astaxanthin. FT-IR analysis of the hypophasic layer showed presence of conjugated double bonds C=C-), keto group (>O=C) and hydroxyl group (-OH) which again confirms xanthophyll nature of the pigment. HPLC analysis showed major peak at 3 min. which matches with peak of standard astaxanthin. From all theses it is concluded that Paracoccus beibuensis SL2 produces carotenoid pigment called astaxanthin.
Acknowledgement
Authors are thankful to Director, Government Institute of Science, Aurangabad, and Principal, Deogiri College, Aurangabad, Maharashtra, India for their valuable support.
This paper was presented at the “International Symposium on Exploring New Horizons in Chemical Sciences”, January 10–12, 2019, Aurangabad, India (ENHCS–2019).
REFERENCES
1Dufosse, L., Pigments, Microbial. Encyclopedia Microbiol. 2009,
vol. 4, 457-471. https://doi.org/10.1016/B978-012373944-5.00155-3
2Bhat, M. R., Thankamani M., Media optimization, Extraction and
Partial Characterization of an Orange Pigment from
Salinococcus sp. MKJ997975. Int. J. Life Sci. Pharm. Res., 2015, 4(2), 85-89.
3Britton, G., Structure and properties of carotenoids in relation to
function, FASB J., 1995, 9, 1551-1558.
https://doi.org/10.1096/fasebj.9.15.8529834
4Houghton, P. J., Raman, A., Laboratory handbook for fractionation of natural extract, 1st edition. Chapman and Hall, London, 1998.
5Ajayi, I. A., Ajibade, O., and Oderinde, R. A., Preliminary
phytochemicals analysis of some plant seeds, Res. J. Chem. Sci., 2011, 1, 58-62
6Britton G. and Young, A., “Carotenoids in photosynthesis”
7Vallentyne, J. R., Epiphasic carotenoids in post-glacial lake
sediments, Limnol. Oceanogr., 1956, 1, 252-262.
https://doi.org/10.4319/lo.1956.1.4.0252
8Karrer, P. and Jucker, E., Carotenoids. Elsevier Publishing
Company Inc., New York, Amsterdam, London, Brussels,
1950.
9Fogg, G. E., and Belcher, J. H., Pigments from the bottom
deposits of an English lake. New Phytol., 1961, 60, 129-142.
https://doi.org/10.1111/j.1469-8137.1961.tb06246.x
10Fatima, S., Yusef, H., and Hanafy, H., Pigment production by Exiguobacterium aurantiacum FH, a novel Lebanese strain.
Int. J. Curr. Microbiol. Appl. Sci., 2013, 2(12), 176-191.
11Bridoux, M. C. Algal biomarkers and their metabolites in lower food web of the great lakes, analyzed by HPPDA/FL, LC-MS and GC-LC-MS. Ph.D. Thesis, Albany State University of New York, Proquest, USA, 2008.
12Liakopoulou-Kyriakides, M. and Kyriakidis, D. A., Croccus sativus- biological active constituents. In: Studies in Natural Products Chemistry: Bioactive Natural Products.Vol.26, part C, Ur-Rahman A (Ed.), Elsevier. Amsterdam, 2002. p. 293-312. https://doi.org/10.1016/S1572-5995(02)80009-6
13Fieser, L. F. Absorption spectra of carotenoids, structure, of
vitamin A2. J. Org. Chem., 1950, 15, 930-943.
https://doi.org/10.1021/jo01151a003
14Zheng, Q., Yanan, W., Chen, C., Wang, Y., Xia, X., Fu, Y., Zang,
R., Jiao, N., Paracoccus beibuensis sp. nov., isolated from South China Sea, Curr. Microbiol., 2011, 62, 710-714.
https://doi.org/10.1007/s00284-010-9768-1
15Mrak E. M., Phaff H. J. and Mackinney, G., A simple test for
carotenoid pigments in yeasts. J. Bacteriol., 1949, 57, 409-411.
16Korumilli T. and Mishra, S., Carotenoid production by Bacillus clausii Using Rice Powder as sole substrate: Pigment analysis and Optimization of Key Production Parameters, J. Biochem. Tech., 2014, 5(4), 788-794.
17Dalal, A., Beppu T. and Ueda, K., Spingomonas jaspsi sp. nov., a
novel carotenoid producing bacteria isolated from Misasa, Tottori, Japan, Int. J. Syst. Evol. Microbiol., 2007, 57, 1435-1441, https://doi.org/10.1099/ijs.0.64828-0