AN EXPERIMENTAL EVALUATION OF THE BENEFITS
OF AUTOMATED QUANTIFICATION OF CONSTRUCTION
WORKS
Ogunsina, Olusola & Ugochukwu, Stanley
Chukwudi
Lecturer , Department of Quantity Surveying,
Nnamdi Azikiwe University, Awka, Nigeria.
Udoye, Arthur Richards
Degree student,
Department of Quantity Surveying, Nnamdi Azikiwe University,
Awka, Nigeria.
ABSTRACT
The purpose of this research is to show empirically that the benefits of automating the quantification of construction works exceed the costs of acquiring the automation technology tool. Using an experimental design, 30 entry level quantity surveyors from a university in South Eastern Nigeria were provided with the hard copies of the architectural and structural engineering drawings of a residential duplex. The volunteers were asked to quantify and bill two items from the substructure of the residential duplex using manual quantification and billing process and their adding machines. The time taken for each of them to perform the task was recorded. In the second round of the experiment, the volunteers were asked to redo the quantification and billing task using a semi-automation technology tool - a Microsoft Excel spreadsheet that has been customized for quantification and billing of construction works. Again the time taken to perform the task was recorded. Using Statistical Package for the Social Sciences (SPSS), student t test was deployed to test the hypothesis that there is no difference in time expended performing the tasks using the manual and automated processes. The findings show that the automation of the manual process reduces the time taken to perform the task by 32.4%. Using a realistic earning situation of a freelancing quantity surveyor, the value of this time savings within a year period is estimated to be over 400% of the cost of acquiring the computer hardware and software needed for quantifying and billing construction works. The limitations of the study such as the choice of only two excavation items for the experiment should be borne in mind in applying the findings. The use of the same set of 30 volunteers for the manual and automated experiments constitutes another limitation. The study therefore shows that it is anti-cost effective to continue to deploy manual quantification and billing processes. To this end, the paper concludes with an appeal to Nigerian quantity surveyors to consider the adoption of information technology tools in their practices.
Key Words:
Automated quantification, Taking - off, Manual quantification, Information technology, Nigeria1.
INTRODUCTION
drawings. These quantities, as well as the unit rates of the quantified items (obtained via an estimating\rate analysis process) constitute a significant part of the bill of quantities (BOQ) for the project. The BOQ describes the quality, gives the quantity as well as the cost of constituent items of a proposed construction project. It forms the basis upon which tenders for construction projects are received. It is basically a realistic estimate of the proposed project (Seeley, 1999; Nigerian Institute of Quantity Surveyors (NIQS), 2003).
The measurement and quantification of construction works takes a considerable amount of time depending on the complexity and scope of the proposed project (Selinger and Stamler,1983). The time consuming nature of project quantification is exacerbated by performing the entire operation manually. Adoption of information technology (IT) tools has been touted as a solution to the shortcomings of the manual quantification of construction works (Oladapo, 2007). IT has been defined as a collective reference to integration of computing technology and information processing and comprises a wide range of technical approaches to a variety of problems (El-Ghandour and Al-Hussein, 2004). In construction, Flangan and Jewell (2003) stressed that IT is the application of decision support tools which uses electronic machines and programs for processing, storage, analysis, control, transfer and presentation of construction information during the whole life cycle of the construction project.
Information technology covers both IT automation and IT integration (Zhai, Goodrum, Haas, and Caldas, 2009). IT Automation has been defined as the use of an electronic or computerized tool by a human
being in order to manipulate
or produce a product and IT integration as the sharing of information between project
participants or melding ofinformation sourced from separate systems( Zhai, Goodrum, Haas, and Caldas, 2009). Thus, an automated technique means that each stage of an operation is done by a computer program (Wilderspin, 1988). It is considered a means of reducing the burden and resolving the lapses of manual analysis by an expert system.
Information Technology is a vital tool used widely in industries to improve productivity and efficiency. Bresnen and Marshall (2001) found that increased automation and integration usage may contribute significantly to project performance in terms of cost and schedule success. Automation technology has a significant potential of influencing both company and project performance in the construction industry too. In an era in which construction firms attempt to implement projects with the least cost, shortest possible time and the highest attainable quality, failure to embrace available automation tools will never lead to this desired increase in project efficiency (Kang, O’Brien, Thomas and Chapman,2008).
Researchers have shown that information technology tools have not been properly utilised and implemented in the construction industry of developing countries compared to their developed counterparts (Ahuja , Yang and Shankar,2009). In Nigeria for instance, Oni (2003) argues that the rate of adoption of IT has been low and slow compared to most other industries despite the information intensive nature of the industry. He also noted that practitioners lack comprehensive IT strategy. The Quantity Surveying profession in Nigeria is arguably one of the worst hit professions by dearth of IT usage. Anecdotal evidence suggests that the Nigerian Quantity Surveyor (QS) whose distinctive contribution to project delivery lies in the production of cost and price information for built asset procurement has not been enthusiastic in taking full advantage of the opportunities offered by information technology in carrying out some of his professional duties such as taking-off and estimating. This is so despite the purported benefits associated with the adoption of IT.
Experiences suggest that the reluctance of quantity surveyors in Nigeria to adopt information technology tools stems from the absence of demonstrated benefits of IT usage. This resonates with the review-inspired observation of Marsh and Flanagan (2000) that many contractors and consultants experience difficulties in identifying and quantifying the benefits from investments in IT. Granted researches such as Oyediran and Odusanmi, 2005; Oladapo, 2006; and Oladapo, 2007 have been done with respect to IT usage in the Nigerian construction industry, none of these research efforts has presented a cost – benefit baseline for the adoption of IT tools by quantity surveyors. Using an experimental approach, the work reported herein is an attempt at measuring empirically the benefits accruable to quantity surveyors when an IT automation tool is deployed for the task of quantifying construction works.
The aim of this research is to provide a cost – benefit analysis baseline for the adoption of information technology by quantity surveyors in Nigeria. To this end, the specific objectives include:
To assess the productivity of quantity surveyors using an automation technology tool.
To assess the productivity of quantity surveyors without the use of an automation tool.
To compare the computer-aided productivity of quantifying quantity surveyors to manually generated productivity.
Present a cost -benefit analysis argument in support of the adoption of IT tools by quantity surveyors.
2.
CONCEPTUAL FOUNDATIONS
2.1
The Relevance of IT Tools to Quantity Surveying Tasks
The creation, rehabilitation and maintenance of built asset require the services of construction professionals such as architects, builders, engineers and surveyors. Nkado and Meyer (2001) argue that the essence of a quantity surveyor’s membership of a built asset procuring team is to protect the financial and contractual interest of the client. In order to achieve this, quantity surveyors perform two broad functions: they provide independent, accurate, objective and reliable capital and operating cost assessments usable for investment funding and project control; they analyse investment and development for the guidance of owners, financiers and contractors (ICEC, 2002). Underlying these two broad functions is a skill: the capability to create cost and price information for the procurement and management of capital facilities. Tasks associated with cost information production include measurement and quantification of projects using drawings and specifications as input as well as unit price computation of quantified work items. Unit price analysis of construction work items gets input from other cost information production tasks like the survey of current market prices of materials, labour and equipment productivity information logging of materials, labour and equipment\plant; and market intelligence gathering about the construction economic climate of the projects location.
Professional quantity surveyors can present cost\price information produced in different formats to clients, contractors and project financiers. A popular means of presenting project cost\price information is the bill of quantities (BOQ). The bills of quantities itemises work items that constitute a construction project. The bill shows the description or specification of these items, their quantities, and unit of measurement, unit prices and the amount of money for each item. Without the prices of the work items, the BOQ is an important document for inviting tenders from contractors (Kodikara, Thorpe and Mccaffer, 1993).
Table 1. Cost information production task \ Information Technology Tool Matrix Cost Information Production
Tasks
Description of Cost Information production Task
Information Technology Tools Adoptable 1 Measurement and Quantification The computation of the quantities of
the work items that have to be completed to finish a project.
Masterbill, Cost X, QSPlus, CATO, QScript, Generic computer spreadsheets like Microsoft Excel. 2 Unit price computation\Rate analysis Assessing the likely cost of the work
items that constitute the project
Masterbill, Cost X, QSPlus, CATO, QScript, Microsoft Excel.
Out of the two tasks in table 1, quantification and measurement is the most time consuming (Selinger and Stamler,1983). Traditional quantification and measurement of construction works involves other subtasks like description of work items, taking off or quantity take-off of the items, squaring, abstracting and billing of the work items (Cartlidge, 2009). The work items in a bill of quantities are often described according to the rules set forth in a standard method of measurement. Examples of such method of measurement include the Nigerian Building and Engineering Standard Method of Measurement, third edition (BESMM3), the UK-originated Standard Method of Measurement of Building Works, seventh edition (SMM7). The quantity take-off part of measurement involves determining the quantities of the work items using a specially ruled paper called the dimension paper or taking-off sheet.
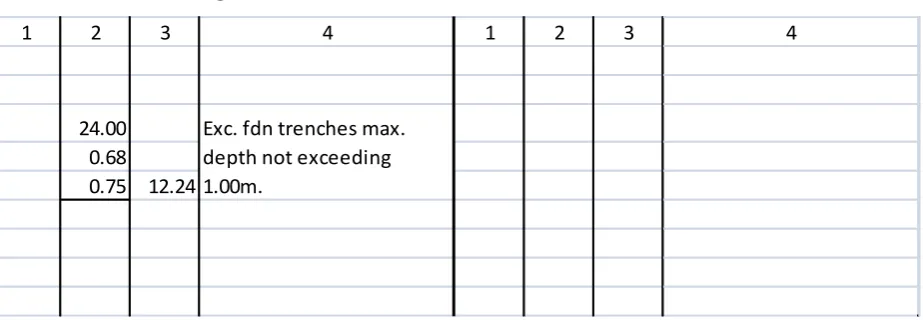
Table 2 illustrates a typical dimension paper. The dimensions of the different work items are read or calculated from the drawings and entered on the dimension column (column 2) of the taking –off sheet following measurement conventions specified in the SMM. The SMM-derived description of the work items are written in the description column (column 4) of the taking –off paper. Squaring involves the computation of the volumes, areas, lengths and number of the work items and entering the computed quantities in the squaring column (column 3) of the dimension paper. Column 1 in table 2 is called the timesing column, for it allows the taker-off to enter the number of repeat or identical work items.
Table 2. Traditional taking off-sheet
1
2
3
4
1
2
3
4
24.00
0.68
0.75 12.24
Exc. fdn trenches max.
depth not exceeding
1.00m.
bill. The use of abbreviation such as “exc. fdn. trenches” meaning “excavate foundation trenches” ceases at this point. The items are written out in full in the final bill of quantities format.
Given the fact that a typical construction project is often made up of hundreds of work items, it is evident from the foregoing review that manual quantification and measurement of construction works is a very labourious and time consuming task. Yet it is an inescapable part of producing cost information. Adopting information technology tools could reduce the labour and time associated with this task.
2.2
Benefits of IT Adoption for Nigerian Quantity Surveyors
The benefits of adopting information technology for leveraging processes associated with construction project delivery have been the focus of a number of studies. Zhai, Goodrum, Haas and Caldas (2009) investigated the relationship between jobsite productivity across four trades and the automation and integration of various work functions on some sampled projects. The findings indicated that labour productivity was positively related to the use of automation and integration technology on the selected projects. Using a survey, Yang (2009) examines the correlation between the quality of project deliverables and automation adoption. The results show that the quality of project deliverables is significantly associated with automation usage at the front end, design, procurement and construction phases. Lautanala, Enkovaara , Heikkonen and Taiponen (2004) list benefits of IT adoption within the Finish construction industry to cover improved quality, reduced throughput time , improved customer satisfaction , improved employees motivation and improved cooperation with partners in addition to direct cost savings. Not only are these studies outside Nigeria, they are conducted without the context of the quantity surveying profession.
Increase in demand for value-added services and prompt completion of construction projects at reduced cost by client (Akintoye, 2001), complexity of modern construction infrastructure (Page et al., 2004) are factors that favour the adoption of IT in carrying out quantity surveying tasks . According to Oladapo, (2006) as well as Oyediran and Odusami,(2005) , the benefits accruing to quantity surveyors from deploying information technology tools include:
Availability of up to date information, even amongst parties who are very far apart. For the Quantity Surveyor, this translates to having the latest rate of materials, inflation index, exchange rate etc.
Reduction in time spent on tasks and eliminating unnecessary or unproductive use of materials resources. Ensures substantial saving in cost of service delivery.
Enables tedious jobs to be executed faster, reliably and with greater accuracy. Creates greater opportunities for innovations.
Elimination of drudgery by reliving workers of the burden of performing repetitive tasks such as calculations involved in tender analysis or bill of Quantities.
Improving productivity by achieving the optimum efficiency of the machine.
Despite these benefits, anecdotal evidence suggests that a number of quantity surveyors are still buried in the use of manual processes for creating cost information. Interactions with some of these professionals reveals the problem: they are sceptical about the much touted time and cost saving benefits associated with the adoption of information technology tools. This raises the question that informs this research: Do productivity gains associated with IT adoption exceed the cost of the software acquisition? Using an experimental design outlined in the next section, we set out to answer this question and test the hypothesis:
The time taken to quantify and bill a construction work item using an automation technology tool is not significantly different from the time taken using a manual process.
3.
RESEARCH DESIGN AND METHOD
prepare the draft bill of quantities for two items in the substructure of a residential duplex. The entry level quantity surveyors were final year students in quantity surveying from a university in South Eastern Nigeria. In the first round of the experiment, the volunteers did the quantification and billing of the two work items using the automation tool - Microsoft Excel. The two work items are trench excavation and excavation of column bases. The time taken for each person to complete the task was recorded. In the second round, the volunteers repeated the task, preparing the draft bill manually. The time taken for the manual preparation of the bill was also recorded. The objective was to assess the productivity gains associated with the use of the automation tool for quantifying and billing the two work items.
As a means of assessing the accuracy of the quantities generated by the entry level quantity surveyors who participated in the experiment, baseline quantities for the two selected substructure items were generated manually and automatically by one of the authors. The intention is to compare the mean of the quantities generated by the experimental quantity surveyors to this baseline quantity. Should a wide variation exist, there would then be a need to examine the individual quantities generated by the entry level quantity surveyors with a view to identify and eliminate outliers.
In analyzing the data gathered from the research, Stastistical Package for Social Sciences ( SPSS ) was deployed. The specific test statistic used is the student t-test was used. The student t-test is used to compare the mean difference or the difference between the mean scores of two samples or two sets of data (Naoum, 1998). It is thus a statistical tool which is used to assess whether there is a mean difference between two groups of data and to establish whether such differences are significant or statistically different. It is suitable when the data is an integer type and the problem is to compare the mean.
When interpreting the SPSS output of t-test computations, under the “t-test for Equality of Means” look at “Sig. (2-tailed)” for “Equal variances not assumed”. If the score or value shown is more than the alpha value of 0.05, it is concluded that there is no significant difference between the means of the two groups. However, if the Sig (2-Tailed) value is less than or equal to 0.05 it is concluded that there is a statistically significant difference between the two conditions and thus the inference is that the differences between the means are not likely due to chance but are probably due to the manipulation.
4.
DATA PRESENTATION, ANALYSIS AND DISCUSSION.
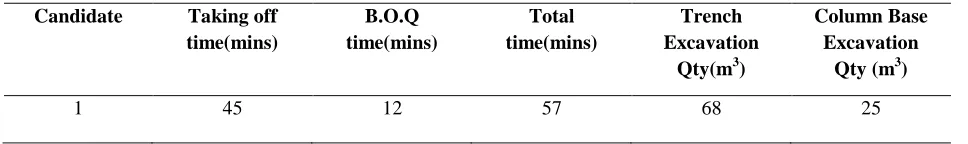
Tables 3 and 4 show the baseline quantities for the two selected items – trench excavation and column base excavation. As expected of the quantities generated by an expert, the quantities are the same regardless of whether they are produced by manual or automated quantification process. Table 4 captures the data obtained from quantifying and billing the two substructure items manually, that is without the aid of an automation tool. Table 5 shows the data when automation tools are deployed. Table 6 shows the time savings resulting from the use of automation tools in bill production.
Table 3. Baseline Quantity using Manual Bill Production Process.
Candidate Taking off time(mins)
B.O.Q time(mins)
Total time(mins)
Trench Excavation
Qty(m3)
Column Base Excavation
Qty (m3)
Table 4. Baseline Quantity using Automated Bill Production Process.
Candidate Time(mins) Trench (m3) Pit (m3)
1 35 68 25
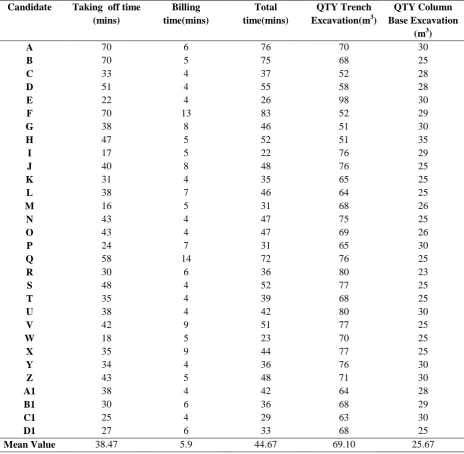
Table 5.Time Expenditures for Manual Bill Production Process.
Candidate Taking off time (mins)
Billing time(mins)
Total time(mins)
QTY Trench Excavation(m3)
QTY Column Base Excavation
(m3)
A 70 6 76 70 30
B 70 5 75 68 25
C 33 4 37 52 28
D 51 4 55 58 28
E 22 4 26 98 30
F 70 13 83 52 29
G 38 8 46 51 30
H 47 5 52 51 35
I 17 5 22 76 29
J 40 8 48 76 25
K 31 4 35 65 25
L 38 7 46 64 25
M 16 5 31 68 26
N 43 4 47 75 25
O 43 4 47 69 26
P 24 7 31 65 30
Q 58 14 72 76 25
R 30 6 36 80 23
S 48 4 52 77 25
T 35 4 39 68 25
U 38 4 42 80 30
V 42 9 51 77 25
W 18 5 23 70 25
X 35 9 44 77 25
Y 34 4 36 76 30
Z 43 5 48 71 30
A1 38 4 42 64 28
B1 30 6 36 68 29
C1 25 4 29 63 30
D1 27 6 33 68 25
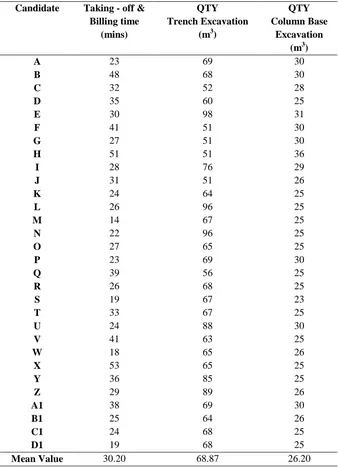
Table 6. Time Expenditures for Automated Bill Production Process.
Candidate Taking - off & Billing time
(mins)
QTY Trench Excavation
(m3)
QTY Column Base
Excavation (m3)
A 23 69 30
B 48 68 30
C 32 52 28
D 35 60 25
E 30 98 31
F 41 51 30
G 27 51 30
H 51 51 36
I 28 76 29
J 31 51 26
K 24 64 25
L 26 96 25
M 14 67 25
N 22 96 25
O 27 65 25
P 23 69 30
Q 39 56 25
R 26 68 25
S 19 67 23
T 33 67 25
U 24 88 30
V 41 63 25
W 18 65 26
X 53 65 25
Y 36 85 25
Z 29 89 26
A1 38 69 30
B1 25 64 26
C1 24 68 25
D1 19 68 25
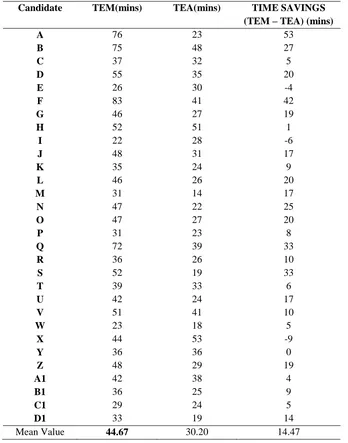
Table 7. Comparative Time Analysis of Manual and Automated Bill Production Processes
Candidate TEM(mins) TEA(mins) TIME SAVINGS (TEM – TEA) (mins)
A 76 23 53
B 75 48 27
C 37 32 5
D 55 35 20
E 26 30 -4
F 83 41 42
G 46 27 19
H 52 51 1
I 22 28 -6
J 48 31 17
K 35 24 9
L 46 26 20
M 31 14 17
N 47 22 25
O 47 27 20
P 31 23 8
Q 72 39 33
R 36 26 10
S 52 19 33
T 39 33 6
U 42 24 17
V 51 41 10
W 23 18 5
X 44 53 -9
Y 36 36 0
Z 48 29 19
A1 42 38 4
B1 36 25 9
C1 29 24 5
D1 33 19 14
Mean Value 44.67 30.20 14.47
Where:
TEM is time expended using manual bill production process. TEA is time expended using automated bill production process.
4.1
T-Test analysis of manual and automated performances.
Table 8. Group Statistics
Mean N Std Deviation Std error of Mean
Pair 1: M time A time
44.67 30.20
30 30
15.45 9.73
Table 9. Paired sample test Paired differences
95% confidence interval Mean Std deviation Std error
lower upper t d.f sig(2-t) Pair 1 M time-A time
14.47 15.45 3.33 7.77 21.17 4.34 29 0.00
df = degree of freedom
4.2
Discussion
Tables 3 and 4 show that the quantities of the two work items, trench excavation and column base excavation, generated by one of the authors are the same regardless of whether they are produced by manual or automated quantification process. For an expert, this is expected. Perhaps automation does not necessarily improve the accuracy of quantities generated by experts, but it does save experts some precious time. The baseline quantities are needed to assess the reliability of the mean experimental quantities. The mean experimental quantities arising from the manual bill production process are 69.1 cubic metres and 25.67 cubic metres for the trench and column base excavation respectively. For the automated bill production process, the mean experimental quantities are 68.87 cubic metres and 26.20 for trench excavation and column base excavation respectively. The two set of quantities are very close to the baseline quantities of 68 cubic metre for trench excavation and 25 cubic metres for column base excavation as evident from Table 2 or 3. To this end, we accept the experimental quantities as reliable enough for the purpose of this research.
An inspection of table 5 shows that the quantification part of the bill production process takes more than six times the time the bill drafting process takes. The use of a Microsoft Excel bill drafting template to automate the bill production process eliminates the billing part of the bill of quantities production process. This is evident from Table 6. The mean time expended for the quantification and billing of the two items is even less than the time expended for the manual quantification of the items only.
The SPSS output in table 8 shows that the mean manual time is 44.67 minutes while the mean automated time is 30.20 minutes. Consequently the mean time savings accruing from the automation of the bill production process is 14.47 minutes. In view of the Sig (2-tailed) value of 0.00 (table 9) which is less than the set alpha value of 0.05, the hypothesis that specifies no difference between the two means is thus rejected. We conclude then that quantifying and billing construction work items with a computer-aided tool saves a statistically significant amount of time. How does these time saving fare in the light of the cost of acquiring software within the Nigerian environment? The cost benefit analysis argument is presented in the next section.
4.3
The cost\benefit analysis argument: Valuing the time saving induced by adopting an
automation technology tool.
We believe that our estimate of the earning of an entry level freelancing quantity surveyor is very conservative. They are borne out of our experience of what clients and contractors pay to quantity surveyors in the informal sector of the economy in the south eastern part of Nigeria where the experimental study was carried out. The earning per hour of professional quantity surveyors derived from the professional scale of fees is far greater than the ₦625 per hour used in the analysis above. We avoided the use of earning per hour derived from professional scale of fees because the subjects of the experimental study were entry level quantity surveyors and not professional quantity surveyors. In other words our analysis has been based on the worst earning scenario.
5.
CONCLUSION
The Quantity Surveying profession is cost sensitive and deals with a large number of information. It is due to these unique characteristics that the profession must embrace the use of information technology - automation and integration - tools for performing quantity surveying tasks. Using an experimental design, this study has demonstrated that replacing manual quantification process with an automated quantification process could reduce the time invested in performing quantification of construction works by as much as 32.4%. Using a one man quantity surveying start-up as a case example, the study goes further to show the monetary worth of this time saving. Investing in computer hardware and software for doing quantification and billing of construction works will produce a 400% returns on investment within a one year period. The study has therefore demonstrated the benefits of deploying information technology for a category of quantity surveying works.
However, the following limitations and opportunities for improvement should be borne in mind in replicating the study or in applying its findings. While it can be argued that the two items selected for the quantification experiment are representative of construction work items quantified by quantity surveyors in terms of difficulty, future researches will do well to increase the number of items selected across all construction trades. Rather than using entry level quantity surveyors, future researches could use practising quantity surveyors. Furthermore it will be a more rigorous research to use different groups of volunteers for each quantification approach. The current study used the same set of volunteers for the computer aided quantification and the manual quantification. This might have interfered with the time taken for the second round quantification of the items ,given the first round That specialised tools are more productive than generic tool is an axiomatic knowledge within the business world. Against this backdrop, we believe the productivity gains associated with the use of specialised quantity surveying software like WINQS, COSTX and others will be more that the productivity gains accruable from the use of generic spreadsheet like Microsoft Excel. To this end, it will be a worthy research to evaluate the benefits of deploying specialised software for quantification and billing purposes. In conclusion we recommend to practising quantity surveyors to deploy at least computers and generic spreadsheets in their offices . The benefit outweighs the cost of acquisition.
6.
REFERENCES
[1] Ahuja, V., Yang, J., and Shankar, R. 2009. Study of ICT adoption for building project management in the Indian Construction Industry. Automation in Construction, 29, 275 -283.
[2] Bresnen, M., and Marshall, N. 2001. Understanding the diffusion and application of new management ideas in construction. Engineering Construction and Architectural Management, 21(3),225 – 231.
[3] Cartlidge, D.2009. Quantity Surveyor’s Pocket Book. Oxford, UK: Elsvier Ltd.
[4] El-Ghandour, W., and Al-Hussein, M. 2004. A survey of information technology applications in construction.
Construction Innovation: Information, Process, Management, 4, 83-98.
[5] Flangan, R., and Jewell, C. 2003. A review of recent works on construction future. UK: RICS.
[7] ICEC. 2002. What are cost engineering, quantity surveying and project mangement? A white paper downloaded from www.icoste.org./wp-content/uploads/2011/05
[8] Kang, Y., O’Brien, W. J., Thomas, S., and Chapman, R. E. 2008. Impact of information technology on performance: A cross study comparison. Journal of Construction Engineering and Management, 8, 12 – 18.
[9] Kodikara, G.W., Thorpe, A., and Mccaffer , R.(1993).The use of Bills of Quantities in building contractor’s organisation. Construction Management and Economics, 11, 261-269.
[10]Marsh, L. and Flanagan, R. 2000. Measuring the costs and benefits of information technology in construction.
Engineering, Construction and Architectural Management, 20(7), 4, 423-435.
[11]Naoum, S.G. 1998. Dissertation research and writing for construction students. Oxford: Butterworths-Heinemann.
[12]Nigerian Institute of Quantity Surveyor (NIQS). 2003. Services of the Quantity Surveyor- A handbook of the NIQS. Lagos: NIQS.
[13] Nkado, R.N. 2000. Competencies required by quantity surveyors in South Africa. Proceedings of the
Association of Researchers in Construction Management (ARCOM). UK: Glasgow Caledonian University
[14] Nkado, R.,N., and Meyer, T .2001.Competencies of Professional Quantity Surveyors : A South African Perspective. Construction Management and Economics 19, 481-491.
[15]Oladapo, A. A.2006. The impact of ICT professionalpractice in the Nigerian construction industry.
Electronic Journal of Information Systems in Developing Countries (EJISDC), 11, 27 - 31.
[16]Oladapo, A., A. 2007. An investigation into the use of ICT in the Nigerian Construction Industry. Journal of
Information Technology in Construction, 12, 261 – 277.
[17]Oni O. M. 2003. Information technology and the procurement process in the Nigerian Construction Industry: Use, impact and strategy. Lagos: NIQS.
[18]Oyediran, O.S., and Odusami, K.T. 2005. A study of computer usage by Nigerian quantity surveyors.
International Journal of Information and communication Technology, 16(2) 45 – 51.
[19]Page, M., Pearson, S., and Pryke, S. 2004. Innovative and current practice in large UK quantity Surveying firms- A RICS Foundation Research Paper Series. UK: RICS.
[20]Royal Institution of Chartered Surveyors (RICS). 1998. The future role of the quantity surveyor. The Chartered
Quantity Surveyor, 1(2), 17 – 19.
[21]Seeley, I.H. 1999. Building quantities explained. GBR: Palgrave Macmillan
[22]Selinger, S. And Stamler, H. 1983. Computerized method for quantity surveying. Construction Management
and Economics 1, 75- 87.
[23]Wilderspin, M. 1988.Adopting a strategic approach to IT implementation.The Quantity Surveyor, 38(5),5 – 9.
[24]Zhai, D. ,Goodrum P.,M., Haas. C., T., and Caldas, C., H.2009. Relationships between Automation and Integration of Construction Information Systems and Labour Productivity. Construction Engineering and