93
© 2017 by the Serbian Biological Society How to cite this article: Chen Z, Lou J. Identification and expression of the trehalose-6-phosphate synthase gene family members in tomato exposed to different light spectra. Arch Biol Sci. 2017;69(1):93-101.
Identification and expression of the trehalose-6-phosphate synthase gene family
members in tomato exposed to different light spectra
Zexiong Chen and Juan Lou*
College of Forestry and Life Science, Chongqing University of Arts and Sciences, Chongqing 402160, China
*Corresponding author: [email protected]
Received: March 25, 2016; Revised: June 13, 2016; Accepted: July 26, 2016; Published online: September 21, 2016
Abstract: Light is the source of energy for plants. Light wavelengths, densities and irradiation periods act as signals
direct-ing morphological and physiological characteristics durdirect-ing plant growth and development. To evaluate the effects of light wavelengths on tomato growth and development, Solanum lycopersicum (cv. micro-Tom) seedlings were exposed to dif-ferent light-quality environments, including white light and red light supplemented with blue light (at ratios of 3:1 and 8;1, respectively). Tomatoes grown under red light supplemented with blue light displayed significantly shorter stem length, a higher number of flower buds and rate of fruit set, but an extremely late flowering compared to white-light-grown plants. To illustrate the mechanism underlying the inhibition of stem growth and floral transition mediated by red/blue light, 10 trehalose-6-phosphate synthase (TPS) genes were identified in tomato, and bioinformatics analysis was performed. qRT-PCR analysis showed that SlTPSswere expressed widely throughout plant development and SlTPS1 was expressed at extremely high levels in stems and buds. Further analysis of several flowering-associated genes and microRNAs showed that the expressions of SlTPS1, SlFT and miR172 were significantly downregulated in tomato grown under red and blue light compared with those grown under white light, whereas miR156 transcript levels were increased. A regulatory model underlying vegetative growth and floral transition regulated by light qualities is presented. Our data provide evidence that light quality strongly affects plant growth and phase transition, most likely via the TPS1-T6P signaling pathway.
Key words: TPS; light wavelength treatments; vegetative growth; floral transition; tomato
IntRoduCtIon
Plants are exposed to various environmental condi-tions constantly. The most dramatic variation is in the daily rhythm under a light-dark cycle. Irradiative changes could be perceived by red- and blue-light photoreceptors and gene expression was regulated in plants in response to various light environments [1,2]. Phytochromes are biliprotein photoreceptors that respond to different light wavelengths; they are responsive to changes in light quality and quantity, light direction and period length, enabling plants to respond optimally to changed light conditions [3]. Light acts as signals regulating seed germination, seedling establishment, the proper development of photosynthetic machinery, the architecture of the vegetative plant, the timing of flowering, tuberiza-tion, bud dormancy, and potentially the allocation of resources to root, stem, leaf, and storage organs. The phytochromes also display regulatory functions
mediating light responses, such as growth inhibition, leaflet or organelle movement and phototropism. The recent discovery of phytochrome-related proteins in photosynthetic cyanobacteria and nonphotosynthetic eubacteria has opened new avenues for investigating biliprotein photosensory function [3].
T6P, found only in trace amounts in most plants, has been suggested as the signaling molecule that trans-duces messages of carbohydrate availability to other sig-naling pathways [7]. TPS1 loss-of-function mutants are embryonic-lethal [8]. Embryo defects in tps1 mutants can be rescued by TPS1 overexpression in seeds, but the seedlings develop slowly and senesce before enter-ing into the reproductive phase [9]. Elevatenter-ing TPS1 in
tps1-2 mutants results in a delayed floral transition [10]. These results indicated that TPS1 is required for the initiation of flowering. Further evidence showed that the T6P pathway regulated floral transition at two sites in the plant: the leaves and the shoot apical meristem (SAM) [11]. In the leaves, TPS1 induces the FLOWER-ING LOCUS T (FT) gene, which is then transported to the SAM and promotes floral formation; T6P acts as an indicator of a plant’s carbon status in the SAM [11]. To study the effects of different combinations of light wavelengths on tomato growth and development, micro-Tom(Solanum lycopersicum) seedlings were ex-posed to different light-quality environments, including white light and red LEDs supplemented with blue light. Interestingly, tomato grown under red LEDs supple-mented with 1:3 or 1:8 blue light displayed shorter stem length and an extremely late flowering compared to those of white-light-grown plants. To further explore the regulatory mechanism, 10 SlTPS that may partici-pate in energy fluency were identified and investigated at the transcription level during the processes of plant vegetative and reproductive development and in re-sponse to changes in light quality. Our data provided the evidence that different light qualities have strongly significant effects on plant growth and phase transition.
MAteRIAls And Methods
Plant materials and light treatments
Tomato (Solanum lycopersicum cv. Micro-Tom) plants were grown in a standard culture chamber under the following conditions: 16/8 h day/night cycle, 23ºC, 80% relative humidity. The light density was adjusted to 2000 µmol s-1m-2 via the methods for determining light density according to Thimijan [12]. Seeds were sterilized, germinated in 1/2 MS medium for 7 days, and then seedlings of similar sizes were transplanted to pots containing nutrient soil.
To evaluate the effects of light quality (spectral distribution of light) on tomato growth, the seedlings were exposed to different light conditions: white light and red light supplemented with blue light (red/blue-light photosynthetic photon flux density (PPFD) ra-tios were 3:1 and 8:1, respectively). Three types of LEDs were used: InGaN/YAG white LEDs (color tem-perature of 6500K), red gallium-aluminum-arsenide (GaAlAs) LEDs and InGaN blue LEDs. Red and blue LEDs have a peak emission at 660 nm and 450-470nm, respectively. Seedlings under white light were desig-nated as the control.
Identification of tomato tPs genes
The TPS full-length cDNA sequences of Arabidopsis
were obtained from the nucleotide database of NCBI (http://www.ncbi.nlm.nih.gov/nucleotide/) and the corresponding amino acid sequences were also ob-tained. To identify new homologues in tomato, the complete cDNA and protein sequences of TPS gene families in Arabidopsis were subjected to BLASTN and TBLASTN searches against SGN tomato WGS chromosomes (version SL2.40) (http://solgenomics. net/tools/blast) [13]. Taken together, 10 potential TPS genes in tomato were identified from the currently available genomic databases.
Bioinformatic analyses of tomato tPs genes
After searching for SlTPSs, the bioinformatics tool FGENESH (http://linux1.softberry.com/berry) was used to analyze and predict those unknown SlTPSs. A conserved domain database (http://www.ncbi.nlm.nih. gov/Structure/cdd/) was used for functional annotation of the proteins. Deduced amino acid sequences of SlTPSs were aligned with the homologous proteins in Arabidop-sis using ClustalX 2.0 software in the default setting. A phylogenetic tree was constructed using the MEGA (ver-sion 5.0) software by the neighbor-joining (N-J) method.
RnA isolation and quantitative real-time PCR
was treated with DNase I (Fermentas, Thermo, USA) to remove contaminating genomic DNA. First-strand cDNA was reverse transcribed from 2 μg of total RNA using the RevertAid™ First Strand cDNA synthesis kit (Fermentas, Thermo, USA) according to the manufac-turer’s instructions. Quantitative real-time PCR (qRT-PCR) was conducted on a CFX Connect Detection system (Bio-Rad, USA). PCR amplification reactions were performed in a 20-μL mixture containing 10 μL of FastSYBR Mixture (CWBIO, China), 2.5 ng of total RNA and 1 μL each of the forward and reverse primers (5 μM). PCR detection were performed by the three-step method: incubation at 95°C for 5 min, followed by 40 cycles at 95°C for 5 s, 60°C for 5 s and 72°C for 5 s. Relative expression levels were calculated based on the 2-ΔΔCt method. Actin (Slactin-51, accession number Q96483) was used as the reference gene for expression analysis of 10 TPS and FT genes.
To investigate the expression of miRNAs, poly(A) was added to the total RNA using Escherichia coli
poly(A) polymerase (NEB, UK) at 37°C for 30min and then reverse transcription was performed and adaptor was added with an oligo(dT) adapter primer (AAGCAGTGGTATCAACGCAGAG-TACTTTTTTTTTTTTTTTTTTTTTTVN) [14]. U6
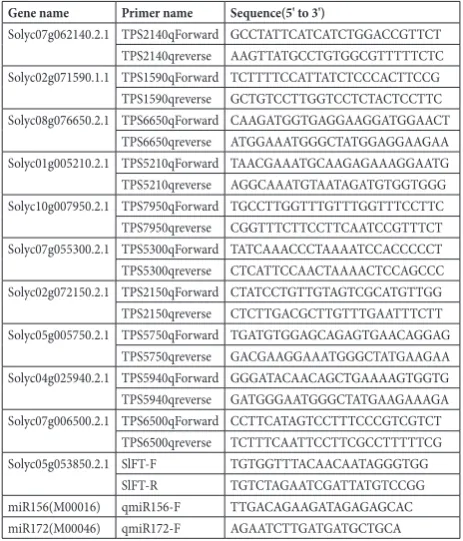
(accession number X51447.1) was used as reference gene for expression analysis of miRNA. Gene acces-sion numbers and primers for qRT-PCR are listed in Table 1. For all qRT-PCR experiments, at least three biological replicates were performed and each reaction was run in triplicate.
Results
Identification and multiple sequence analysis of sltPs genes
In total, 10 SlTPS genes were identified via the BLAST search against the tomato genome sequence. Based on multiple alignments of TPS protein sequences in
Arabidopsis and tomato, the SlTPS protein families clustered into three subfamilies/subclasses. three TPS proteins (Solyc02g072150.2.1, Solyc10g007950.2.1 and Solyc07g055300.2.1) showed close homol-ogy to AtTPS7, while Solyc01g005210.2.1 and Soly-c08g076650.2.1 displayed high similarity to AtTPS5
and AtTPS6, respectively. The five TPS gene homo-logs mentioned above belonged to subclass I. It was found that Solyc07g006500.2.1 was most closely ho-mologous to AtTPS11, while Solyc05g005750.2.1 and Solyc04g025940.2.1 were more closely homologous to AtTPS8, AtTPS9 and AtTPS10 genes, which belonged to subclass II. Two TPS proteins (Solyc07g062140.2.1 and Solyc02g071590.1.1), belonged to subclass III, and have high sequence similarity with AtTPS1 (Fig. 1).
expression patterns of sltPs genes in different tissues and organs
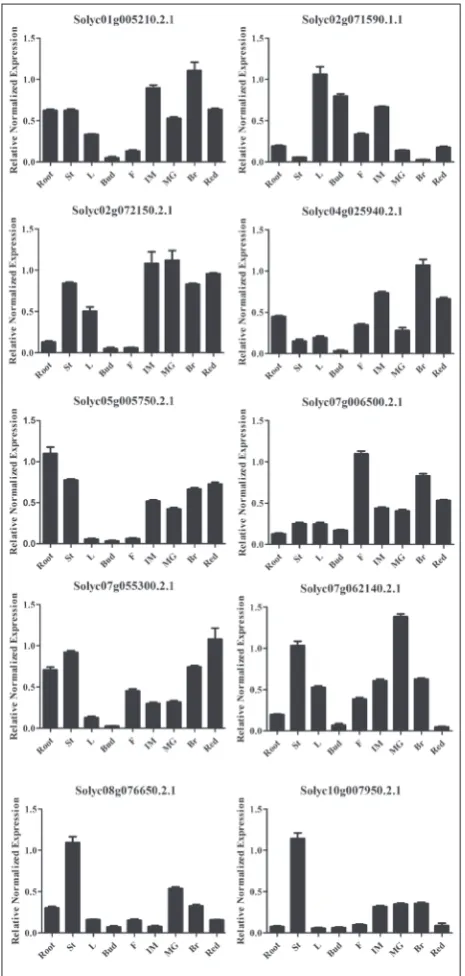
To investigate the potential functions of SlTPS genes, their expression profiles were determined by qRT-PCR in different tissues including root, stem (St), leaf (L), bud, flower (F) and four stages of fruit de-velopment. It is apparent that SlTPSs were widely ex-pressed throughout the plant development (Fig. 2). Compared with other tissues, the 10 SlTPS genes in fruits were expressed at relatively high levels, and their expression patterns during fruit development and rip-ening could be divided into three types. The tran-scripts of four genes including Solyc07g062140.2.1, Solyc02g071590.1.1, Solyc08g076650.2.1 and Soly-table 1. Primers for qPCR.
Gene name Primer name sequence(5' to 3')
Solyc07g062140.2.1 TPS2140qForward GCCTATTCATCATCTGGACCGTTCT
TPS2140qreverse AAGTTATGCCTGTGGCGTTTTTCTC
Solyc02g071590.1.1 TPS1590qForward TCTTTTCCATTATCTCCCACTTCCG
TPS1590qreverse GCTGTCCTTGGTCCTCTACTCCTTC
Solyc08g076650.2.1 TPS6650qForward CAAGATGGTGAGGAAGGATGGAACT
TPS6650qreverse ATGGAAATGGGCTATGGAGGAAGAA
Solyc01g005210.2.1 TPS5210qForward TAACGAAATGCAAGAGAAAGGAATG
TPS5210qreverse AGGCAAATGTAATAGATGTGGTGGG
Solyc10g007950.2.1 TPS7950qForward TGCCTTGGTTTGTTTGGTTTCCTTC
TPS7950qreverse CGGTTTCTTCCTTCAATCCGTTTCT
Solyc07g055300.2.1 TPS5300qForward TATCAAACCCTAAAATCCACCCCCT
TPS5300qreverse CTCATTCCAACTAAAACTCCAGCCC
Solyc02g072150.2.1 TPS2150qForward CTATCCTGTTGTAGTCGCATGTTGG
TPS2150qreverse CTCTTGACGCTTGTTTGAATTTCTT
Solyc05g005750.2.1 TPS5750qForward TGATGTGGAGCAGAGTGAACAGGAG
TPS5750qreverse GACGAAGGAAATGGGCTATGAAGAA
Solyc04g025940.2.1 TPS5940qForward GGGATACAACAGCTGAAAAGTGGTG
TPS5940qreverse GATGGGAATGGGCTATGAAGAAAGA
Solyc07g006500.2.1 TPS6500qForward CCTTCATAGTCCTTTCCCGTCGTCT
TPS6500qreverse TCTTTCAATTCCTTCGCCTTTTTCG
Solyc05g053850.2.1 SlFT-F TGTGGTTTACAACAATAGGGTGG
SlFT-R TGTCTAGAATCGATTATGTCCGG
miR156(M00016) qmiR156-F TTGACAGAAGATAGAGAGCAC
c10g007950.2.1 were decreased following fruit rip-ening, while Solyc07g055300.2.1 showed the reverse pattern, indicating their potential roles in fruit ripen-ing. In addition, other TPS genes were consistently expressed at relatively high levels throughout fruit developmental stages. With respect to floral organs, all TPS genes were expressed at extremely low levels in floral buds with the exception of Solyc02g071590.1.1, which was strongly expressed in leaf and bud. Four genes (Solyc07g055300.2.1, Solyc07g006500.2.1, Soly-c04g025940.2.1 and Solyc07g062140.2.1) upregulated remarkably during the flowering process. With re-spect to the vegetative organs, there were 7, 2 and 1 TPS genes expressed at extremely high levels in stems, roots and leaves, respectively (Fig. 2).
effects of light quality on floral transition in tomato
The vegetative and reproductive growth of tomato under different irradiation sources after a 50-day
cul-ture after germination was investigated. The morpho-logical and physiomorpho-logical characteristics of at least 30 plants, including flowering time, length of internodes, number of flower buds and the rate of fruit set, were observed and collected. The results showed that the flowering time was significantly delayed in tomato Fig. 1. Phylogenetic analysis of TPS proteins. The phylogenetical
tree was generated using MEGA5.0 program by the neighbor-join-ing method. The accession numbers of TPS genes in Arabidopsis were as follows. AtTPS1 (AT1G78580.1), AtTPS2 (AT1G16980.1), AtTPS3 (AT1G17000.1), AtTPS4 (AT4G27550.1), AtTPS5 (AT4G17770.1), AtTPS6 (AT1G68020.2), TPS7 (AT1G06410.1), AtTPS8 (AT1G70290.1), AtTPS9 (AT1G23870.1), AtTPS10 (AT1G60140.1), AtTPS11 (AT2G18700.1).
seedlings grown under red light supplemented with blue light compared with those grown under white light. The tomato grown under red and blue light (at a ratio of 3:1) flowered at approximately 46 days post germination (dpg), and 40 dpg in plants under white light (Table 2). Meanwhile, the flowering ra-tio significantly differed under different irradiara-tion sources and various blue to red LED ratios. Statisti-cal analysis showed that 13/15 buds flowered under
white light at 50 dpg, but only 2/15 buds flowered under 75% red and 25% blue LEDs (3:1). There were no flowers observed in seedlings under red and blue LEDs (8:1 ratio) (Table 3). However, these seedlings restated their floral transition later when transferred to white light conditions at 50 dpg. In terms of veg-etative growth, the lengths of two internodes below the first flowering branch were distinctly shortened in seedlings under 75% red and 25% blue LEDs com-pared to controls (Fig. 3). Interestingly, we observed that the plants grown under red and blue LEDs (3:1 ratio) produced more flower buds and the rate of fruit set was significantly increased compared to those in seedlings under white light treatment (Fig. 4).
expression of flowering-associated genes and microRnAs
TPS gene families play important roles in plant growth regulation, especially TPS1. According to the abovementioned results, Solyc02g071590.1.1 showed homology to AtTPS1, and was named SlTPS1-1.
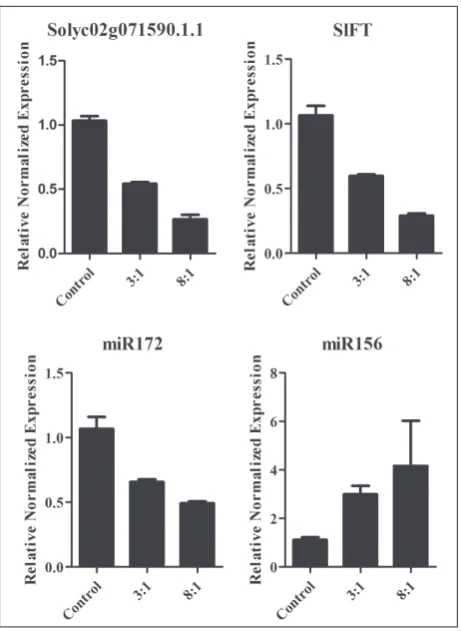
SlTPS1-1 was strongly expressed in flower buds, sug-gesting a potential important role in the initiation of flowering. To reveal the molecular mechanism un-derlying whether floral transition was regulated by light quality, the transcripts of SlTPS1-1 and floral transition-related genes or microRNA, such as FT,
miR172 and miR156, were determined by qRT-PCR in tomato plants under different light treatments. The expressions of SlTPS1-1, SlFT and miR172 were sig-nificantly downregulated in tomato grown under red and blue LEDs (at 3:1 and 8:1 ratios) compared with table 2. Floral timing in tomatoes grown under environments
with different light-quality. At least 30 plants were investigated for each treatment.
light treatments Flowering time (Mean dpg) se P value
White light 40.25 0.3541 N
Red LEDs and 1:3 blue light 46.34 0.4267 <0.0001
dpg − days post germination. SE − standard error.
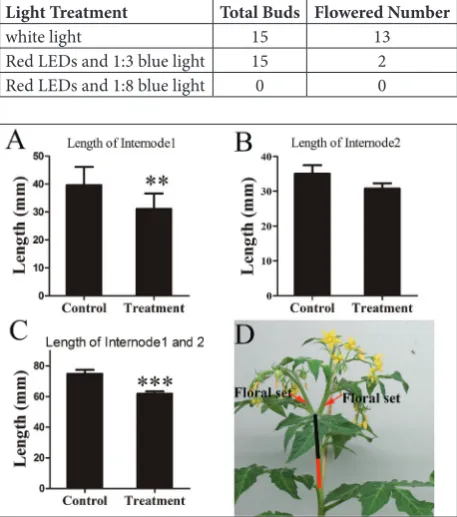
table 3. Flowering ratio in seedlings grown under environments with different light-quality 50 days post germination.
light treatment total Buds Flowered number
white light 15 13
Red LEDs and 1:3 blue light 15 2
Red LEDs and 1:8 blue light 0 0
Fig. 3. Internode lengths in tomato seedlings grown under dif-ferent light-quality environments.Control − white-light-grown plants, Treatment − seedlings grown under red LEDs and 1:3 blue light environment, internode 1 − the first internode below flowering branch (black bar), and internode 2 − the second in-ternode below flowering branch (red bar). Student’s t-test was used to analyze the significance. One asterisk (*) − significant (0.01<p<0.05) differences between samples, two asterisks (**) − significant (0.001<p<0.01) differences between samples, and three asterisks (***) − significant (p<0.001) differences between samples.
those grown under white light, whereas miR156 tran-script levels were obviously increased (Fig. 5).
dIsCussIon
Light provides an energy source for the plants via pho-tosynthesis, and reception of the light signal is crucial for optimizing plant growth and reproduction. About 150 years ago, scientists noticed that different light wavelengths could result in different energy conver-sion efficiency [15]. In many species, red light has the highest quantum yield for CO2 fixation among vari-ous light wavelengths in the photosynthetically active region (PAR) of the spectrum (400-700 nm, which includes green and blue light) [16,17]. In view of the high photosynthetic quantum yield derived from red light, high-efficiency red LEDs have been used to
pro-duce optimal light environments for photosynthesis and the growth of plants. Combinations of different light wavelengths were also proved to enhance quan-tum yields [18]. Interestingly, consistent treatment with red light alone resulted in poor photosynthetic performance, which is converse to the opinion that red light is the most efficient energy source [19-22]. Actually, carbon utilization during plant development does not merely depend on carbon assimilation. For example, carbon starvation treatment for even short periods leads to growth inhibition, which cannot be recovered immediately after carbon supplementation [23], indicating that there might be a time difference between energy status energy sensing. The plants may evolve a regulation mechanism to perceive sugar sig-nals and cope with the various environments.
There is mounting evidence that trehalose-6-P (T6P) is an important sugar signal in plants [7,24,25]. T6P is synthesized by TPS which belongs to a small gene family [25]. There are 11 TPS genes in Arabi-dopsis, which were clustered into two subfamilies: Class I TPSs (TPS1, TPS2, TPS3 and TPS4) and Class II TPSs (TPS5, TPS6, TPS7, TPS8, TPS9, TPS10 and
TPS11) [26]. Among the TPS genes in Arabidopsis, only TPS1 shows demonstrable TPS activity [27], and mutation of tps1 in Arabidopsis resulted in embryo maturation defects along with abnormalities through-out vegetative growth and floral transition [10]. In this study, two SlTPS1-like genes (Solyc02g071590.1.1 and Solyc07g062140.2.1) were identified in tomato, similar to those reported in rice [28]. Interestingly, Solyc02g071590.1.1 (SlTPS1-1) was shown to be highly expressed in leaves, while other SlTPSs were not (Fig. 2), indicating that SlTPS1-1may act as a key player in energy sensing in tomato.
Previous studies showed that different light qual-ity has a distinct effect of on morphologic charac-teristics during plant growth and reproduction. In strawberry, stem elongation was promoted and in-hibited under red and blue light, respectively. Plantlets cultured under 70% red+30% blue showed higher leaf and root number, higher plant height and root length, and greater fresh and dry weight compared to those cultured under 90% red+10% blue and 80% red+20% blue. Goins et al [20] reported that wheat grown under red LEDs alone displayed greater main culm length, fewer subtillers and a lower seed yield on harvest day Fig. 5. Expression of flowering-associated genes and microRNAs.
compared to white-light-grown plants, while wheat grown under red LEDs supplemented with 10% blue light produced a seed yield close to that of white light. However, we observed that tomato grown under red LEDs supplemented with 1/3 blue light demonstrated shorter internodes (Fig. 3), but higher flower numbers and rates of fruit set (Fig. 4) compared to those of white-light-grown plants. These results suggest that there is an optimal threshold level for blue light for optimal growth and reproduction under a red-based light source, which might depend on plant species. It has been demonstrated that flowering time was delayed significantly under red LEDs and blue light treatment (Table 2), especially in the tomato under higher ratios of red to blue light (Table 3).
To illustrate the mechanism underlying the regula-tion of vegetative growth and floral transiregula-tion via light wavelength, the energy signaling pathway-associated gene SlTPS1-1 was investigated at the transcription level. The results showed that SlTPS1-1 was down-regulated significantly (Fig. 5), indicating that TPS-related sugar sensing and signaling pathways were significantly suppressed in tomato plants grown un-der red LEDs. The FT gene integrates several external and endogenous cues controlling flowering, with FT
protein moving directly from the leaves to the shoot apex, behaving as a long-distance signal [31]. Previous studies suggested that the SPL gene, as downstream targets of FT, function in the control of flowering time and phase change. Here, FT was downregulated in tomato grown under red and blue light (Fig. 5), which can delay flowering via affecting SPL expres-sion [29]. miR156 was considered as an age marker in plants, downregulated with increasing plant age [29]. miR172 was proved to be as a miR156 antagonist on regulating phase transition in plants [30]. Compared to white light grown plants, the expressions of miR156 and miR172 were upregulated and downregulated, respectively (Fig. 5), in tomato plants grown under red LEDs supplemented with blue light. This might be the reasons that the vegetative phases were main-tained and flowering was inhibited in tomato plants grown under higher ratios of red/blue light. The up-regulation of miR156 in tomato grown under red/blue light would suppress the expression of SPL, the target of miR156 [32], and subsequently inhibit flowering in an FT-independent manner [29]. Recent research demonstrated the correlation of sugar signaling and miR156 expression and their roles in regulating the floral pathway. It showed that T6P was able to modu-Fig. 6. A hypothesized model for the regulation of vegetative growth and floral transition by light
late the expression of the targets of miR156, partially via the miR156-dependent age-related pathway [11].
Finally, a regulatory mechanism underlying TPS1 functions on plant vegetative and reproductive growth via energy signaling pathway mediated by red/blue light, and eventually influencing the growing of the plant, was hypothesized (Fig. 6). When tomato plants were grown under white light, TPS1 were expressed at higher levels in order to produce abundant sugars as a carbon source. Higher levels of TPS1 suppressed the expression of miR156, which could promote plant aging and lead to fast growth and floral transition. On the contrary, when tomato plants were exposed to high ratios of red to blue light, TPS1 expression were down-regulated to accommodate CO2 assimilation because of an increased net leaf photosynthesis rate, and there-fore miR156 expression was upregulated. Subsequently, higher levels of miR156 suppressed the transcripts of SPL gene and resulted in delayed flowering.
ConClusIon
In this work, defects in phase transition including juvenile-to-adult transition and vegetative-to-repro-ductive phase transition were observed in tomatoes grown in environments under a high ratio of red to blue light. The key regulator in energy status sensing,
SlTPS1, was downregulated in plants grown in the presence of red and blue light as compared to those grown under white light. This indicates that an imbal-ance in light source would affect the energy sensing pathway, thereby modulating miR156, miR172 and
SlFT, and eventually inhibiting vegetative growth and floral transition.
Authors’ contribution: Juan Lou designed the experiment and wrote the manuscript, Zexiong Chen and Juan Lou performed all the experiments.
Conflict of interest disclosure: We declare that we do not have any commercial or associative interest that represents a conflict of interest in connection with the work.
ReFeRenCes
1. Schaffer R, Landgraf J, Accerbi M, Simon V, Larson M, Wis-man E. Microarray analysis of diurnal and circadian-regu-lated genes in Arabidopsis. Plant Cell. 2001;13(1):113-23.
2. Tepperman JM, Hudson ME, Khanna R, Zhu T, Chang SH, Wang X, Quail PH. Expression profiling of phyB mutant demonstrates substantial contribution of other phyto-chromes to red-light-regulated gene expression during seed-ling de-etiolation. Plant J. 2004;38(5):725-39.
3. Smith H. Phytochromes and light signal perception by plants − an emerging synthesis. Nature. 2000;407(6804):585-91. 4. Srikanth A, Schmid M. Regulation of flowering time: all
roads lead to Rome. Cell Mol Life Sci. 2011;68(12):2013-37. 5. Koch KE. Carbohydrate-Modulated Gene Expression in
Plants. Annu Rev Plant Physiol Plant Mol Biol. 1996;47:509-40. 6. Cabib E, Leloir LF. The biosynthesis of trehalose phosphate.
J Biol Chem. 1958;231(1):259-75.
7. Lunn JE, Feil R, Hendriks JH, Gibon Y, Morcuende R, Osuna D, Scheible WR, Carillo P, Hajirezaei MR, Stitt M. Sugar-induced increases in trehalose 6-phosphate are correlated with redox activation of ADP glucose pyrophosphorylase and higher rates of starch synthesis in Arabidopsis thaliana. Biochem J. 2006;397(1):139-48.
8. Eastmond PJ, van Dijken AJ, Spielman M, Kerr A, Tissier AF, Dickinson HG, Jones JD, Smeekens SC, Graham IA. Treha-lose-6-phosphate synthase 1, which catalyses the first step in trehalose synthesis, is essential for Arabidopsis embryo maturation. Plant J. 2002;29(2):225-35.
9. Gomez LD, Gilday A, Feil R, Lunn JE, Graham IA. AtTPS1-mediated trehalose 6-phosphate synthesis is essential for embryogenic and vegetative growth and responsiveness to ABA in germinating seeds and stomatal guard cells. Plant J. 2010;64(1):1-13.
10. van Dijken AJ, Schluepmann H, Smeekens SC. Arabidop-sis trehalose-6-phosphate synthase 1 is essential for normal vegetative growth and transition to flowering. Plant Physiol. 2004;135(2):969-77.
11. Wahl V, Ponnu J, Schlereth A, Arrivault S, Langenecker T, Franke A, Feil R, Lunn JE, Stitt M, Schmid M. Regulation of flowering by trehalose-6-phosphate signaling in Arabidopsis thaliana. Science. 2013;339(6120):704-7.
12. Thimijan ,R. W., and R.D. Heins. Photometrics, radiometric and quantum light units of measure: A review of procedures for interconversion. HortScience. 1983;18(6):818-822 13. The tomato genome sequence provides insights into fleshy
fruit evolution. Nature. 2012;485(7400):635-41.
14. Xian Z, Huang W, Yang Y, Tang N, Zhang C, Ren M, Li Z. miR168 influences phase transition, leaf epinasty, and fruit development via SlAGO1s in tomato. Journal of experimen-tal botany. 2014;65(22):6655-66.
15. Hoover WH. The dependence of carbon dioxide assimila-tion in a higher plant on wavelength of radiaassimila-tion. Smithson Inst Misc. 1933;95:1-13.
16. McCree KJ. Significance of enhancement for calculations based on the action spectrum for photosynthesis. Plant Physiol. 1972;49(5):704-6.
19. Brown CS, Schuerger AC, Sager JC. Growth and photomor-phogenesis of pepper plants under red light-emitting diodes with supplemental blue or far-red lighting. J Am Soc Hortic Sci. 1995;120(5):808-13.
20. Goins GD, Yorio NC, Sanwo MM, Brown CS. Photo-morphogenesis, photosynthesis, and seed yield of wheat plants grown under red light-emitting diodes (LEDs) with and without supplemental blue lighting. J Exp Bot. 1997;48(312):1407-13.
21. Yorio NC, Goins GD, Kagie HR, Wheeler RM, Sager JC. Improving spinach, radish, and lettuce growth under red light-emitting diodes (LEDs) with blue light supplementa-tion. HortScience. 2001;36(2):380-3.
22. Matsuda R, Ohashi-Kaneko K, Fujiwara K, Kurata K. Effects of blue light deficiency on acclimation of light energy parti-tioning in PSII and CO2 assimilation capacity to high irradi-ance in spinach leaves. Plant Cell Physiol. 2008;49(4):664-70. 23. Smith AM, Stitt M. Coordination of carbon supply and plant
growth. Plant Cell Environ. 2007;30(9):1126-49.
24. Schluepmann H, Pellny T, van Dijken A, Smeekens S, Paul M. Trehalose 6-phosphate is indispensable for carbohydrate utilization and growth in Arabidopsis thaliana. Proc Natl Acad Sci U S A. 2003;100(11):6849-54.
25. Kolbe A, Oliver SN, Fernie AR, Stitt M, van Dongen JT, Geigenberger P. Combined transcript and metabolite pro-filing of Arabidopsis leaves reveals fundamental effects of
the thiol-disulfide status on plant metabolism. Plant Physiol. 2006;141(2):412-22.
26. Leyman B, Van Dijck P, Thevelein JM. An unexpected pleth-ora of trehalose biosynthesis genes in Arabidopsis thaliana. Trends Plant Sci. 2001;6(11):510-3.
27. Blazquez MA, Santos E, Flores CL, Martinez-Zapater JM, Salinas J, Gancedo C. Isolation and molecular characteriza-tion of the Arabidopsis TPS1 gene, encoding trehalose-6-phosphate synthase. Plant J. 1998;13(5):685-9.
28. Zang B, Li H, Li W, Deng XW, Wang X. Analysis of tre-halose-6-phosphate synthase (TPS) gene family suggests the formation of TPS complexes in rice. Plant Mol Biol. 2011;76(6):507-22.
29. Wang JW, Czech B, Weigel D. miR156-regulated SPL tran-scription factors define an endogenous flowering pathway in Arabidopsis thaliana. Cell. 2009;138(4):738-49.
30. Wu G, Park MY, Conway SR, Wang JW, Weigel D, Poethig RS. The sequential action of miR156 and miR172 regulates developmental timing in Arabidopsis. Cell. 2009;138(4):750-9. 31. Baurle I, Dean C. The timing of developmental transitions
in plants. Cell. 2006;125(4):655-64.