R E S E A R C H
Open Access
Plasma metabolomic profiling of
proliferative diabetic retinopathy
Xiao-Rong Zhu
1†, Fang-yuan Yang
1,2†, Jing Lu
1,2, Hui-rong Zhang
1, Ran Sun
1, Jian-Bo Zhou
1*and Jin-Kui Yang
1,2,3*Abstract
Background:Proliferative diabetic retinopathy (PDR), a sight-threatening retinopathy, is the leading cause of irreversible blindness in adults. Despite strict control of systemic risk factors, a fraction of patients with diabetes develop PDR, suggesting the existence of other potential pathogenic factors underlying PDR. This study aimed to investigate the plasma metabotype of patients with PDR and to identify novel metabolite markers for PDR. Biomarkers identified from this study will provide scientific insight and new strategies for the early diagnosis and intervention of diabetic retinopathy.
Methods:A total of 1024 patients with type 2 diabetes were screened. To match clinical parameters between case and control subjects, patients with PDR (PDR,n= 21) or those with a duration of diabetes of≥10 years but without diabetic retinopathy (NDR,n= 21) were assigned to the present case-control study. Distinct metabolite profiles of serum were examined using liquid chromatography-mass spectrometry (LC-MS).
Results:The distinct metabolites between PDR and NDR groups were significantly enriched in 9 KEGG pathways (P< 0.05, impact > 0.1), namely, alanine, aspartate and glutamate metabolism, caffeine metabolism, beta-alanine metabolism, purine metabolism, cysteine and methionine metabolism, sulfur metabolism, sphingosine metabolism, and arginine and proline metabolism. A total of 63 altered metabolites played important roles in these pathways. Finally, 4 metabolites were selected as candidate biomarkers for PDR, namely, fumaric acid, uridine, acetic acid, and cytidine. The area under the curve for these biomarkers were 0.96, 0.95, 1.0, and 0.95, respectively.
Conclusions:This study suggested that impairment in the metabolism of pyrimidines, arginine and proline were identified as metabolic dysregulation associated with PDR. And fumaric acid, uridine, acetic acid, and cytidine might be potential biomarkers for PDR. Fumaric acid was firstly reported as a novel metabolite marker with no prior reports of association with diabetes or diabetic retinopathy, which might provide insights into potential new pathogenic pathways for diabetic retinopathy.
Keywords:Type 2 diabetes, Proliferative diabetic retinopathy, Metabolomics, Metabolic profiling, LC-MS
Introduction
Diabetic retinopathy (DR) is one of the most common microvascular complications associated with diabetes and the leading cause of irreversible blindness in adults world-wide [1]. The number of diabetic patients in China ranks first in the world, and more than 1.6 million are legally blind due to diabetic retinopathy [2]. Therefore, there is an urgent need in China for early detection and intervention with respect to this clinically significant disease. Current
studies suggest that glucose level and duration of disease are major systemic risk factors for the development and progression of microvascular complications, including DR [3, 4]. However, these risk factors could not explain the great variability that characterizes the evolution and rate of progression of the retinopathy in different diabetic pa-tients, suggesting other factors may also involve [5]. It is a fact that many patients with intensive control of glycemic continue to develop DR, while patients with poor glycemic control may not progress DR. There is increasing evidence to suggest that “metabolic memory” might contribute to these different developmental phenotypes of DR [6]. The term metabolic memory refers to continual epigenetic
© The Author(s). 2019Open AccessThis article is distributed under the terms of the Creative Commons Attribution 4.0 International License (http://creativecommons.org/licenses/by/4.0/), which permits unrestricted use, distribution, and reproduction in any medium, provided you give appropriate credit to the original author(s) and the source, provide a link to the Creative Commons license, and indicate if changes were made. The Creative Commons Public Domain Dedication waiver (http://creativecommons.org/publicdomain/zero/1.0/) applies to the data made available in this article, unless otherwise stated. * Correspondence:Jianbo.zhou@foxmail.com;Jinkuiyang@yeah.net
†Xiao-Rong Zhu and Fang-yuan Yang contributed equally to this work.
1Department of Endocrinology, Beijing Tongren Hospital, Capital Medical
University, Beijing 100073, China
modification caused by improper glycemic control in the early stage of diabetes, such individuals continue to pro-gress diabetes complications even after glycemic control reaches the normal range for a period of time [7]. The mechanism of metabolic memory may as a result of influ-ences of gene–environment interactions [7]. Detection of epigenetic signatures in DR could be valuable for timely diagnosis and prompt treatment to prevent progression of the disease [8]. Therefore, the discovery of biomarkers that lead to variations in the progression of DR thus become es-sential as these biomarkers will provide insight on the pathogenic pathways that are currently unknown and may serve as new strategies for the early diagnosis and interven-tion of diabetic retinopathy [4].
Metabolomics, a newly discovered“omics”field, detects the overall and dynamic changes of whole endogenous metabolites in organisms including nucleic acids, proteins, lipids and other small molecules [9]. It is currently recog-nized as a very powerful tool that is complementary to genomic, transcriptomic, or proteomic data. In the past decades, metabolomics has been increasingly used to identify biomarkers associated with metabolic diseases [10]. DR is a complex metabolic disease relates to the interplay of genetic and environmental factors [11], thus the discovery of distinct metabolic signature of DR and the associated pathways could help improve our under-standing of the pathophysiology and mechanisms of dis-ease. Barba et al. [12] identified metabolite markers of DR in the vitreous humor. However, the invasiveness of vitre-ous sampling limits the potential for study replication and
clinical translation of any biomarkers identified from vitre-ous fluid. In contrast, plasma or serum remains the choice of metabolic fluid [6]. In the present study, we aimed to investigate the plasma metabotype of proliferative DR (PDR) (a sight-threatening retinopathy), and to identify novel metabolite markers of PDR. The investigation of metabolite markers of DR will be helpful to explore the mechanism of the occurrence and progression of DR in different stages of disease.
Materials and methods
Sample selection
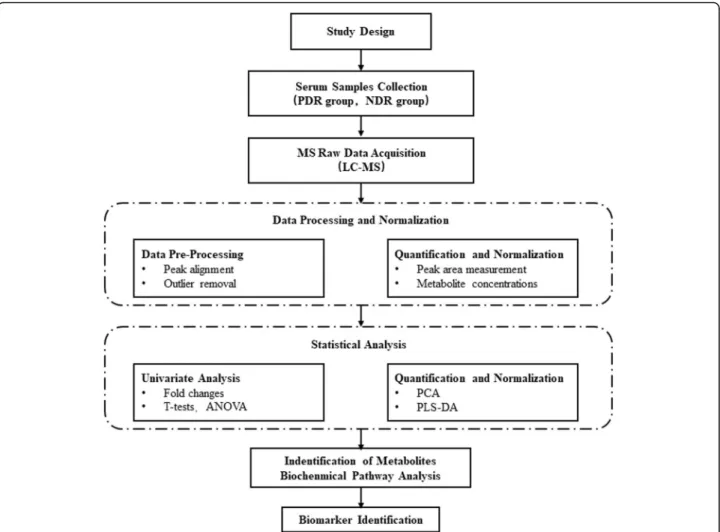
Participants with type 2 diabetes (T2D) and extreme eye phenotype from our previous cohort study [13] performed a case-control study to find a plasma metabolite specific to eye damage. We chose patients with glycated hemoglobin A1c (HbA1c) ≥7.5% (58 mmol/mol) for eye phenotype screening. To match clinical parameters between case and control subjects, patients with sight-threatening PDR (case subjects) or those with a duration of diabetes of≥10 years but without any degree of DR (non-diabetic retinopathy, NDR) (control subjects) were assigned (Fig.1). Those indi-viduals complicated with other eye diseases or with severe impairment of liver, kidney or heart function were ex-cluded from selection.
Baseline test
All of the participants’ medical histories were obtained and patients received a physical examination that
included recording age, sex, duration, blood pressure, and body mass index (BMI). Patients underwent blood and urine laboratory tests that included fasting plasma glucose, total cholesterol, triglycerides, High density lipoprotein cholesterol (HDL-c), Low density lipoprotein cholesterol (LDL-c) serum creatinine, and HbA1c. K2EDTA tubes were used to collect blood samples. Tubes were centri-fuged at 3000 g for 10 min (4 °C) to separate plasma from whole blood. Plasma aliquotswere stored at−80 °C.
Assessment of DR grading
Eye phenotype screening were conducted between April 2015 and July 2017 in Beijing, Tongren Hosppital, China. The presence of DR was diagnosed using digital retinal photographs (2 eyes × 2 fields) taken by using a TRC-NW7SF (Topcon Co. Tokyo, Japan) non-mydriatic camera at 45°. These photographs were subsequently examined in-dependently by 2 qualified retinal photography graders in accordance with quality assurance protocols. The severity of DR was graded based upon the international clinical
diabetic retinopathy and diabetic macular edema disease severity scale [14].
Sample preparation
Before the analysis, frozen plasma was thawed and dis-solved at 4 °C. We then added a mixture of acetonitrile/ methanol (75:25 v/v, 300μL) to the plasma (100μL) in a 1.5-mL tube to precipitate proteins. This mixture was allowed to stand for 10 min after vortexing for 60 s, and then we centrifuged the samples at 12000 rpm for 10 min at 4 °C. The supernatant was transferred to a new eppen-dorf tube and then evaporated to dry in a speedvac con-centrator. Afterward, the residues were re-suspended in the 100μL mobile phase prior to LC-MS analysis. Quality control (QC) samples were prepared by mixing the same amount of serum from each sample and using the same procedures as the test samples to extract metabolites. One QC was inserted into every five samples regularly before and after operation.
LC-MS (liquid chromatography-mass spectrometry) analysis
The ultra-performance liquid chromatography combined with quadrupole time-of-flight tandem mass spectrometry (UPLC Q-TOF MS) analysis was performed on Nexera X2 system (Shimadzu, Japan) coupled with a Triple TOF 5600 quadrupole-time-of-flight mass spectrometer (AB SCIEX, USA) as previous described [15]. In brief, liquid chroma-tography separation was performed on a ZORBAX Eclipse Plus C18 column (2.1 × 100 mm, 3.5 um, Agilent, USA) maintained at 45 °C. The injected sample volume was 10μL for each run in the full loop injection mode, and the flow rate of the mobile phase was 0.5 mL/min. In RPLC mode, gradient elution was performed with the following solvent system: (A) 0.1% formic acid-water and (B) aceto-nitrile with 0.1% formic acid. The gradient started with 98% A, which decreased to 10% A in 13 min, holding at 10% A for 3 min; and then moved to 98% A immediately, holding at 98% A for 4 min. Mass spectrometric experi-ments were performed on a Triple TOF 5600+ orthogon-ally accelerated time-of-flight mass spectrometer (AB Sciex, USA) equipped with an electrospray ion source. We acquired data in positive- and negative-V-geometric modes for each chromatographic separation technique for LC-MS analysis. The capillary voltages were set to 2500 V and 3000 V, cone gas at 50 L/h, desolvation gas at 600 L/h, source temperature at 120 °C, and desolvation temperature at 500 °C. The scan range was from 50 to 1500 m/Z in the full scan mode, and data were collected in centroid mode. We used independent reference lock-mass ions via Analyst
TF 1.6 and MarkerView 1.2.1 to ensure mass accuracy dur-ing data acquisition.
Metabolites identification
By using MarkerView software to pre-process the raw UPLC Q-TOF MS data, such as retention time alignment, peak discrimination, filtering, alignment, matching, and identification, we generated a peak table with retention time (tR), m/z value and corresponding peak intensity. Multivariate analysis by MetaboAnalyst 4.0 program (http://www.metaboanalyst.ca/MetaboAnalyst/) including unsupervised principal component analysis (PCA) and su-pervised projections to latent structures-discriminant ana-lysis (PLS-DA) were then used to identify differentiated metabolites between the 2 groups. The assigned metabolite ions were identified based on m/z and screened in the Human Metabolome Database HMDB (http://www.hmdb. ca/) [16]. The mass tolerance for the HMDB database search was set at 0.05 Da. We also considered the chroma-tographic retention behavior to reduce false-positive matches. An overview of workflow with respect to the comprehensive analysis of metabolomics in patients with type 2 diabetes is summarized in Fig.2.
Statistical analysis
Mann-Whitney U test were first performed to compare the PDR group with NDR groups. Multivariate analysis—including unsupervised principal component analysis (PCA) and supervised projections to latent
Table 1Baseline demographics in this study
NDR PDR P-value
n 21 21 –
Gender (male/Female) 9/12 9/12 –
Age (years) 55 (50–58) 49 (46–56.5) 0.194
Diabetes duration(years) 15 (11.5–20) 11 (8–15.5) 0.014*
BMI (kg/m2) 26.9 (24.21–29.74) 25.8 (23.86–28.20) 0.473
SBP (mmHg) 129 (120–141.5) 132 (122–139) 0.537
DBP (mmHg) 78 (70.5–82.5) 74 (70–80.5) 0.348
Cr (umol/L) 60 (52.75–72.98) 75.5 (59.7–98.5) 0.041
TG (mmol/L) 1.87 (1.43–3.19) 1.97 (1.49–2.98) 0.843
TC (mmol/L) 4.69 (3.88–5.73) 4.91 (4.24–5.57) 0.792
LDL-c (mmol/L) 2.86 (2.19–3.54) 2.97 (2.43–3.55) 0.726
HDL-c (mmol/L) 0.96 (0.83–1.19) 1.03 (0.89–1.10) 0.770
HbA1c (%) 9.2 (8.35–10.10) 8.1 (7.57–8.75) 0.000**
Albuminuria 5 15 0.002†**
Microalbuminuria (20-200 ng/min) 4 8
Macroalbuminuria (> 200 ng/min) 1 7
Data are median (25th, 75th interval) unless otherwise indicated. Statistical analyses were by Mann-Whitney U test.†Pearson Chi-suuare test. *P< 0.05 and **P< 0.01, NDR vs. PDR group
structures-discriminant analysis (PLS-DA)—were used to determine the distributions and find the metabolic differ-ences between 2 groups using MetaboAnalyst 4.0 (http:// www.metaboanalyst.ca/MetaboAnalyst/). The PLS-DA models were cross-validated using a 10-fold method with unit variance scaling. The parameter R2was used to evalu-ate the fitting condition for the PLS-DA models, and Q2 was used to assess predictive ability. Negative or very low Q2 values indicated that the differences between groups were not statistically significant. The PLS-DA model removes variation in the X matrix that is not correlated with the Y matrix. Thus, normally only 1 predictive com-ponent is used for the discrimination between 2 classes.
Comparisons of 2 groups related to the intensities of integrated regions were made by the 2-tailed Welch’s t test, which was performed using MetaboAnalyst 4.0, and a p-value < 0.05 was considered statistically significant. Volcano plots were calculated using a combination of fold-change and t tests, and the peaks that exhibited a statistically significant difference between 2 groups were
used to perform multivariate pattern recognition. We then identified those peaks that showed consistent up-regulation or down-up-regulation; and the intensity data of these regions were used in box-plot analysis, hierarchical cluster analysis, and metabolic pathway analysis.
Pathway analysis
In our study, the different chemical metabolites were eval-uated using the Metaboanalyst web portal for pathway analysis and visualization (http://www.metaboanalyst.ca/). Additional pathway enrichment statistics were analyzed using Metabolite set enrichment analysis (MSEA) (http:// www.msea.ca/MSEA/faces/Home.jsp). Pearson’s r correl-ation was calculated to evaluate relcorrel-ationships between/ among the biomarkers (P< 0.05, impact > 0.01).
Results
Demographic and clinical information
Of the 1024 consecutive patients with T2D screened, 537 had a HbA1c > 7.5%. According to the inclusion and
exclusion criteria of the case-control study, 21 sight-threatening PDR and 21 NDR with a diabetes dur-ation ≥10 years were assigned as case and control sub-jects (Fig. 1). Characteristics of the participants in this study are summarized in Table 1. No significant differ-ences were found between the groups with respect to age, gender, blood pressure, BMI, TG, TC, or LDL-c and HDL-c; however, there were differences in duration of diabetes, HbA1c, and albuminuria between PDR and NDR groups. Apparently, glucose in the NDR group was even more poorly controlled than in the PDR group. Diabetic patients with PDR were prone to albuminuria, which was associated with diabetic nephropathy.
Metabolomics changes between NDR group and PDR group.
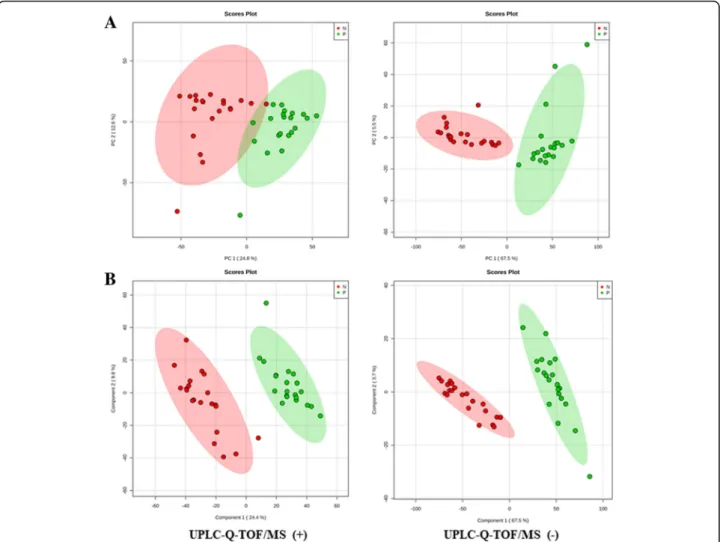
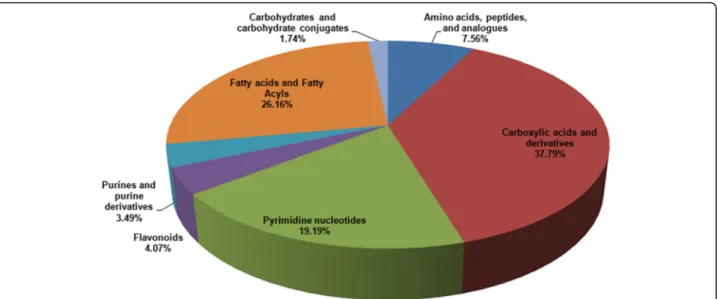
A total of 7735 m/z were identified in both groups by LC-MS analysis. A score plot of the PCA model for sam-ples collected from the 2 isolates of sample data is shown in Fig. 3a. To improve the separation of the 2 groups, we used PLS-DA to visualize the metabolic dif-ferences between them. The 2 groups were well sepa-rated in the PLS-DA score plot, indicating that they had markedly different metabolic characteristics (Fig. 3b). Considering thepvalues and fold-changes (FC), we drew a volcano map (Additional file 1). Based upon our cri-teria of FC> 1.5 or FC< 0.5 andp< 0.05, 1027 different metabolites were identified after HMDB database screening. These metabolites mainly included carboxylic acids and derivatives (37.79%); fatty acyls and fatty acid esters (26.16%); pyrimidine nucleotides (19.19%); amino acids, peptides, and analogues (7.56%); and other markers (Fig.4).
Models analysis
We constructed PCA and PLS-DA models to disclose the metabolic differences between classes, which were often confounded by the influences of diurnal variation, normal physiologic status, and other effects unrelated to re-sponses of interest. All of the models were cross-validated by default using a 10-fold method, the validity of the models against over-fitting was assessed by the parameter R2, and the predictive ability was described by Q2. R2and Q2were 0.97 and 0.94 in PLS-DA model, respectively. Re-sults showed great applicability of the PLS-DA model, and the established PLS-DA model was capable of differentiat-ing case groups from control groups.
Pathway analysis
These 1027 metabolites were enriched in 62 KEGG PATH-WAY Database (Additional file1), of which 9 pathways were enriched significantly (P< 0.05, impact> 0.01) with impact factors of 0.21, 0.65, 0.37, 0.36, 0.27, 0.22, 0.18, 0.47, and 0.54, respectively (Fig.5a, b). These pathways were pyrimi-dine metabolism; alanine, aspartate and glutamate metabol-ism; caffeine metabolmetabol-ism; beta-alanine metabolmetabol-ism; purine metabolism; cysteine and methionine metabolism; sulfur metabolism; sphingolipid metabolism; arginine and proline metabolism; 63 metabolites (Additional file2) were identi-fied in the aforementioned 9 pathways and a corresponding heatmap is shown in Fig.5c.
Biomarkers for PDR diagnosis
We identified 63 compounds that contributed to the vari-ations in the analyzed sample groups, and used them as potential markers to explain the variation between the
NDR and PDR groups; In order to better screening metabolic compounds, we set a more strict selection criteria with P< 10E-05, an area under the curve (AUC) ≥0.95 and a VIP (Variable important in the projection) > 1 (Table 2). Seven metabolites were recognised afterward. The top 4 metabolites (P<
10E-11) were selected as candidate biomarkers for PDR, namely, fumaric acid, uridine, acetic acid, and cytidine. The P values of these biomarkers were 7.90E-17, 6.10E-16, 1.48E-13, and 5.87E-12, respect-ively; and the AUCs were 0.96, 0.95, 1.0, and 0.95, re-spectively (Fig. 6).
Fig. 5Non-targeted metabolomics pathway analysis.aPathway enrichment analysis. The size and color of each circle was based on pathway impact value andp-value, respectively.b9 pathways differ between the NDR and PDR group, particularly, in Pyrimidine metabolism, Alanine, aspartate and glutamate metabolism, Caffeine metabolism, beta-Alanine metabolism, Purine metabolism, Cysteine and methionine metabolism, Sulfur metabolism, Sphingolipid metabolism, Arginine and proline metabolism.cHeatmap of non-targeted plasma metabolomics show 63 compounds play important roles in 9 above-mentioned pathways indicated significantly different metabolites between NDR and PDR group
Table 2Metabolite markers identified from discovery metabolomic profiling
Metabolite Fold-Change (PDR/NDR) Vip Elements Query_mass Adduct Trend AUC P-value
Fumaric acid 4.235 1.1898 HMDB0000134 114.9904 M-H ↑ 0.96 7.90E-17
Uridine 4.2748 1.1764 HMDB0000296 243.0613 M-H ↑ 0.95 6.10E-16
Acetic acid 2.1932 1.9268 HMDB0000042 60.9867 M + H ↑ 1.0 1.48E-13
Cytidine 8.6763 1.0932 HMDB0000089 242.0796 M-H ↑ 0.95 5.87E-12
3-Sulfinoalanine 0.57541 1.155 HMDB0000996 151.9927 M-H ↓ 1 1.06E-11
3-Methylxanthine 4.5202 1.0224 HMDB0001886 165.0393 M-H ↑ 0.96 1.02E-09
Discussion
Diabetic retinopathy, acknowledged as a chronic meta-bolic disease, is the mainly cause of blindness among working-age adults throughout the world [1]. Without treatment, it easily leads to vision loss and affect the qual-ity of life. Thus, early detection and intervention are of great significance. The pathogenesis of diabetic retinop-athy is related to hyperglycemia-induced persistent meta-bolic disorders, inflammation, oxidative stress, etc. [17]. It is an indisputable fact that proliferative diabetic retinop-athy (PDR) also occurs in some patients whose blood glucose control is up to standard, suggesting other patho-genic factors contribute to this phenomenon [5]. There-fore, for better understanding the mechanism of the occurrence and development of the disease, it is essential to identify the biomarkers that lead to different pheno-types of diabetic retinopathy, which relates to the interplay between genetic and environmental factors. Recently, metabolomics has gained attention as an attractive tool for biomarker identification in metabolic disorders. In the present study, we used LC-MS-based metabolomic profil-ing to identify metabolic markers in diabetic patients with sight threaten proliferative diabetic retinopathy (PDR) in
comparison to diabetics without retinopathy (NDR). Our aims were as follows: 1) to identify metabolic signatures that could distinguish patients with PDR from those with long duration but without DR, and 2) to identify the meta-bolic pathways that respond to DR.
We firstly reported that Fumaric acid, identified from metabolomic profiling, was associated with PDR and it might be a new biomarker and potential therapeutic tar-get for DR. In our study, we observed high level of fu-maric acid in the PDR group, and the AUC for detecting diabetic retinopathy was 0.96 (95% CI, 0.91–1). Fumaric acid is a small-molecule metabolite that recently be identified as an epigenetic modifier. Even though, its roles in DR have not yet been elucidated, some studies reported high levels of fumaric acid in many tumors and biofluids that surround tumors [18]. Studies suggested this metabolite might be involved in hypoxia in tumors, while the HIF transcription factor (HIF-α) was the major regulator in response to hypoxia [7,19]. Moreover, Scia-covelli et al. [20] found excessive fumaric acid accumula-tion in renal cell cancer in response to an epigenetic change in micro RNA200. Previous findings suggested that both HIF-α [17, 21] and micro RNA200 [21, 22] Fig. 6Receiver operating characteristic (ROC) curve analysis was performed to evaluate the use of metabolites as biomarkers for PDR.
played an important role in the formation of diabetic retinopathy. Retina is an organ with high metabolism and oxygen consumption in body, and is thought to be particularly susceptible to hyperglycemia-related oxida-tive stress [23–25]. Abnormal metabolism induced by hyperglycemia could also result in the overproduction of free radicals that can lead to oxidative stress and damage to tissues in and around retinal vessels [26]. Retinal microvascular dysfunction—resulting in retinal ischemia and hypoxia—could also aggravate oxidative stress, which is thought to be one of the crucial factors in the pathogenesis of DR [27]. These events suggested fumaric acid may play a role in tissue oxidative stress. Therefore, we ultimately hypothesized that fumaric acid was associ-ated with diabetic retinopathy, and that it might be a new biomarker and potential therapeutic target for DR. Further studies should be carried out to confirm this re-sult and to investigate the mechanism of fumaric acid in DR development.
An earlier metabonomic study demonstrated an associ-ation of pyrimidine metabolism with the development of non-proliferative DR using gas chromatography-mass spectrometry (GC-MS) [28]. These investigators found higher levels of cytidine (P= 0.001) and thymidine (P= 0.001) in plasma samples from T2D patients with early stage of DR compared to those without DR, and cytidine had the highest AUC (0.849 ± 0.048). Pyrimidines are vital biomolecules that participate in a wide range of biological functions, including syntheses of DNA, RNA, lipids, and carbohydrates [29] and pyrimidine derivatives are already being used as antidiabetic medications [30]. In our study, we observed increased levels of cytidine in PDR patients, which was similar to previous findings. Cytidine, a pyrimi-dine molecule, is considered as the precursor of the cyti-dine triphosphate (CTP), which influences metabolism of phospha-tidylcholine (PC) and phosphatidylethanolamine (PE) biosynthesis. Besides that, alteration of cytidine could induce the abnormality of the salvage pathway of pyrimi-dine nucleotide, followed by the dysfunction of phospho-lipid [28]. Previous studies reported the concentration of phospholipids decreased with the development of diabetic microvascular complications [31]. Therefore, we suppose that cytidine may serve as a potential biomarker for the diagnosis of diabetic retinopathy and evaluation of treat-ment. In current study, the concentration of uridine also changed significantly in the PDR group. Uridine is pro-duced from cytidine by cytidine deaminase [32]. As a member of pyrimidine, it is also a promoting metabolic biomarker of diabetic retinopathy which is related to pyr-imidine metabolism.
There are few metabolomics studies of diabetic retin-opathy in the literature. Two previous studies concern-ing vitreous samples from patients with PDR and control patients without diabetes have suggested a
dysregulation in several biochemical pathways, including the arginine to proline pathway [33], polyol pathway, and ascorbic acidic pathways [12]. Another two studies were performed on plasma samples from patients with NPDR to study the metabolic signature of DR. Chen et al. [6] also demonstrated significant enrichment of the pentose phosphate pathway. Paris et al. [33] used LC-MS to generate and validate the metabolomic profile of vitreous samples, and pathway enrichment analysis re-vealed that arginine metabolism was the pathway perturbed in the DR group. Our study supports a dys-regulation of pathways, including arginine and proline metabolism. Elevated levels of arginine and ornithine were observed in patients with PDR, potentially impli-cating a compromised Mueller glial cell metabolism in the disruption of neurovascular crosstalk within the ret-ina and progression of diabetic retinopathy [34,35].
Limitations
The relatively small sample size of our study might be in-sufficient to make conclusive statements regarding meta-bolic status in DR patients. Larger cohorts of diabetic patients need to be enrolled and metabolomic analyses performed to confirm our findings. The exact mecha-nism(s) underlying this disease remains elusive and re-quires further study.
Conclusion
Herein, we generated a metabolomic profile between PDR and NDR groups in plasma of diabetic patients, and we found fumaric acid, cytidine, uridine, and acetic acid to be correlated with DR. Fumaric acid was firstly reported as a novel metabolite marker with no prior reports of associ-ation with diabetes or DR. Our study also replicated previ-ous findings showing significant impairment in the metabolism of pyrimidines, arginine, and proline, which was identified as metabolic dysregulations associated with DR. Further research is required to replicate these findings and determine longitudinal associations with disease.
Additional files
Additional file 1:KEGG PATHWAY Database. (XLSX 12 kb)
Additional file 2:Metabolites Database. (XLSX 13 kb)
Abbreviations
Acknowledgements
We thank LetPub (www.letpub.com) for its linguistic assistance during the preparation of this manuscript.
Funding
This work was supported by the National Key R&D program of China (No.2018YFC0116800), National natural science Foundation of China (No.81561128015) and Basic-Clinical Cooperation Program from Capital Medical University (No. PYZ2018056). The authors would like to thank all of the participants and staff in this study.
Availability of data and materials
The datasets used and analyzed during the current study are available from the corresponding author (Y.J.K.) upon reasonable request.
Authors’contributions
JKY and XRZ contributed to the design of the study, analysis, and interpretation of data, and prepared all of the figures and tables. JKY, XRZ, and FYY, drafted a portion of the manuscript. JBZ, JL, RS, and RHZ took part in analyzing data and drafting a portion of the manuscript. All authors read and approved the final manuscript.
Ethics approval and consent to participate
The study was conducted with the approval from the Ethics Committee of Beijing Tongren Hospital, Capital Medical University, and adhered to the Declaration of Helsinki. Written informed consent was obtained from each participant.
Consent for publication
All of the authors gave their consent to the publication. No conflict of interest exits in the submission of this manuscript, and this manuscript is approved by all of the authors for publication. The work described was original research that has not been published previously, and is not under consideration for publication elsewhere, in whole or in part.
Competing interests
The authors declare that they have no competing interests.
Publisher’s Note
Springer Nature remains neutral with regard to jurisdictional claims in published maps and institutional affiliations.
Author details 1
Department of Endocrinology, Beijing Tongren Hospital, Capital Medical University, Beijing 100073, China.2Beijing Key Laboratory of Diabetes Research and Care, Beijing, China.3Beijing Diabetes Institute, Beijing, China.
Received: 13 February 2019 Accepted: 1 May 2019
References
1. American Diabetes A. 10. Microvascular complications and foot care: standards of medical Care in Diabetes-2018. Diabetes Care. 2018;41:S105–18. 2. Xu Y, Wang L, He J, Bi Y, Li M, Wang T, Wang L, Jiang Y, Dai M, Lu J, et al.
Prevalence and control of diabetes in Chinese adults. JAMA. 2013;310:948–59. 3. Ting DS, Cheung GC, Wong TY. Diabetic retinopathy: global prevalence,
major risk factors, screening practices and public health challenges: a review. Clin Exp Ophthalmol. 2016;44:260–77.
4. Tan GS, Ikram MK, Wong TY. Traditional and novel risk factors of diabetic retinopathy and research challenges. Curr Med Chem. 2013;20:3189–99. 5. Lachin JM, Genuth S, Nathan DM, Zinman B, Rutledge BN, Group DER. Effect of
glycemic exposure on the risk of microvascular complications in the diabetes control and complications trial--revisited. Diabetes. 2008;57:995–1001. 6. Chen L, Cheng CY, Choi H, Ikram MK, Sabanayagam C, Tan GS, Tian D,
Zhang L, Venkatesan G, Tai ES, et al. Plasma Metabonomic profiling of diabetic retinopathy. Diabetes. 2016;65:1099–108.
7. Pirola L, Balcerczyk A, Okabe J, El-Osta A. Epigenetic phenomena linked to diabetic complications. Nat Rev Endocrinol. 2010;6:665–75.
8. Nunes S, Ribeiro L, Lobo C, Cunha-Vaz J. Three different phenotypes of mild nonproliferative diabetic retinopathy with different risks for development of clinically significant macular edema. Invest Ophthalmol Vis Sci. 2013;54:4595–604.
9. Nicholson JK, Lindon JC. Systems biology: Metabonomics. Nature. 2008; 455:1054–6.
10. Holmes E, Wilson ID, Nicholson JK. Metabolic phenotyping in health and disease. Cell. 2008;134:714–7.
11. Kuo JZ, Wong TY, Rotter JI. Challenges in elucidating the genetics of diabetic retinopathy. JAMA Ophthalmol. 2014;132:96–107.
12. Barba I, Ramirez M, Hernandez C, Alonso MA, Masmiquel L, Garcia-Dorado D, Simo R. Metabolic fingerprints of proliferative diabetic retinopathy: an 1H-NMR-based metabonomic approach using vitreous humor. Invest Ophthalmol Vis Sci. 2010;51:4416–21.
13. Yang JK, Wang YY, Liu C, Shi TT, Lu J, Cao X, Yang FY, Feng JP, Chen C, Ji LN, Xu A. Urine proteome specific for eye damage can predict kidney damage in patients with type 2 Diabetes: a case-control and a 5.3-year prospective cohort study. Diabetes Care. 2017;40:253–60.
14. Wilkinson CP, Ferris FL 3rd, Klein RE, Lee PP, Agardh CD, Davis M, Dills D, Kampik A, Pararajasegaram R, Verdaguer JT. Global diabetic retinopathy project G: proposed international clinical diabetic retinopathy and diabetic macular edema disease severity scales. Ophthalmology. 2003;110:1677–82. 15. Liu J, Li Z, Liu H, Wang X, Lv C, Wang R, Zhang D, Li Y, Du X, Li Y, et al.
Metabolomics-based clinical efficacy and effect on the endogenous metabolites of Tangzhiqing tablet, a Chinese patent medicine for type 2 Diabetes mellitus with hypertriglyceridemia. Evid Based Complement Alternat Med. 2018;2018:5490491.
16. Wishart DS, Knox C, Guo AC, Eisner R, Young N, Gautam B, Hau DD, Psychogios N, Dong E, Bouatra S, et al. HMDB: a knowledgebase for the human metabolome. Nucleic Acids Res. 2009;37:D603–10.
17. Dehdashtian E, Mehrzadi S, Yousefi B, Hosseinzadeh A, Reiter RJ, Safa M, Ghaznavi H, Naseripour M. Diabetic retinopathy pathogenesis and the ameliorating effects of melatonin; involvement of autophagy, inflammation and oxidative stress. Life Sci. 2018;193:20–33.
18. Chen X, Wu J, Song W, Zhang L, Wang H, Liu L. Fumaric acid production by Torulopsis glabrata: engineering the urea cycle and the purine nucleotide cycle. Biotechnol Bioeng. 2015;112:156–67.
19. Fieuw A, Kumps C, Schramm A, Pattyn F, Menten B, Antonacci F, Sudmant P, Schulte JH, Van Roy N, Vergult S, et al. Identification of a novel recurrent 1q42.2-1qter deletion in high risk MYCN single copy 11q deleted neuroblastomas. Int J Cancer. 2012;130:2599–606.
20. Marco Sciacovelli EG, Johnson TI, Zecchini VR, da Costa ASH, AVD EG, Theobald SJ, Abbo SR, Tran MGB, Vinothini Rajeeve SC, Foster S, Yun H, Cutillas P, Warren A, Gnanapragasam V, Eyal Gottlieb KF. Fumarate is an epigenetic modifier that elicits epithelial-to-mesenchymal transition. Nature. 2016;537:544–7.
21. Joglekar MV, Januszewski AS, Jenkins AJ, Hardikar AA. Circulating microRNA biomarkers of diabetic retinopathy. Diabetes. 2016;65:22–4.
22. Murray AR, Chen Q, Takahashi Y, Zhou KK, Park K, Ma JX. MicroRNA-200b downregulates oxidation resistance 1 (Oxr1) expression in the retina of type 1 diabetes model. Invest Ophthalmol Vis Sci. 2013;54:1689–97.
23. Arden GB, Sivaprasad S. Hypoxia and oxidative stress in the causation of diabetic retinopathy. Curr Diabetes Rev. 2011;7:291–304.
24. Bek T, Lund-Andersen H. Localised blood-retinal barrier leakage and retinal light sensitivity in diabetic retinopathy. Br J Ophthalmol. 1990;74:388–92. 25. Ramsey DJ, Arden GB. Hypoxia and dark adaptation in diabetic retinopathy:
interactions, consequences, and therapy. Curr Diab Rep. 2015;15:118. 26. Hammes HP. Diabetic retinopathy: hyperglycaemia, oxidative stress and
beyond. Diabetologia. 2018;61:29–38.
27. Li C, Miao X, Li F, Wang S, Liu Q, Wang Y, Sun J. Oxidative stress-related mechanisms and antioxidant therapy in diabetic retinopathy. Oxidative Med Cell Longev. 2017;2017:9702820.
28. Xia JF, Wang ZH, Liang QL, Wang YM, Li P, Luo GA. Correlations of six related pyrimidine metabolites and diabetic retinopathy in Chinese type 2 diabetic patients. Clin Chim Acta. 2011;412:940–5.
29. Garavito MF, Narvaez-Ortiz HY, Zimmermann BH. Pyrimidine metabolism: dynamic and versatile pathways in pathogens and cellular development. J Genet Genomics. 2015;42:195–205.
30. Chauhan M, Kumar R. Medicinal attributes of pyrazolo [3,4-d] pyrimidines: a review. Bioorg Med Chem. 2013;21:5657–68.
32. Costanzi S, Vincenzetti S, Cristalli G, Vita A. Human cytidine deaminase: a three-dimensional homology model of a tetrameric metallo-enzyme inferred from the crystal structure of a distantly related dimeric homologue. J Mol Graph Model. 2006;25:10–6.
33. Paris LP, Johnson CH, Aguilar E, Usui Y, Cho K, Hoang LT, Feitelberg D, Benton HP, Westenskow PD, Kurihara T, et al. Global metabolomics reveals metabolic dysregulation in ischemic retinopathy. Metabolomics. 2016;12:15. 34. Metea MR, Newman EA. Glial cells dilate and constrict blood vessels: a
mechanism of neurovascular coupling. J Neurosci. 2006;26:2862–70. 35. Bringmann A, Pannicke T, Grosche J, Francke M, Wiedemann P, Skatchkov