SOFTWARE
Bioactivity-explorer: a web application
for interactive visualization and exploration
of bioactivity data
Lu Liang
1, Chunfeng Ma
1,3, Tengfei Du
1, Yufei Zhao
1,3, Xiaoyong Zhao
1, Mengmeng Liu
1,3, Zhonghua Wang
2*and Jianping Lin
1,2,3*Abstract
To better leverage the accumulated bioactivity data in the ChEMBL database, we have developed Bioactivity-explorer, a web application for interactive visualization and exploration of the large-scale bioactivity data in ChEMBL. Mining and integration of the Therapeutic Target Database disease-target mapping into the ChEMBL database has enabled Bioactivity-explorer to include 493,430 scaffolds, 31,400,000 matched molecular pairs, 1330,220 target–target interac-tions in terms of shared active compounds, 4526,718 target–target interacinterac-tions in terms of shared active scaffolds, 97,041,700 molecule–molecule interactions and 14,974 disease-target mappings. This web tool is available at http:// cadd.pharm acy.nanka i.edu.cn/b17r. The source codes of the front end and back end, released under MIT license, can be found at GitHub.
Keywords: Network pharmacology, Web server, Matched molecular pair, Molecule scaffold, ChEMBL
© The Author(s) 2019. This article is distributed under the terms of the Creative Commons Attribution 4.0 International License (http://creat iveco mmons .org/licen ses/by/4.0/), which permits unrestricted use, distribution, and reproduction in any medium, provided you give appropriate credit to the original author(s) and the source, provide a link to the Creative Commons license, and indicate if changes were made. The Creative Commons Public Domain Dedication waiver (http://creat iveco mmons .org/ publi cdoma in/zero/1.0/) applies to the data made available in this article, unless otherwise stated.
Introduction
In the past decade, open bioactivity data accumulated rapidly in public data repositories such as ChEMBL [1], BindingDB [2] and PubChem BioAssay [3]. For example, the latest release of the ChEMBL database (v24) con-tains 12,091 targets, 1828,820 distinct compounds and 15,207,914 activities. With the plethora of publicly avail-able bioactivity data, it becomes increasingly important to extract and explore information of interest in drug dis-covery, especially information derived from large-scale SAR data, for example, matched molecular pairs (MMPs), which describe how structural transformations affect compound properties, including biological activity [4]; the scaffold distribution of a specific target [5]; and net-work pharmacology [6], which relates targets in terms of
shared active ligands, etc. Many studies have been per-formed to mine the information underlying experimen-tal data repositories. Ye et al. explored all the scaffolds of compounds from the ChEMBL database [5, 7]. Paolini et al. [8] presented a global mapping of pharmacological space to explore the global relationships between chemi-cal structure and biologichemi-cal targets. By employing the similarity ensemble approach, Keiser et al. related protein pharmacology to ligand chemistry, which was found to reveal unexpected protein target relationships that may be assayed using the ligands themselves. Wirth et al. [9] built an MMP database, named SwissBioisostere, by mining the bioactivity data in ChEMBL. Weber et al. also reported an MMP database with 3D information obtained by mining the data from ChEMBL and PDBbind.
However, to our knowledge, there is no tool or web server that provides comprehensive information min-ing from public bioactivity repositories, as mentioned above. Among the public bioactivity data repositories, the ChEMBL database hosted by the European Bioin-formatics Institute is one of the most widely used data sources because of its well-curated bioactivity data and
Open Access
*Correspondence: [email protected]; [email protected]
1 State Key Laboratory of Medicinal Chemical Biology, College
of Pharmacy and Tianjin Key Laboratory of Molecular Drug Research, Nankai University, Haihe Education Park, 38 Tongyan Road, Tianjin 300353, China
2 Tianjin Institute of Industrial Biotechnology, Biodesign Center, Chinese
Academy of Sciences, Tianjin, China
Page 2 of 6 Liang et al. J Cheminform (2019) 11:47
user-friendly downloading format [1]. Accordingly, we have developed Bioactivity-explorer, a web application for the interactive visualization and exploration of large-scale bioactivity data in the ChEMBL database.
Implementation Data preparation
The ChEMBL database is the central data repository for Bioactivity-explorer. To maintain consistency with the release pace of the ChEMBL database, we have developed an in-house workflow to help updating data which will be released on GitHub page. Current data were retrieved from the latest ChEMBL (v24) together with the target-diseases data (the ICD-10 diseases classification) from the TTD data-base [10], in which diseases are mapped to ChEMBL targets through Uniprot ID. For example, there are three targets, “Maltase-glucoamylase, intestinal”, “Fibrin” and “Recom-binant tetravalent attenuated live dengue”, associated with Dengue fever(A90), and of them the target “Maltase-glu-coamylase, intestinal” has Uniprot ID “O43451” which was then mapped to Maltase-glucoamylase (CHEMBL2074) in ChEMBL. To mine more information, essentially following our previous work [11], the bioactivity data from ChEMBL were first prepared by the following steps:
(1) Only activities with valid pChEMBL values (nega-tive logarithms of molar IC50, EC50, Ki, etc.) were considered for future usage, such as scaffold activ-ity, target–target network and MMPs generation, and for molecules with multiple potency measure-ments reported, the aggregate values (including mean, median, maximum and minimum value) were calculated.
(2) The Bemis-Murcko (BM) method [12], which is one of the most widely used scaffold-generation meth-ods, was used to generate scaffolds for all struc-tures. The algorithm implemented in RDKit was employed.
(3) As in the curation procedure for molecule activity, the aggregated BM scaffold [12] activity values were generated from molecules of the scaffold.
(4) The definition of “interaction” of target–target and molecule–molecule were derived from the net-work pharmacology net-work by Paolini et al. [8]. Simi-lar ideas were successfully used in the visualization of the chemical space [13] and target prediction [14]. Hu et al. [15] employ a simple definition that two targets are related to each other if they share at least five active compounds. Inspired by the above studies, the target–target and molecule–molecule interaction relationships, which were defined by the number of shared active molecules/targets, were pre-calculated based on the processed
mol-ecule/scaffold activities mentioned above. For exam-ple, in the current database there are 57 and 143 ligands with valid pChEMBL against Sucrase-iso-maltase (CHEMBL2748) and Maltase-glucoamylase (CHEMBL2074), respectively, and 51 of them are in common. This aggregated data was store in database for target–target network view. It should be men-tioned that, in the molecule–molecule interaction generation process, for simplicity, only small mol-ecules with more than 10 activities reported were considered, and only molecular pairs that shared more than 5 targets were stored in the database.
For MMP identification of compounds from the same assay, an algorithm implemented in RDKit [16] was employed, and of the generated transformations, the one with most heavy atoms (to maximize the transformation) was selected.
Construction
A user-friendly web interface was developed by combin-ing the Angular framework (https ://angul ar.io) and the Django framework (https ://www.djang oproj ect.com/). All data used were stored in a PostgreSQL database. We also implemented a graphql interface (https ://graph ql.org/), which offers greater query flexibility for the user; a use case is provided in the Results section. The docker files for both the front end and the back end of the tool are provided to facilitate developing, deploying and run-ning the application. Detailed setup instructions can be found at the GitHub repository.
Results
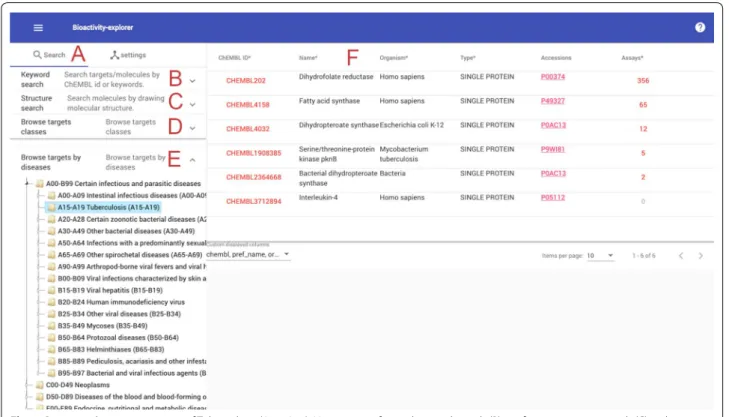
The front end of Bioactivity-explorer was built with mod-ern web technology, Angular (www.angul ar.io) and Angu-lar Material; therefore, to avoid compatibility problems, we strongly recommend the use of the latest versions of web browsers (Google Chrome, Firefox, etc.). Bioactivity-explorer consists of the following main modules: a target/ molecule search panel, a target page, a molecule page, a scaffold page, an assay page and a document page.
Data search and results table
applet [17] was employed for drawing structures, and then structure and substructure searches of molecules or scaffolds can be performed. The Morgan fingerprint (implemented in RDKit) similarity threshold is adjust-able from 0.7 to 1, and set to 1 enadjust-ables an exact structure search.
Target information page
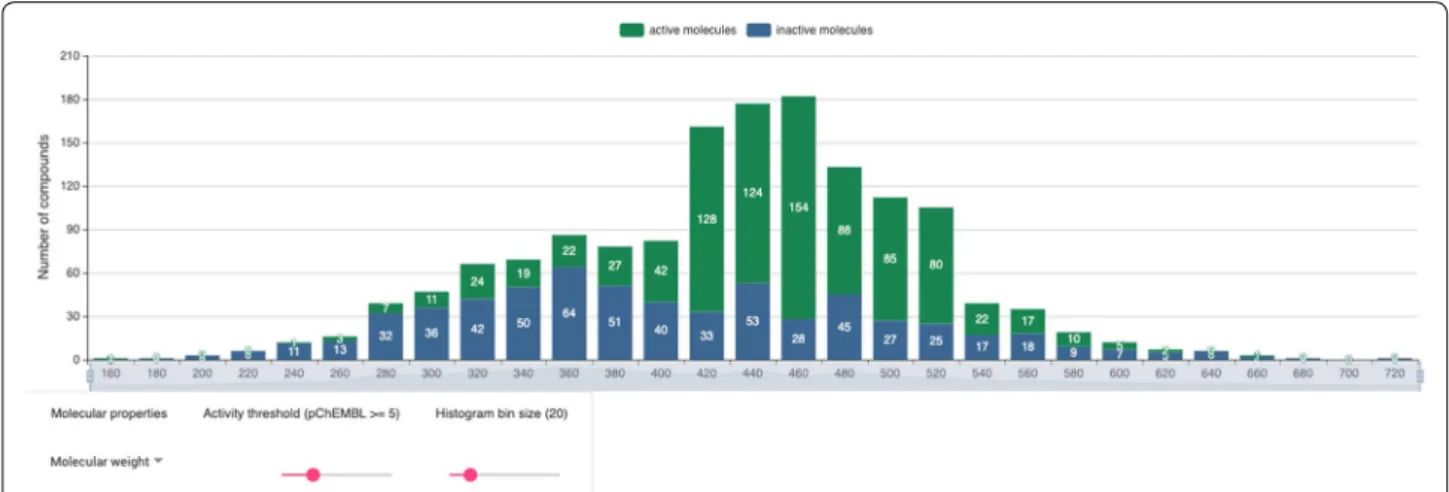
One of the central features of Bioactivity-explorer is the target information page. In addition to the basic infor-mation on a target, to improve usability, bioactivities, charts based on bioactivity data, target interaction net-work, MMPs and active scaffolds are also organized into this page. Compared to the charts of a target at the offi-cial ChEMBL site, Bioactivity-explorer provides charts with more functionalities. Taking the ligand property histogram as an example (Fig. 2), the chart in Bioactiv-ity-explorer was further associated with bioactivities. Active and inactive molecules were shown in different colors; therefore, by selecting different activity thresh-olds and bin sizes, the user can view the compound properties interactively, including the molecular weight, polar surface area (PSA), AlogP, number of heavy atoms, number of aromatic rings, number of rotatable bonds (RTB), number of hydrogen bond donors (HBD) and
number of hydrogen bond acceptors (HBA). There is an additional chart about the number of papers published each year on the target, which gives an overview of the research trend of this target.
As stated above, the target interaction relationship here was defined by the number of shared active compounds or scaffolds. The “Network” tab on the target page contains a network, as shown in Fig. 3, illustrating these relation-ships. An edge that connects two nodes in the network denotes that the two targets have active compounds in common, and the width is proportional to the number of shared compounds. To construct an interactive network view, the node color (color by target type or organism), network type (shared compounds or scaffolds), activity threshold and number of shared compound thresholds are also customizable. The node and edge can be double-clicked to view the corresponding target and compound list, respectively. For some targets with a plethora of bio-activity data, it may take seconds to load the network.
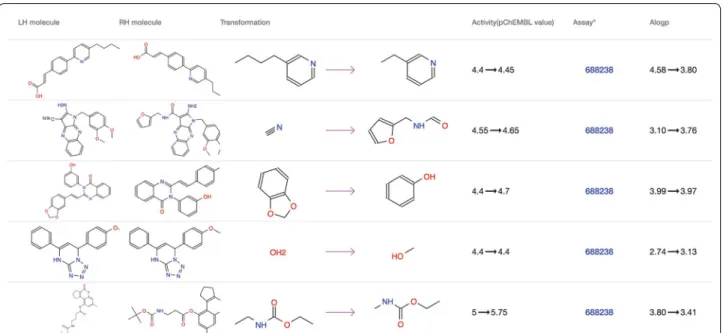
The “MMP” tab on the target page contains a table of all MMPs derived from the assays of the target (Fig. 4). Each row of the MMP table is a matched molecular pair and consists of a right handed and left handed molecu-lar structure, structural transformation, activity change, assays and physical property changes including molecular
Page 4 of 6 Liang et al. J Cheminform (2019) 11:47
weight, PSA, RTB and Alogp. Finally, the “Scaffold” tab contains all BM scaffolds generated from active mol-ecules of the target, together with the corresponding
maximum, mean, median and minimum activity values of the scaffold and the number of underlying compounds.
Fig. 2 Target-associated compound property histogram. Active and inactive molecules are shown in different colors. Below the histogram, the molecule property list, activity threshold and bin size threshold slider options could be used to interact with the chart
A case study exploring data on the target Cyclin-depend-ent kinase 5 is provided in the Additional file 1.
Other pages were organized very similarly to the target page, except for specific data. For example, the “Related
Molecules” tab on the molecule page contains molecules that have more than 5 active targets in common.
Fig. 4 An example of the MMP table. Each row of the table represents an MMP, including the left handed (LH) and right handed (RH) molecule, structural transformation, activity and property changes
Page 6 of 6 Liang et al. J Cheminform (2019) 11:47
The graphql query interface
Graphql is a query language for APIs, and gives the user the power to ask for exactly what they need. The graphql query interface (named graphiq) and the documenta-tion are located at http://cadd.pharm acy.nanka i.edu.cn/ b17r_api/graph ql. Figure 5 demonstrates a graphql query (in the left panel) that retrieves the first 10 activities with a pChEMBL value greater than 6 of the target Maltase-glucoamylase (ChEMBL tid 1). The retrieved results are located in the right panel in JSON format.
Conclusion
We open sourced both the front end and back end of Bioactivity-explorer so that anyone can become directly involved in the development process on GitHub, and researchers who are interested in this tool could build their own local server to use it (which we strongly recom-mend). In addition to the ChEMBL database, there are still many open and valuable databases that are of great benefit to the drug discovery community; therefore, we expect Bioactivity-explorer to provide an integrated drug development environment for drug discovery and a start-ing point to integrate more databases.
In summary, based on the ChEMBL database, Bioac-tivity-explorer consists of 493,430 scaffolds, 31,400,000 MMPs, 1330,220 target–target interactions in terms of shared active compounds, 4526,718 target–target inter-actions in terms of shared active scaffolds, 97,041,700 molecule–molecule interactions and 14,974 disease-tar-get mappings. For detailed instructions on using Bioac-tivity-explorer, please refer to the help page.
Additional file
Additional file 1. Case study: Exploring bioactivity data of Cyclin-depend-ent kinase 5.
Acknowledgements
We thank Dr. Pi Liu for valuable suggestions.
Authors’ contributions
LL, ML and TD designed the algorithm for data curation. YZ, LL, XZ, CM and ZW implemented the front end and back end of the tool. ZW, LL and JL wrote the manuscript and discussed the results. All authors read and approved the final manuscript.
Funding
This work was supported by the National Key R&D Program of China (No. 2017YFC1104400).
Availability of data and materials
The front end and back end of the tool can be found at https ://githu b.com/ jianp ing-grp/ng-b17r and https ://githu b.com/jianp ing-grp/b17r, respectively. The tool is also freely available at http://cadd.pharm acy.nanka i.edu.cn/b17r.
Competing interests
The authors declare that they have no competing interests.
Author details
1 State Key Laboratory of Medicinal Chemical Biology, College of Pharmacy
and Tianjin Key Laboratory of Molecular Drug Research, Nankai University, Haihe Education Park, 38 Tongyan Road, Tianjin 300353, China. 2 Tianjin
Institute of Industrial Biotechnology, Biodesign Center, Chinese Academy of Sciences, Tianjin, China. 3 Platform of Pharmaceutical Intelligence, Tianjin
International Joint Academy of Biomedicine, Tianjin 300000, China.
Received: 25 March 2019 Accepted: 2 July 2019
References
1. Gaulton A, Hersey A, Nowotka M et al (2017) The ChEMBL database in 2017. Nucleic Acids Res 45:D945–D954. https ://doi.org/10.1093/nar/ gkw10 74
2. Gilson MK, Liu T, Baitaluk M et al (2016) BindingDB in 2015: a public database for medicinal chemistry, computational chemistry and systems pharmacology. Nucleic Acids Res 44:D1045–D1053. https ://doi. org/10.1093/nar/gkv10 72
3. Kim S, Thiessen PA, Bolton EE et al (2016) PubChem substance and compound databases. Nucleic Acids Res 44:D1202–D1213. https ://doi. org/10.1093/nar/gkv95 1
4. Griffen E, Leach AG, Robb GR, Warner DJ (2011) Matched molecular pairs as a medicinal chemistry tool. J Med Chem 54:7739–7750. https ://doi. org/10.1021/jm200 452d
5. Hu Y, Stumpfe D, Bajorath J (2011) Lessons learned from molecular scaf-fold analysis. J Chem Inf Model 51:1742–1753. https ://doi.org/10.1021/ ci200 179y
6. Hopkins AL (2008) Network pharmacology: the next paradigm in drug dis-covery. Nat Chem Biol 4:682–690. https ://doi.org/10.1038/nchem bio.118
7. Hu Y, Stumpfe D, Bajorath J (2016) Computational exploration of molecu-lar scaffolds in medicinal chemistry. J Med Chem 59:4062–4076 8. Paolini GV, Shapland RHB, Van Hoorn WP et al (2006) Global mapping of
pharmacological space. Nat Biotechnol. https ://doi.org/10.1038/nbt12 28
9. Wirth M, Zoete V, Michielin O, Sauer WHB (2013) SwissBioisostere: a database of molecular replacements for ligand design. Nucleic Acids Res.
https ://doi.org/10.1093/nar/gks10 59
10. Li YH, Yu CY, Li XX et al (2018) Therapeutic target database update 2018: enriched resource for facilitating bench-to-clinic research of targeted therapeutics. Nucleic Acids Res. https ://doi.org/10.1093/nar/gkx10 76
11. Wang Z, Li J, Dang R et al (2015) PhIN: a protein pharmacology interac-tion network database. CPT Pharmacometrics Syst Pharmacol 4:160–166.
https ://doi.org/10.1002/psp4.25
12. Bemis GW, Murcko MA (1996) The properties of known drugs. 1. Molecu-lar frameworks. J Med Chem 39:2887–2893. https ://doi.org/10.1021/ jm960 2928
13. Fechner N, Papadatos G, Evans D et al (2013) ChEMBLSpace-a graphical explorer of the chemogenomic space covered by the ChEMBL database. Bioinformatics. https ://doi.org/10.1093/bioin forma tics/bts71 1
14. Keiser MJ, Roth BL, Armbruster BN et al (2007) Relating protein pharmacol-ogy by ligand chemistry. Nat Biotechnol. https ://doi.org/10.1038/nbt12 84
15. Hu Y, Bajorath J (2010) Polypharmacology directed compound data mining: identification of promiscuous chemotypes with different activity profiles and comparison to approved drugs. J Chem Inf Model 50:2112–2118. https ://doi.org/10.1021/ci100 3637
16. Hussain J, Rea C (2010) Computationally efficient algorithm to identify matched molecular pairs (MMPs) in large data sets. J Chem Inf Model 50:339–348. https ://doi.org/10.1021/ci900 450m
17. Bienfait B, Ertl P (2013) JSME: a free molecule editor in JavaScript. J Chem-inform. https ://doi.org/10.1186/1758-2946-5-24
Publisher’s Note