U.S. Department of Health and Human Services
Assistant Secretary for Planning and Evaluation
Office of Disability, Aging and Long-Term Care Policy
M
ODELING THE
D
ECISION TO
P
URCHASE
P
RIVATE
L
ONG
-T
ERM
C
ARE
I
NSURANCE
Office of the Assistant Secretary for Planning and Evaluation
The Office of the Assistant Secretary for Planning and Evaluation (ASPE) is the principal advisor to the Secretary of the Department of Health and Human Services (HHS) on policy development issues, and is responsible for major activities in the areas of legislative and budget development, strategic planning, policy research andevaluation, and economic analysis.
ASPE develops or reviews issues from the viewpoint of the Secretary, providing a perspective that is broader in scope than the specific focus of the various operating agencies. ASPE also works closely with the HHS operating divisions. It assists these agencies in developing policies, and planning policy research, evaluation and data collection within broad HHS and administration initiatives. ASPE often serves a coordinating role for crosscutting policy and administrative activities.
ASPE plans and conducts evaluations and research--both in-house and through support of projects by external researchers--of current and proposed programs and topics of particular interest to the Secretary, the Administration and the Congress.
Office of Disability, Aging and Long-Term Care Policy
The Office of Disability, Aging and Long-Term Care Policy (DALTCP), within ASPE, is responsible for the development, coordination, analysis, research and evaluation of HHS policies and programs which support the independence, health and long-term care of persons with disabilities--children, working aging adults, and older persons. DALTCP is also responsible for policy coordination and research to promote the economic and social well-being of the elderly.
In particular, DALTCP addresses policies concerning: nursing home and community-based services, informal caregiving, the integration of acute and long-term care,
Medicare post-acute services and home care, managed care for people with disabilities, long-term rehabilitation services, children’s disability, and linkages between employment and health policies. These activities are carried out through policy planning, policy and program analysis, regulatory reviews, formulation of legislative proposals, policy
research, evaluation and data planning.
This report was prepared under contract between HHS’s ASPE/DALTCP and the Urban Institute. For additional information about this subject, you can visit the DALTCP home page at http://aspe.hhs.gov/_/office_specific/daltcp.cfm or contact the ASPE Project Officer, John Drabek, at HHS/ASPE/DALTCP, Room 424E, H.H. Humphrey Building, 200 Independence Avenue, S.W., Washington, D.C. 20201. His e-mail address is: John.Drabek@hhs.gov.
M
ODELING THE
D
ECISION TO
P
URCHASE
P
RIVATE
L
ONG
-T
ERM
C
ARE
I
NSURANCE
Richard W. Johnson Simone G. Schaner Desmond Toohey
Cori E. Uccello The Urban Institute
January 2007
Prepared for
Office of Disability, Aging and Long-Term Care Policy Office of the Assistant Secretary for Planning and Evaluation
U.S. Department of Health and Human Services
The authors are grateful to Jim Robinson of the University of Wisconsin-Madison for generously providing us with his actuarial model of long-term care services use, Jon Bakija of Williams College for generously providing us with his federal and state income tax calculator, and Marc Cohen, John Drabek, Amy Finkelstein, Mark Pauly, and especially Peter Kemper for valuable comments on an earlier draft. The views expressed here are those of the authors and should not be attributed to the U.S. Department of Health and Human Services or the Urban Institute, its board, or its funders.
TABLE OF CONTENTS
EXECUTIVE SUMMARY...iv
I. INTRODUCTION... 1
II. HOW DOES PRIVATE LONG-TERM CARE INSURANCE WORK?... 3
Pricing ... 5
Lapse Rates ... 5
III. WHO BUYS LONG-TERM CARE INSURANCE?... 9
Previous Literature ... 9
Limitations of Existing Studies ... 12
IV. METHODOLOGICAL APPROACH... 16
V. DATA AND MEASURES... 19
Health and Retirement Study... 19
Computing the Net Expected Benefit of Coverage ... 21
Other Measures... 25
Sample Characteristics... 25
VI. MODEL ESTIMATES AND POLICY SIMULATIONS... 40
Policy Simulations ... 41
VII. CONCLUSIONS... 46
LIST OF FIGURES AND TABLES
TABLE II-1. Mean Annual Premiums Among Policies Purchased in 2002, by Age
and Inflation Protection ... 7 TABLE II-2. Voluntary Long-Term Care Insurance Lapse Rates, by Selected
Characteristics, 2000-2001 ... 8
TABLE III-1. Characteristics of Individual Long-Term Care Insurance Buyers,
Nonbuyers, and the General Population Age 55 and Older, 2000 ... 14 TABLE III-2. Opinions About Long-Term Care Among Buyers and Nonbuyers of
Individual Long-Term Care Insurance Age 55 and Over, 2000... 15
TABLE V-1. Buyer Profiles, Age 55 and Older, 2000 and 2002... 26 TABLE V-2. Share of Noninstitutionalized Population Age 55 and Older with
Given Characteristic and Share with Private Long-Term Care
Insurance Coverage, 2002... 27 TABLE V-3. Share of Noninstitutionalized Population Age 55 and Older with
Private Long-Term Care Insurance Coverage, by Economic Status
and Age, 2002 ... 28 TABLE V-4. Average Annual Premiums in the Individual Long-Term Care
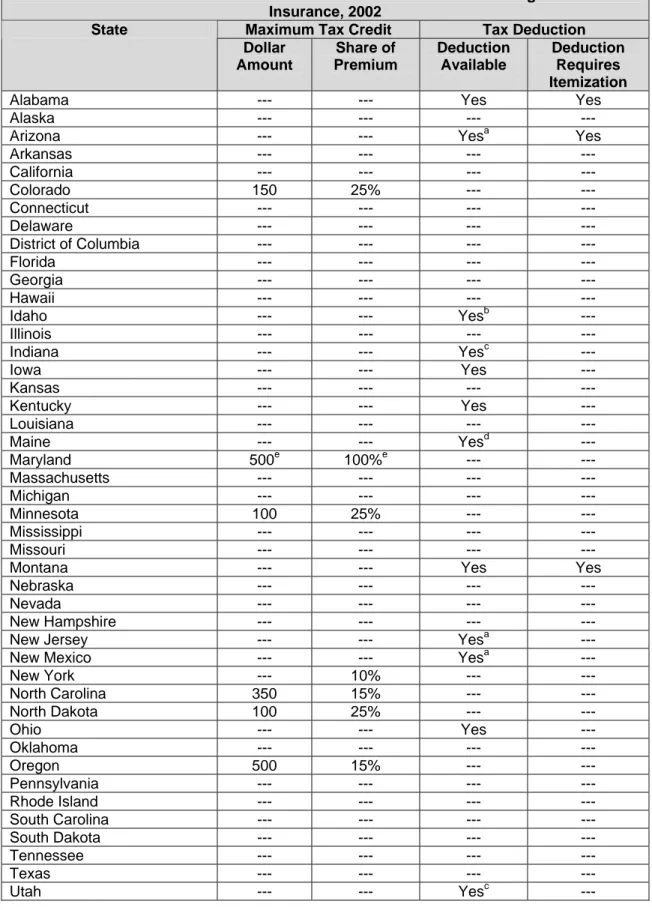
Insurance Market, by State and Selected Issue Age, 2002 ... 29 TABLE V-5. State Income Tax Deductions and Credits for Private Long-Term
Care Insurance, 2002 ... 31 TABLE V-6. Average Nursing Costs and Home Health Care Costs, by
State, 2002 ... 33 TABLE V-7. Medicaid Eligibility Standards, Personal Needs Allowance, and
Spousal Impoverishment Resource Limits for Institutionalized
Individuals, by State, 2001/2002... 35 TABLE V-8. Medicaid Eligibility Rates for Home and Community-Based Care
for Age Adults, by State, 2001/2002 ... 37 TABLE V-9. Descriptive Statistics of Variables in Logit Models ... 39
TABLE VI-1. Estimated Odds Ratios of the Purchase of Private Long-Term Care
Insurance, with Standard Errors in Parentheses... 43 TABLE VI-2. Share of Adults Age 63-73 in 2004 Who Took Up Private Long-
Term Care Insurance Coverage Between 1992 and 2004, Under
Current Law and Alternative Policy Scenarios ... 45 TABLE VI-3. Impact of Long-Term Care Insurance Policy Reforms on Medicaid-
EXECUTIVE SUMMARY
Long-term care spending is expected to soar in coming decades as the population ages. Enhanced private insurance coverage of long-term care needs might ease the looming crisis. Raising private insurance coverage rates would increase the pool of funds set aside to finance future services and would reduce reliance on public resources. Enhanced private coverage could also protect families from catastrophic long-term care costs. Some policymakers have proposed expanding tax incentives for private long-term care coverage to stimulate demand.
To assess how different tax break proposals for private long-term care insurance might affect private coverage, we need better information on the decision to purchase long-term care insurance and the sensitivity of the purchase decision to price changes. This report describes the results of our efforts to model private long-term care insurance coverage and simulate policy reforms.
Background
Like traditional medical insurance, private long-term care insurance is a financial contract whereby the insurer agrees to provide covered benefits in exchange for regular premium payments by the policyholder. The cost and adequacy of policies vary by the types of services they cover, when they start paying benefits, how much they pay, and for how long.
Insurance companies generally price policies as a function of age at issue date, health status, and the comprehensiveness of the plan. Most insurers classify applicants into three broad health categories: preferred, standard, and substandard. Most
applicants qualify for standard rates, although according to one estimate 15 percent are denied coverage because of health problems. Policies are guaranteed renewable, and premiums remain fixed over the life of the contract. However, rates can rise for an entire class of policyholders if insurers can demonstrate that their costs exceed premium revenue, and rate increases have been common in recent years.
Methods
There are two principal challenges in modeling the decision to purchase private long-term care insurance, particularly the effect of prices on take-up rates. First, at any age uncovered individuals who live in the same state generally face the same
premiums, making it difficult to observe how coverage rates vary with price, controlling for age and state of residence. Second, covered people deciding whether to renew their policies face lower premiums than otherwise identical people without coverage deciding whether to purchase a policy for the first time. This relationship could bias the estimated impact of price on the coverage decision.
The analysis addressed these complexities by estimating hazard models of time to purchase private long-term care insurance as a function of the net benefit that
individuals expect to derive from the policy. The net expected benefit is the difference between what policyholders expect to receive in benefit payouts from the plan over their lifetimes, in present value terms, and what they expect to pay into the plan in the form of premiums. The measure, which accounted for state-level fluctuations in premiums and Medicaid eligibility rules, varied widely across individuals. Respondents were dropped from the sample once they purchased coverage, eliminating the correlation between premiums and past purchase decisions. Observing purchase decisions over an extended period, beginning when respondents were relatively young, reduced the
censoring problem that would otherwise result if we modeled only cases that had not yet purchased coverage at relatively old ages (and thus had revealed their reluctance to obtain coverage).
Data came primarily from the Health and Retirement Study (HRS), a nationally representative longitudinal survey of older Americans. The survey asks respondents whether they have any long-term care insurance (excluding government programs) that covers nursing home care for a year or more or some at-home personal or medical care, and when they purchased the policy. Follow-up questions added in 2002 ask whether the respondent had already described the plan to the interviewer, such as when reporting traditional health insurance plans, and if so to identify the plan. After reclassifying respondents as lacking private long-term care coverage if they described their private long-term care insurance policies as traditional health plans, Medicaid, or Medicare, we found that coverage rates in the HRS were consistent with industry estimates.
The sample consisted of person-year observations between 1992 and 2004 on adults ages 51-61 in 1992 who did not have coverage in the previous year. We
observed respondents every other year. We restricted our sample to respondents likely to satisfy long-term care insurers’ underwriting restrictions and thus able to purchase private coverage. We dropped respondents who reported any activity of daily living or instrumental activity of living limitations, kidney problems, history of stroke, or cognitive impairment, and who were not living in nursing homes. In 1992, about 5 percent of respondents were dropped from the sample because they reported one of these health problems. The share increased over time as the sample aged, rising to 32 percent in 2002. Overall, 17 percent of the person-year observations were dropped because of health problems or nursing home residence. The final sample consisted of 32,242 observations on 6,991 respondents.
Model Estimates
The net expected benefit of coverage significantly increased the likelihood of taking-up private long-term care insurance coverage, although the impact was modest.
• Every $1,000 increase in the net expected benefit of coverage would raise purchase probabilities by about 2.3 percent.
• Under the assumption that premium changes have the same effect on take-up rates as changes in expected out-of-pocket payments for services, this result implies a price elasticity of demand for private long-term care insurance of about -0.75.
• Take-up rates also increased with age, education, health status, and the self-assessed probability of using nursing home care in the next years. They declined with number of children, perhaps because children help with their parents’ home care or help finance nursing home costs.
Policy Simulations
Creating additional federal tax incentives for the purchase of private long-term care insurance would modestly boost take-up rates.
• Granting a full tax deduction to all itemizers, even those who spend less than 7.5 percent of adjusted gross income on medical expenses, would raise take-up rates by about 3 percentage points, from 14 percent to 17 percent, increasing the number of adults with coverage by about 21 percent.
• Take-up rates would rise to 19 percent if all taxpayers could fully deduct premium expenses from income subject to federal income taxes, representing about a 36 percent boost in the number of older adults with coverage.
• The impact of tax incentives on private long-term care insurance would be concentrated among high-income taxpayers. Tax breaks would have very little impact on coverage rates for adults in the bottom half of the income distribution.
I. INTRODUCTION
As the population ages, long-term care spending is expected to soar in coming decades. National health expenditures projections from the Centers for Medicare and Medicaid Services indicate that nursing home and home health costs will rise from $151 billion in 2003 to $291 billion in 2014 (Heffler et al. 2005). Costs are likely to grow even more rapidly in about 20 years when the oldest members of the baby boom cohort, born in the years following World War II, enter their 80s, a decade of life when many people need assistance with basic personal activities. Rising long-term care costs threaten older Americans’ retirement security. For example, more than one in 20 people now turning 65 will likely spend at least $100,000 out-of-pocket (in present discounted value) on long-term care (Kemper, Komisar, and Alecxih 2005/2006). Rising costs also create financial problems for Medicare and Medicaid, which now fund about 60 percent of long-term care expenditures (Congressional Budget Office 2004).
Enhanced private insurance coverage of long-term care needs might ease the looming crisis. Raising private insurance coverage rates would increase the pool of funds set aside to finance future services and would reduce reliance on public resources. Enhanced private coverage could also protect families from catastrophic long-term care costs.
Although the private long-term care insurance market has grown rapidly in recent years, relatively few Americans have coverage. To encourage more people to purchase policies, some policymakers have proposed expanding tax incentives for those with private long-term care coverage. Under current law, individuals can deduct premium expenses for qualified long-term care plans from their taxable income only if their total medical expenses (including premiums) exceed 7.5 percent of adjusted gross income. And the amount that can be deducted is capped. Extending tax breaks to all
policyholders and allowing the full deductibility of premium costs would lower the after-tax price of long-term care policies for some consumers, and could significantly raise coverage rates.
To assess how different tax break proposals for private long-term care insurance might affect private coverage, we need better information on the decision to purchase long-term care insurance and the sensitivity of the purchase decision to price changes. This report describes the results of our efforts to model private long-term care insurance coverage and simulate policy reforms.
The report is organized as follows. The next two chapters provide background on private long-term care insurance, first describing how policies work and how much they tend to cost, and then describing who buys them. Chapter 4 discusses our
methodological approach. Chapter 5 describes the data and the measures we construct from them. Chapter 6 reports the model estimates and results from our policy
The findings show that extending tax breaks for private long-term care insurance could modestly expand coverage. In 2004 about 14 percent of adults ages 63-73 had purchased private long-term care insurance at some point since 1992. Because the purchase decision responds to price changes, reforming the tax law to allow all policyholders to deduct their premium expenses from taxable income would raise purchase rates by about one-third.
II. HOW DOES PRIVATE LONG-TERM CARE
INSURANCE WORK?
Like traditional medical insurance, private long-term care insurance is a financial contract whereby the insurer agrees to provide covered benefits in exchange for regular premium payments by the policyholder. The long-term care insurance market has grown steadily over the past 20 years. First sold as nursing home insurance in the 1970s, it now covers a wide range of services, including home care, adult day care, and assisted living, in addition to nursing home care. The cumulative number of long-term care insurance policies purchased has increased from fewer than 1 million in 1987 to over 9 million by the end of 2002, but still covers only a small share of the population (America’s Health Insurance Plans (AHIP) 2004).
Long-term care insurance can be purchased through either the individual or group market. Group plans are typically sponsored, but not subsidized, by employers.
Individual policies continue to dominate the market, but employer-sponsored plans are growing rapidly, fueled in part by the creation of the Federal Long-Term Care Insurance Program in 2002, which allows federal employees, retirees, and some of their family members to purchase coverage through the Federal Government. In addition to
offering group coverage to 20 million eligible Americans, the federal program could also encourage other employers to sponsor long-term care insurance. In 2006, 12 percent of all private-sector workers (and 20 percent of workers at private establishments with 100 or more employees) had access to long-term care insurance at work (U.S. Bureau of Labor Statistics 2006). About one-third of new policies sold in 2002 were sponsored by employers. By contrast, only 18 percent of policies ever sold by 2002 were employer-sponsored plans (AHIP 2004).
The cost and adequacy of policies vary by the types of services they cover, when they start paying benefits, how much they pay, and for how long. About three-quarters (77 percent) of individual policies purchased in 2000 covered both nursing homes and home care (LifePlans, Inc. 2000). In 1990, by contrast, nearly two-thirds of policies sold covered only nursing home care.
Benefit Triggers. Policyholders cannot collect benefits until their disabilities reach the levels specified in their contracts. About nine in ten plans now sold use the triggers specified in the Health Insurance Portability and Accountability Act (HIPAA) of 1996 to qualify for tax breaks (AHIP 2004). These plans require that beneficiaries need
substantial assistance with at least two out of six activities of daily living (ADLs) and that their disabilities are expected to last 90 or more days, or that they need regular
supervision because of severe cognitive impairment. (Benefits paid to policyholders who do not meet the HIPAA criteria are subject to federal income tax.)
Elimination Period. Most plans impose deductibles by delaying benefits for a period of time after the onset of a qualified disability. Among comprehensive policies
purchased in 2000 (covering both nursing home and home care), the average
elimination period, as it is known, was 47 days (LifePlans, Inc. 2000). Among nursing home-only plans, the average elimination period was 65 days. Just about half of all plans purchased in 2000 imposed an elimination period of between 90 and 100 days; only 3 percent stipulated elimination periods longer than 100 days. However, nearly one-quarter of policies purchased in 2000 did not impose any elimination period, and instead promised to pay benefits immediately upon the onset of a qualified disability.
The elimination period may be computed on the basis of service days, rather than calendar days (Center for Medicare Education 2004). Under the service day method, only days spent in nursing homes with a qualified disability count toward satisfying the elimination period. Days spent with a qualified disability outside a nursing home do not count.
Daily Benefit Amount. Policies limit how much they will pay per day of nursing home care and home care. In 2000, the average nursing home daily benefit was $109 (LifePlans, Inc. 2000). By comparison, the average nursing facility rate was $150 per day in 2001 (AARP 2002) and $192 per day in 2004 (MetLife 2004). Only 23 percent of policies sold in 2000 limited the nursing home daily benefit to less than $90; 34 percent of policies set the limit above $120. Daily benefits for home care are now comparable to nursing home benefits. In 2000, the average home care daily benefit was $106, and one-third of plans provided benefits of more than $120 per day (LifePlans, Inc. 2000). In 1990, policies generally set the home care benefit equal to one-half the nursing home benefit.
Benefit Escalation. A critical determinant of the adequacy of long-term care coverage is the extent to which the daily benefit amount grows over time. Since
policyholders often purchase coverage decades before they receive benefits, the growth in nominal long-term care costs can erode the value of the policy. In 2000, 41 percent of new buyers purchased inflation protection, up from 33 percent in 1995 (Cohen, Weinrobe, and Miller 2002). Inflation protection is especially common at relatively young ages. For example, 59 percent of new buyers ages 55-64 purchased inflation protection in 2000, compared with only 32 percent of those ages 70-74.
Inflation protection generally takes the form of a fixed percentage increase per year, typically 5 percent annually (Cohen, Weinrobe, and Miller 2002). Benefit escalators are not usually tied to changes in some price index. Policyholders can
generally choose between having benefits increase on a compounded basis or a simple interest basis. In 2000, 22 percent of new buyers chose the inflation protection with the compounded option, and 17 percent chose protection with the simple percentage increase option.
Duration of Benefits. About one-third of plans (30 percent in 2000) provide lifetime benefits (LifePlans, Inc. 2000). Most policies, however, limit periods to a specified number of years. Among policies purchased in 2000, 17 percent limited nursing home benefits to one or two years, 23 percent imposed a three-year limit, 14 percent imposed
a four-year limit, and 16 percent limited benefits to five or six years. Among plans with time limits, the average duration of nursing home benefits was 5.5 years. The
distribution of limits was similar for home care benefits.
Pricing
Insurance companies generally price policies as a function of age at issue date, health status, and the comprehensiveness of the plan (Brown and Finkelstein 2004b). Most insurers classify applicants into three broad health categories: preferred, standard, and substandard. Most applicants qualify for standard rates, although according to one estimate 15 percent are denied coverage because of health problems (Weiss Ratings, Inc. 2002). Policies are guaranteed renewable, and rates do not increase in response to a health decline for a given individual. Instead, once the policy is purchased,
premiums remain fixed in nominal terms over the life of the contract. However,
premiums can rise for an entire class of policyholders if insurers can demonstrate that their costs exceed premium revenue, and rate increases have been common in recent years. Premiums do not generally differ by gender (Finkelstein and McGarry 2006), even though women exhibit higher long-term-care utilization rates than men. Some plans offer discounts to married policyholders when their spouses are also covered.
Table II-1 reports mean annual premiums for policies sold in 2002, by the age of the policyholder and the presence of inflation protection. Prices refer to a policy that provides up to four years of benefits, with a $150 daily benefit and a 90-day elimination period. The inflation protection option increases benefits by 5 percent per year,
compounded annually. Premiums vary dramatically by age. The mean annual premium for 40-year-olds who declined inflation protection was $422. The mean annual
premiums for the same policy was $564 at age 50, $1,337 at age 65, and $5,330 at age 79. For policies purchased at ages 40 and 50, the inflation protection option more than doubles the annual premium. For coverage purchased at age 79, inflation protection increases premiums by less than half.
Brown and Finkelstein (2004b) find that private long-term care insurance policies are generally priced higher than the actuarially fair level for men, but lower than the actuarially fair level for women, who are much more likely to utilize benefits. The typical load factor for men was 0.44, implying that male policyholders can only expect to
receive 56 cents in benefits for every dollar they spend on premiums. For women, the typical load factor was -0.04, implying that they can expect $1.04 in benefits for every dollar they spend on premiums.
Lapse Rates
When modeling participation in long-term care insurance plans, it is also important to incorporate assumptions regarding policy lapses. A substantial share of purchasers drop their coverage within a few years of purchase (McNamara and Lee 2004). Unless
these individuals replace these policies with other plans, they will not have private insurance to fund any long-term care needs.
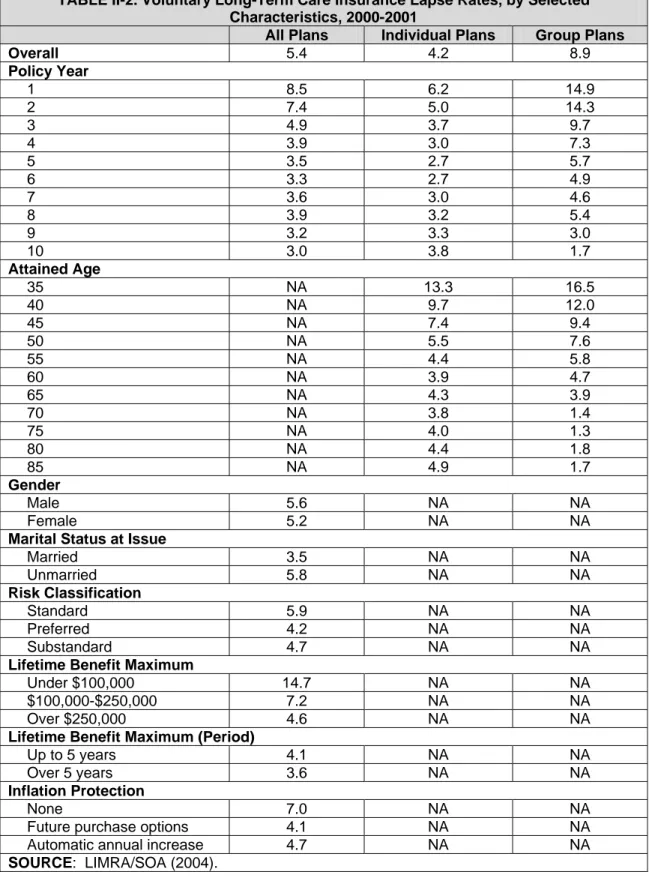
The Society of Actuaries (SOA) has conducted persistency studies on long-term care insurance using administrative data gathered from long-term care insurance carriers. Their most recent study, done in conjunction with LIMRA (2004), examined persistency and lapse rates during 2000 and 2001. They found overall voluntary lapse rates (that is, those resulting from reasons other than death) of 5.4 percent, down from the 7.6 percent rate experienced between 1984 and 1999.1
Lapse rates varied considerably by policy and insured characteristics (Table II-2). In particular, lapse rates declined with the duration of the policy, especially for group policies. Lapse rates for group policies exceeded 14 percent for each of the first two policy years, then decreased gradually, falling to about 3 percent or less after policy year ten. Lapse rates for individual policies fell below those of group policies in the initial years, but slightly exceeded the individual lapse rates in policy year nine and beyond.
Lapse rates also decreased with age, and were especially high for individuals younger than 45. Lapse rates for men and women were very similar, but unmarried policyholders had somewhat higher lapse rates. Interestingly, policyholders with a standard risk classification have somewhat higher lapse rates than those in the preferred risk category, as well as those in the substandard risk category.
More generous plan design features were associated with lower-than-average lapse rates. For instance, policyholders with a lifetime benefit maximum over $100,000 were less than half as likely to lapse than those with higher lifetime maximums. In addition, policyholders with inflation protection were less likely to lapse. It is unclear from the LIMRA/SOA study whether policyholders who voluntarily terminated their policies replaced them with other policies. Higher lapse rates for less generous policies could reflect the tendency of these policyholders to replace their plans with more
generous coverage. Or, it could be that individuals with fewer financial resources purchase less generous plans, and then are forced to drop them because they are unable to keep up with the premiums.2
1
LIMRA and SOA acknowledge that their reported lapse rates could be overstated if some unreported deaths were counted as voluntary lapses.
2
Finkelstein, McGarry, and Sufi (2005) conclude that many people who let their policies lapse choose to drop their coverage because they realize that their risk of needing long-term care services is lower than they originally thought.
TABLE II-1. Mean Annual Premiums Among Policies Purchased in 2002, By Age and Inflation Protection ($)
Age No Inflation Protection With Inflation Protection
40 422 890
50 564 1,134
65 1,337 2,346
79 5,330 7,572
SOURCE: AHIP (2004).
NOTE: Prices refer to a policy that provides up to four years of benefits, with a $150 daily benefit and a 90-day elimination period. The inflation protection option increases benefits by 5 percent per year, compounded annually.
TABLE II-2. Voluntary Long-Term Care Insurance Lapse Rates, by Selected Characteristics, 2000-2001
All Plans Individual Plans Group Plans
Overall 5.4 4.2 8.9 Policy Year 1 8.5 6.2 14.9 2 7.4 5.0 14.3 3 4.9 3.7 9.7 4 3.9 3.0 7.3 5 3.5 2.7 5.7 6 3.3 2.7 4.9 7 3.6 3.0 4.6 8 3.9 3.2 5.4 9 3.2 3.3 3.0 10 3.0 3.8 1.7 Attained Age 35 NA 13.3 16.5 40 NA 9.7 12.0 45 NA 7.4 9.4 50 NA 5.5 7.6 55 NA 4.4 5.8 60 NA 3.9 4.7 65 NA 4.3 3.9 70 NA 3.8 1.4 75 NA 4.0 1.3 80 NA 4.4 1.8 85 NA 4.9 1.7 Gender Male 5.6 NA NA Female 5.2 NA NA
Marital Status at Issue
Married 3.5 NA NA Unmarried 5.8 NA NA Risk Classification Standard 5.9 NA NA Preferred 4.2 NA NA Substandard 4.7 NA NA
Lifetime Benefit Maximum
Under $100,000 14.7 NA NA
$100,000-$250,000 7.2 NA NA
Over $250,000 4.6 NA NA
Lifetime Benefit Maximum (Period)
Up to 5 years 4.1 NA NA
Over 5 years 3.6 NA NA
Inflation Protection
None 7.0 NA NA
Future purchase options 4.1 NA NA
Automatic annual increase 4.7 NA NA
III. WHO BUYS LONG-TERM CARE INSURANCE?
A few existing studies examine who purchases private long-term care insurance coverage and the factors influencing their decisions. However, data problems limit many of these studies, and only one attempts to estimate the price elasticity of demand for long-term care insurance, which is critical for assessing the likely impact of tax breaks on coverage rates.Previous Literature
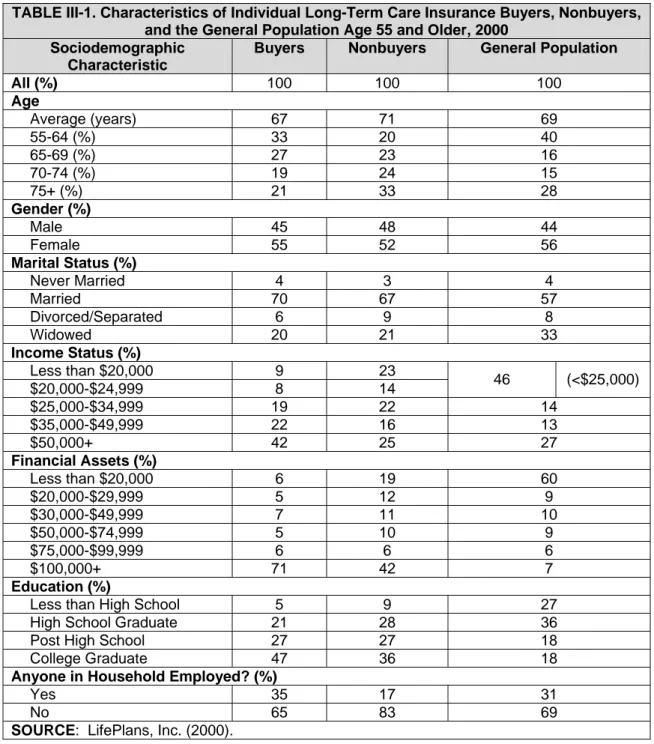
LifePlans, Inc. (2000) has examined who purchases long-term care insurance, who does not, and the reasons behind their decisions. Their 2000 study compared adults ages 55 and older who purchased individual long-term care insurance coverage to “nonbuyers” -- those who had been approached by an agent or presented the details of a long-term care policy but chose not to purchase. The study also compared both groups to the general population ages 55 and older. In general, the analysis found that long-term care insurance purchasers had higher incomes and more wealth than
nonbuyers and the general older population (Table III-1). For instance, whereas only one-quarter of nonbuyers and the general older population had incomes of at least $50,000, 42 percent of buyers had incomes of $50,000 or more. Differences in financial assets were even more dramatic. Seventy-one percent of buyers had financial assets exceeding $100,000, compared with only 42 percent of nonbuyers and a mere 7 percent of the general population. Long-term care insurance buyers were also better educated, more likely to be married, and more likely to be either working themselves or married to workers than nonbuyers. The average age of buyers (67) was also
somewhat lower than nonbuyers (71) and the general population ages 55 and older (69).
The LifePlans analysis of buyers and nonbuyers, however, may not generalize to the entire population of long-term care insurance purchasers. Because it was limited to those who purchased individual long-term care insurance, it does not reflect the
characteristics of individuals who purchased group insurance, through either an association or an employer group. According to the American Council of Life Insurers (2003), those who purchased long-term care insurance in 2001 through a group were much younger on average than those who purchased individual insurance. One-third of group long-term care insurance purchasers were 40 or younger, compared with only 3 percent of individual long-term care insurance purchasers. Other characteristics, including income and assets, likely differ between individual and group purchasers as well.
The LifePlans study also provides insights into the views of buyers and nonbuyers and the reasons behind the purchase (or nonpurchase) decision (Table III-2). Buyers and nonbuyers were fairly similar in their opinions regarding the importance of planning for possible long-term care needs and concerns about how to pay for care. Their views
differed, however, on the perceived adequacy of insurance products and the proper role of government. Although nearly three-quarters of buyers believed that the insurance industry provides adequate coverage for long-term care services, only one-half of nonbuyers agreed. Nonbuyers were twice as likely as buyers (33 percent vs. 15
percent) to report that they could rely on the government to pay most of their long-term care costs.
Nearly one-third of individual long-term care insurance buyers in the LifePlans study cited protecting assets or leaving an estate as the most important reason for their purchase. This in part explains the low share of buyers with initial wealth. Other
reasons cited included avoiding dependence (19 percent), protecting living standards (12 percent), and ensuring affordability of future care (14 percent). Individuals who chose to decline coverage most often cited cost as the reason. More than one-half of nonbuyers reported that coverage is too costly. Other reasons for forgoing coverage included that they were waiting for a better policy, found it hard to choose a policy, or did not believe insurers’ promises.
There have been relatively few econometric studies of private long-term care insurance coverage. Kumar et al. (1995) examined the decision to purchase coverage and the type of insurance that policyholders chose in a sample of about 6,500
individuals ages 55 and older who purchased coverage in late 1990 and early 1991 and about 1,200 individuals who had been approached by agents but chose not to
purchase. Individuals were surveyed by LifePlans, Inc., after being identified by six insurers that together represented 45 percent of the individual private market. The authors estimated a two-stage model that first predicted whether an individual purchased any coverage and then predicted the expected value of coverage among policyholders. The models controlled for age, gender, marital status, education, income, assets, expected cost of long-term care for the individual, state of residence, number of children living nearby, perceived risk of using services, characteristics of the Medicaid program in the state of residence, and the risk premium charged by the policy (for those who purchased coverage).
The results indicate that younger individuals, married people, women, and those without a college education were more likely to purchase coverage than other adults ages 55 and older. Coverage rates increased significantly with income, but not with assets. Those who reported their odds of using future nursing home care as greater than 50-50 were significantly more likely to buy coverage than other people, but those who believed that they were likely to use home care were significantly less likely to purchase coverage. The presence of children reduced the odds of coverage. People
were significantly less likely to purchase coverage as the state’s Medicaid per diem rate for nursing homes increased.3
Among those who purchased coverage, the risk premium charged by the policy significantly reduced the comprehensiveness of coverage. The authors computed the risk premium as the difference between the actual premium paid and the actuarially fair premium for the level-of-coverage purchased, given the individual’s age and gender. Policyholders who faced higher effective prices for coverage because they were likely to use fewer services tended to purchase less comprehensive coverage than other
policyholders. The results also indicated that men tended to purchase more
comprehensive coverage than women, even though men were less likely to purchase any coverage. (One possible explanation for this difference is that the level-of-coverage equations control for the risk premium, and women likely face lower risk premiums than men because they tend to use more long-term care services but premiums do not vary by gender.) The expected value of coverage was also relatively high among single people, those with college degrees, those with high incomes, and those with high expected lifetime usage of long-term care services.
Mellor (2001) used data on a sample of adults ages 70 and older in 1993 from the Health and Retirement Study (HRS) to examine the impact of unpaid caregivers on the coverage decision. She estimated probit models of the decision to purchase long-term care insurance, controlling for age, education, race, gender, marital status, household income, net worth, health status, and the presence or availability of unpaid caregivers. Not surprisingly, she found that the probability of private coverage increased
significantly with income, wealth, and education. Controlling for other factors, she found that race, gender, and marital status did not significantly affect the purchase decision. (In contrast, Kumar et al. (1995) found significant effects for gender and marital status, as noted earlier.) Older adults were somewhat more likely to purchase coverage than younger adults in her sample of people ages 70 and older, but the effect was only marginally significant. Private coverage rates were not significantly affected by the presence of limitations with ADLs or instrumental activities of daily living (IADLs), although those who reported being in poor health were somewhat less likely to have coverage. Interestingly, when controlling for demographic, financial, and health characteristics, the study found that respondents who were currently receiving unpaid help or those who reported having relatives or friends who would be willing to help if they needed assistance with basic personal care in the future were not significantly less likely to report private coverage than those without access to unpaid care.
3
Some of these findings appear to be at odds with the results from the LifePlans, Inc. (2000). For example, Kumar et al. (1995) found that those with limited schooling were more likely to purchase insurance than college graduates, whereas the LifePlans study showed that college graduates were more likely to purchase. Similarly, Kumar and colleagues did not find a significant effect of asset holdings on the purchase decision, whereas LifePlans found that coverage rates increased with wealth. The differences probably arise from the fact that Kumar and colleagues control for other factors in their model, whereas LifePlans reports simple cross-tabulations. Thus, college graduates may have higher coverage rates than nongraduates, but their rates may be lower holding financial resources
Finkelstein and McGarry (2006) used 1995 HRS data to examine private long-term care insurance coverage among adults ages 72 and older. They found that coverage rates increased with the perceived likelihood of using nursing home care, based on responses to a question asking individuals to measure the chances, on a scale from 0 to 100, that they will move to a nursing home in the next five years.
A recent study used 2002 HRS data to examine the impact of price on decisions by people ages 55 and older without private long-term care insurance to purchase
coverage. Cramer and Jensen (2006) estimated logit models of the purchase decision, as functions of the annual premium, income, assets, gender, marital status, number of children, race, ethnicity, geographic region of residence, probability of living ten or more years, self-reported health status, whether they plan to leave a bequest, parental
experience with long-term care, and whether they itemized deductions when filing their federal income tax returns. They used three different measures of price, each taken from industry sources: a 1996 rate schedule filed by GE Capital with the State of Michigan, 1999 rates filed by John Hancock Life Insurance with the State of New Jersey, and 2002 national insurance rate averages published by the Health Insurance Association of America. Cramer and Jensen found that the price generally had a significant but small negative effect on the likelihood of purchasing coverage, with estimated elasticities ranging from -0.23 to -0.87. Their results also indicated that well-educated adults, those who intend to leave bequests, and those who itemize their deductions are more likely to purchase coverage, whereas the number of children reduced the likelihood of coverage.
Limitations of Existing Studies
There are significant limitations to each of these studies. With the exception of Cramer and Jensen (2006), all are based on data that are now quite old, especially given the rapid growth in the private long-term care insurance market and changes in the characteristics of policyholders. For example, the average age of buyers in the individual market was 60 in 2002, down from 72 in 1990 (AHIP 2004). As a result, it is unclear how well the findings from these studies apply to today’s market conditions. In addition, it is unlikely that the sample examined by Kumar et al. (1995) is representative of the general population of older adults, because all of the respondents in that study had demonstrated some interest in purchasing long-term care insurance.
There are also problems with the questions about long-term care insurance coverage in the early years of the HRS. The 1993 survey, used by Mellor (2001), did not ask respondents specifically about long-term care insurance. Instead, it asked respondents whether they “have any (other) type of health insurance coverage,” and then the kind of coverage they have (“basic health insurance, a supplement to Medicare (MEDIGAP) or to other health insurance, long-term care insurance, or what?”). Only 2 percent of respondents reported long-term care insurance coverage in 1993. The question was changed in 1995, when respondents were asked, “Aside from the government programs, do you have any insurance which specifically pays any part of
long-term care, such as personal or medical care in the home or in a nursing home?” This question, used in Finkelstein and McGarry (2006), generates a coverage rate of about 10 percent among adults ages 72 and older (up from 2 percent in the 1993 survey). However, this question also appears problematic, because many people are not well-informed about the nature of private long-term care insurance and may believe that they have coverage when in fact they do not. For example, a recent survey found that 31 percent of Americans ages 45 and older reported having private long-term care insurance (AARP 2001), an implausibly high figure given industry statistics. More than one-half of respondents believed that Medicare would cover extended nursing home stays. In 2002, the HRS survey first asked respondents follow-up questions about their reported private coverage, allowing researchers to identify respondents who mistakenly report Medicare and Medicaid as private long-term care insurance.
Perhaps most significant for our purposes, none of the existing studies provide a reliable estimate of the price elasticity of demand for private long-term care insurance coverage. To measure the potential impact of tax credits on the decision to purchase private coverage, we need to know how people will respond to a reduction in the after-tax premium. Although there are several estimates of price elasticities for general health insurance coverage (e.g., Gruber and Poterba 1994; Johnson, Moon, and Davidoff 2002; Marquis and Long 1995), there is little information on how changes in price affect the demand for long-term care insurance. Cramer and Jensen (2006) use recent high-quality data from the HRS to attempt to measure the price elasticity of demand for long-term care insurance, but their estimates are problematic. Of particular concern is their focus on the annual price while ignoring expected lifetime payouts. A 50-year-old woman, for example, faces lower annual premiums than a 70-year-old woman, but the younger policyholder surely recognizes that she will probably have to make many more annual payments before collecting benefits than the older woman. As a result, it is unclear how to interpret their findings on the relationship between take-up rates and annual premium payments, especially since the model does not control for the policyholder’s age.4
4
The only price variation in their study comes from the age of the policyholder and discounts for nonsmokers, presumably making it nearly impossible to estimate the model while controlling for the policyholder’s age.
TABLE III-1. Characteristics of Individual Long-Term Care Insurance Buyers, Nonbuyers, and the General Population Age 55 and Older, 2000
Sociodemographic Characteristic
Buyers Nonbuyers General Population
All (%) 100 100 100 Age Average (years) 67 71 69 55-64 (%) 33 20 40 65-69 (%) 27 23 16 70-74 (%) 19 24 15 75+ (%) 21 33 28 Gender (%) Male 45 48 44 Female 55 52 56 Marital Status (%) Never Married 4 3 4 Married 70 67 57 Divorced/Separated 6 9 8 Widowed 20 21 33 Income Status (%) Less than $20,000 9 23 $20,000-$24,999 8 14 46 (<$25,000) $25,000-$34,999 19 22 14 $35,000-$49,999 22 16 13 $50,000+ 42 25 27 Financial Assets (%) Less than $20,000 6 19 60 $20,000-$29,999 5 12 9 $30,000-$49,999 7 11 10 $50,000-$74,999 5 10 9 $75,000-$99,999 6 6 6 $100,000+ 71 42 7 Education (%)
Less than High School 5 9 27
High School Graduate 21 28 36
Post High School 27 27 18
College Graduate 47 36 18
Anyone in Household Employed? (%)
Yes 35 17 31
No 65 83 69
TABLE III-2. Opinions About Long-Term Care Among Buyers and Nonbuyers of Individual Long-Term Care Insurance Age 55 and Over, 2000 (%)
Buyers Nonbuyers
It is important to plan now for the possibility of needing long-term care services:
Strongly Agree/Agree 99 92
Disagree/Strongly Disagree 1 8
I worry about how I would pay for care if needed:
Strongly Agree/Agree 72 74
Disagree/Strongly Disagree 29 26
The insurance industry provides adequate coverage for services:
Strongly Agree/Agree 72 49
Disagree/Strongly Disagree 28 51
If I ever needed care, the government would pay most of the costs:
Strongly Agree/Agree 15 33
Disagree/Strongly Disagree 84 67
Most important reason for buying individual long-term care insurance
Protect assets/leave an estate 31 NA
Avoid dependence 19 NA
Guarantee affordability 14 NA
Protect living standards 12 NA
Other 24 NA
Most frequently cited reason for nonpurchase of individual long-term care insurance
Too costly NA 54
Waiting for better policy NA 29
Hard to choose policy NA 18
Don't believe insurers NA 15
IV. METHODOLOGICAL APPROACH
There were two primary challenges in modeling the decision to purchase private long-term care insurance, particularly the effect of prices on coverage rates. First, at any age uncovered individuals who live in the same state generally face the same
premiums, so it is difficult to observe how coverage rates vary with price, controlling for age and state of residence. Second, the premiums people face when considering private coverage depends on whether they purchased coverage in the past.
Covered adults who must decide each year whether to continue their coverage or let it lapse face lower premiums than uncovered adults. Annual premiums increase with age of initial purchase, but remain fixed over the life of the policy (unless unexpectedly large claims force the insurer to raise premiums for the entire class of policyholders). Consequently, in a simple equation that models coverage as a function of premiums, the error term is likely to be positively correlated with the premium, biasing upwards the estimated premium coefficient. Covered adults, who face lower premiums than
uncovered adults, are probably more likely to purchase coverage by renewing their policies than uncovered adults, holding observable factors constant, because their prior purchase reveals their coverage preferences. Modeling coverage in a single year only for older people who have not already purchased is problematic, because these people have already revealed their reluctance to obtain private insurance.
The analysis addressed these complexities by estimating hazard models of time to purchase private long-term care insurance as a function of the net benefit that
individuals expect to derive from the policy. The net expected benefit is the difference between what policyholders expect to receive in benefit payouts from the plan over their lifetimes, in present value terms, and what they expect to pay into the plan in the form of premiums.5 Individuals were dropped from the sample once they purchased coverage, eliminating the correlation between premiums and past purchase decisions. Observing purchase decisions over an extended period, beginning when respondents were relatively young, reduced the censoring problem that would otherwise result if we modeled only cases that had not yet purchased coverage at relatively old ages.
We can express the net expected benefit of purchasing private long-term care insurance as:
(1)
5
This approach is a simplified version of the method developed by Brown and Finkelstein (2004a) to show why prototypical adults are unlikely to purchase private long-term care insurance. Using dynamic programming techniques, they traced out the optimal consumption path for typical 65-year-old men and women and demonstrated that only the wealthiest individuals could gain from the purchase of private insurance. The simplified version that we describe is more tractable than the Brown and Finkelstein specification.
where la,t is the probability of surviving from age a to age t, is the probability of
surviving from age t to age f for someone who began using long-term care services at age t, p
t f t
l,
t is the probability that an individual who survives to age t uses long-term care
services at that age, is the probability of having Medicaid coverage at age f for someone without private long-term care insurance who began using long-term care services at age t, is the probability of having Medicaid coverage at age f for someone with private long-term care insurance who began using long-term care services at age t, S n t f m , b t f m ,
f,t is the cost of services used at age f for someone who began using
services at age t, Xt is the maximum benefit payable by the policy at age t, Ct is the
after-tax premium price at age t for someone who purchased a policy at age a, and δ is the individual’s personal discount rate. The summation runs from current age a until T, the maximum lifespan.
The net expected benefit of private long-term care insurance coverage can be broken into three parts. The first term in equation (1) is the expected stream of lifetime payments for long-term care services if the individual does not purchase private
insurance. We computed a different lifetime stream of expected payments for every age at which long-term care needs may start, multiplied each stream by the probability p that long-term care services start at that age, and summed these values. Each year that she uses long-term care services she has a chance mn of qualifying for Medicaid, which partly depends on how long she has been using services (and depleting her assets). If she qualifies, we assumed she pays nothing for the services she receives. If not, she pays the full cost of services out-of-pocket. Service intensity (and hence cost) in any year depends on when she first began receiving care.
The second and third terms are the expected lifetime stream of payments for an individual who purchases private long-term care insurance. The second term is the stream of out-of-pocket payments for services. As with the first term, the lifetime
payment stream varies with the age at which long-term care needs begin, so we needed to compute separate probability-weighted streams for each possible age and sum them together. If the policyholder qualifies for Medicaid, she pays nothing. Otherwise, she pays only those costs that exceed the maximum benefit payable by the policy. The third term totals expected annual lifetime premiums paid by the policyholder. The plan we model requires policyholders to pay premiums only when they are not collecting benefits from the plan. Combining all three terms in equation (1), the net expected benefit of private long-term care insurance can be viewed as the difference between what
uncovered older adults can expect to pay for lifetime services and what covered adults can expect to pay in premiums and payments for services that exceed the maximum payable benefits for their policies.
The net expected benefit computation ignores Medicare, which covers long-term care services only under certain circumstances. Medicare coverage of in-home care is restricted to skilled nursing care provided on a part-time or intermittent basis to
those who are still receiving skilled care. It does not include homemaker services or personal care for people who do not receive skilled nursing care. For nursing home care, Medicare covers only short stays that follow hospitalizations.
The analysis examined the impact of the net expected benefit of private long-term care insurance on purchase decisions by including the measure as a regressor in a logit model of coverage. The data tracked individuals over time, and thus included multiple observations on each respondent. We excluded from the sample respondents with coverage at baseline, and observations on a given individual ceased when the individual purchased coverage or when the survey ended. Because the data were arranged in person-year format, the results can be interpreted as discrete-time hazard models (Allison 1984). We expected that the likelihood of purchasing coverage would increase with the expected net benefit. The model controlled for other factors likely to affect purchase decisions, including age, income, overall health status, education, marital status, gender, race, income, assets, number of children, and the self-assessed likelihood that the individual will someday enter a nursing home.
We used the model to simulate the likely impact of several policy levers on private coverage. We assessed tax incentives for long-term care insurance by recomputing the net expected benefit of coverage and using the model to measure the likely impact on take-up rates. We could also use the model to assess how various Medicaid reform options might affect coverage rates (although the present analysis is restricted to the potential impact of tax incentives).
V. DATA AND MEASURES
The primary data for our study came from the HRS, supplemented by data from several other sources to compute the net expected benefit of private coverage.
Health and Retirement Study
The HRS is a nationally representative longitudinal survey of older Americans that collects detailed information on health status, economic resources, demographic
characteristics, family structure, and health insurance, including private long-term care insurance policies. Conducted by the University of Michigan with primary funding from the National Institute on Aging, the HRS began in 1992 with interviews of 9,814 adults born between 1931 and 1941, when they were ages 51-61. Respondents were
reinterviewed every other year. The HRS began interviewing other cohorts after 1992. In 1993 the survey added adults born before 1924 to the sampling frame and in 1998 it added adults born between 1924 and 1930 and those born between 1942 and 1947.6 In 2002, then, the HRS sample consisted of Americans ages 55 and older. The most recent survey data are from 2004.
Rates of private long-term care insurance coverage in the later waves of the HRS seem reasonable. The survey asks respondents whether they have any long-term care insurance (excluding government programs) that cover nursing home care for a year or more or some at-home personal or medical care. Follow-up questions added in 2002 (and repeated in subsequent years) ask whether the respondent had already described the plan to the interviewer, such as when reporting traditional health insurance plans, and if so to identify the plan. We reclassified respondents as not having private long-term care insurance if they said that their private long-long-term care insurance policies were Medicaid, Medicare, or traditional health plans. This recoding reduced the share of respondents ages 55 and older with private coverage in 2002 from 11.4 percent to 9.1 percent, dropping population estimates (based on the HRS sample weights) from 6.99 million to 5.41 million. AHIP (2004) estimated that the cumulative number of long-term care insurance policies sold reached 9.2 million in 2002. Approximately 72 percent, or 6.60 million, remained in force in 2002. The lower HRS estimate covers only the older population, which holds many, but not all, of the long-term care policies in force.
The profile of private long-term care insurance purchasers in the HRS is similar to the profile of buyers reported by LifePlans, Inc. (2000). Table V-1 compares the
characteristics of new long-term care insurance purchasers in the 2000 and 2002 HRS and those in the LifePlans, Inc. study of long-term care insurance buyers and nonbuyers
6
ages 55 and older in 2000.7 The HRS buyers (especially in 2000) were quite similar to the LifePlans buyers in terms of age, gender, marital status, and the presence of an employed adult in the household. Although the average age of purchasers was lower in the 2002 HRS sample than in the other samples, this decline may reflect an increase over time in the purchase of group coverage, which tends to attract younger enrollees than individual plans. Purchasers in the 2000 HRS had somewhat less education than those in the LifePlans sample, although average educational attainment was similar for the 2002 HRS buyers and the LifePlans buyers.
Income and wealth differ substantially between the HRS and LifePlans samples. In 2000, the HRS sample included more buyers with incomes over $50,000 (52 percent) than the LifePlans sample (42 percent). And the differences widen in the 2002 sample. At the same time, the HRS buyers were more likely to hold financial assets worth less than $20,000 (29 percent) than the LifePlans sample (6 percent). These differences largely remain in the 2002 sample. Differences in the income and assets distributions could arise for a couple of reasons. First, the LifePlans data reflect individual long-term care insurance purchasers only, not group market purchasers. Group purchasers may have higher incomes than individual purchasers because they are more likely to be employed. They may also have lower assets because they tend to be younger. Second, the LifePlans and HRS surveys may use different definitions of income and wealth.
HRS data indicate that 9.0 percent of noninstitutionalized adults ages 55 and older had private long-term care insurance coverage in 2002 (Table V-2). Coverage rates were somewhat lower at ages 55-64 (7.3 percent), and somewhat higher at ages 65-74 (10.7 percent). Rates increased rapidly with education and health status. For example, 12.2 percent of older adults who described their health as excellent or very good reported coverage, compared with only 4.5 percent of those in fair or poor health. Only about 3 percent of those who did not complete high school had coverage, compared with 17 percent of college graduates. Rates were also higher among Whites than African Americans and Hispanics, and higher among married adults than those who were divorced or widowed. Women were somewhat more likely to report coverage than men.
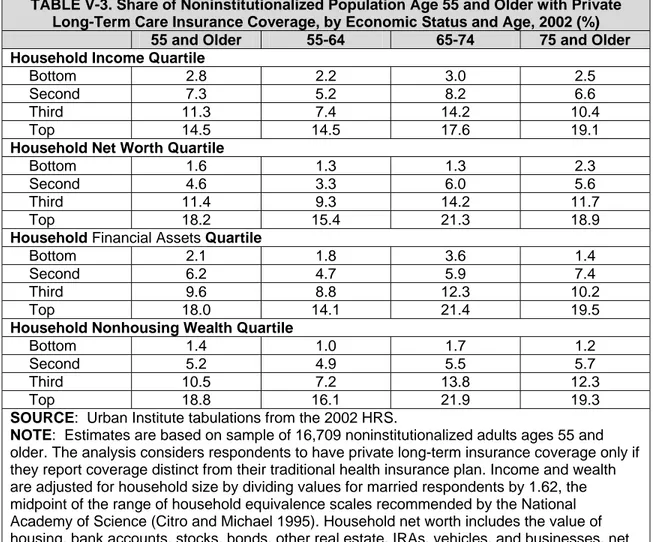
Coverage rates in the HRS also increased with income and assets (Table V-3). About 15 percent of adults ages 55 and older in the top quartile of the household income distribution reported coverage in 2002, compared with only about 3 percent of those in the bottom quartile and about 7 percent of those in the second quartile. Similarly, about 18 percent of adults ages 55 and older in the top quartile of the
distribution of household net worth (consisting of the value of financial assets, housing, and other real assets) reported private long-term care insurance coverage in 2002. By comparison, only about 2 percent of those in the bottom quartile of the household net
7
The 2000 HRS sample includes all respondents who reported purchasing long-term care insurance, even those whose policies may in fact be traditional health insurance plans. This misclassification probably has only a small impact on the profile of new long-term care insurance purchasers, however, because there are only minor differences in the 2002 HRS buyer profiles between the sample that includes everyone who reported long-term care coverage and the subset of those with policies that differed from their traditional health insurance plans.
worth distribution, and 5 percent of those in the second quartile reported private long-term care insurance.
For our analysis we used data on respondents in the original HRS cohort (ages 51-61 when first interviewed in 1992) who responded to the 2002 survey. The 2002 and 2004 surveys asked covered respondents when they purchased their long-term care insurance polices, and asked uncovered respondents if they had ever purchased long-term care insurance. We used this information to delong-termine purchase decisions before 2002, because the earlier survey questions were less reliable. However, we did use the earlier survey responses for the relatively few respondents without insurance in 2002 who reported having had coverage in the past, because the 2002 survey did not ask those with lapsed policies when they first purchased them.
Computing the Net Expected Benefit of Coverage
As described in the previous chapter, the net expected benefit of private long-term care insurance coverage depends on how much people pay for private insurance after taxes, expected usage of long-term care services, expected cost of services in the absence of private insurance, and the likelihood of qualifying for Medicaid. The expected present value calculations assumed a personal discount rate of 3 percent, inflation rate of 3 percent, and real wage growth of 1 percent. They also assumed that future real tax rates equal the rates that prevailed in 2004 and that mortality
expectations were consistent with the Robinson model of long-term care use, described in detail later in the chapter.
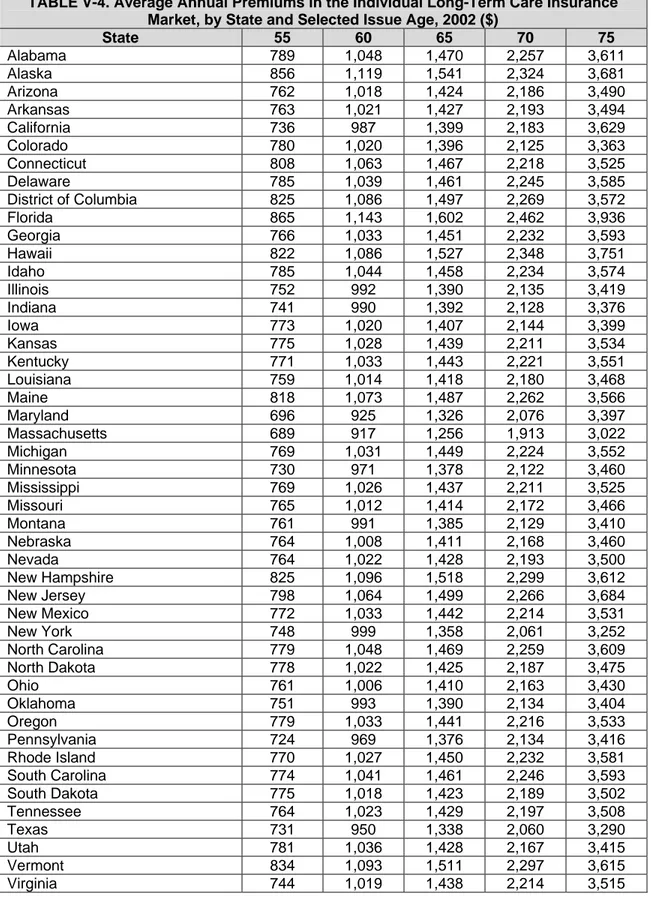
Long-Term Care Insurance Premiums. We obtained premium information from Weiss Ratings, Inc., a private insurance rating firm in Jupiter, FL. They provided us with average premiums by state and issue age, based on a 2003 survey of 26 insurers.8 The premiums were for plans that provided coverage for nursing home, assisted living facility, home health, and community-based care, with a 20-90 day elimination period, 3-6 year benefit period, $100 daily benefit, and inflation protection. We deflated premiums for earlier years and inflated them for 2004 by the change in the national average daily private-pay rate for a semi-private room in a nursing home (Metlife various years).
Table V-4 reports 2002 premiums by state and selected issue age. They increased rapidly with age and varied by state. For example, in New York the average premium increased from $748 when issued at age 55, to $1,358 at age 65, to $3,252 at age 75.
8
Weiss collected premium data from Bankers Life and Casualty, Blue Cross Blue Shield of Minnesota, Catholic Order of Foresters, Cincinnati Life Insurance, Colonial American Life Insurance, Combined Insurance Company of America, Country Life Insurance, Equitable Life and Casualty, Farmers New World Life Insurance, First Unum Life Insurance, General Electric Capital Assurance, Great Republic Life Insurance, Guaranty Income Life Insurance, John Hancock, Kanawha, Mutual of Omaha, New York Life, Penn Treaty Network America, Physicians Mutual, Provident Life and Accident, State Farm, Teachers Protective Mutual Life, TIAA-CREF Life Insurance, United American, United Security Assurance Co. of Pennsylvania, and Unum Life.
At issue age 65, average premiums ranged from a low of $1,256 in Massachusetts to a high of $1,602 in Florida.
After-Tax Premiums. Some policyholders are able to lower the after-tax price of private long-term care insurance by deducting premium payments from income subject to federal and state taxes. The federal tax code considers a portion of premium
payments for qualified long-term care insurance policies as medical expenses, so they are deductible from taxable income to the extent that total medical expenses exceed 7.5 percent of adjusted gross income. However, the amount of premiums that can be
deducted is capped. In 2002, the maximum annual premium deduction was $240 at ages 40 and younger, $450 at ages 41-50, $900 at ages 51-60, $2,390 at ages 61-70, and $2,990 at ages 71 and older.
Many states also provide special tax breaks for private long-term care insurance. For example, some states provide tax credits for premiums expenses, up to certain limits expressed either as a share of premiums or a dollar amount. Other states allow taxpayers to deduct their premiums from their taxable income. Table V-5 reports the availability of state income tax breaks for private long-term care insurance in each of the states.
We estimated after-tax premiums by subtracting from premiums the reduction in federal and state tax liabilities that people can realize from purchasing long-term care insurance coverage. We estimated federal and state tax liabilities by applying the detailed tax calculator developed by Jon Bakija at Williams College. HRS collects
information on all sources of income. It also provides information on family structure and most types of deductible expenses, including out-of-pocket medical expenses,
charitable donations, property taxes, and outstanding mortgage debt, but not mortgage interest payments. We set mortgage interest payments equal to 6 percent of the
outstanding mortgage. The tax calculator estimated state tax liabilities, which taxpayers who itemize their deductions can also deduct from taxable income. We assumed that respondents claimed as dependents all children ages 18 or younger and children ages 19-23 attending school. The tax calculator selected which taxpayers itemized their deductions and which married taxpayers filed jointly so as to minimize tax liabilities.
Expected Use of Long-Term Care Services. Our estimates of expected long-term care usage were based on a transition model of different care states developed by Jim Robinson of the University of Wisconsin, a former member of the SOA’s Long-Term Care Insurance Valuation Methods Task Force. The model uses data from the 1985 National Nursing Home Survey and the 1982-1994 waves of the National Long-Term Care Survey to produce estimates of age and gender-specific Markov transition probabilities across four different care states: no care, home care, nursing home, and death. (The original model also modeled transitions into and out of assisted living.)
The model implies that a 65-year-old woman has a 44 percent chance of using a nursing home sometime in the future and that a 65-year-old man stands a 27 percent chance. On average, institutionalized women spend 1.3 years in nursing homes, and