AC 2008-835: OPTIMIZING DATA CENTER REDUNDANCY
Donald Merino, Stevens Institute of TechnologyDonald N. Merino is a tenured full professor and the Alexander Crombie Humphreys Chaired Professor of Economics of Engineering at Stevens Institute of Technology. He teaches
Engineering Economy, Decision Analysis, Total Quality Management, and Strategic Planning. He is Founder Emeritus of the undergraduate Bachelor of Engineering in Engineering
Management (BEEM) and the Executive Master in Technology Management (EMTM) Program at Stevens. He won the Morton Distinguished Teaching Award for full professors at Stevens. John Wiley published his book, “The Selection Process for Capital Projects”. Dr. Merino received two Centennial certificates from the ASEE in Engineering Economics and Engineering
Management. He is past Chair of the Engineering Management Division and Engineering Economy Division of ASEE.
Dr. Merino was awarded the ASEM and ASEE Bernard Sarchet Award. He is an ASEM and ASEE Fellow and past president of ASEM. Dr. Merino has 25 years of industrial experience in positions of increasing managerial / executive responsibilities. Since joining academe 24 years ago, he has published 32 refereed journal articles and conference papers and over 50 research reports.
Address: c/o School of Systems and Enterprise Stevens Institute of Technology, Hoboken, New Jersey, 07030 Work telephone: 201-216-5504; E-mail: dmerino@ stevens.edu.
Jakob Carnemark, SKANSKA
Jakob Carenmark is the head of SKANSKA's Mission Critical Center of Excellance (COE). Jakob developed this team to showcase SKANSKA's expertise in constructing Mission Critical facilities and to share best practices among various regions. Within this CEO team, Jacob leads some of the most creative and innovative minds in the data center construction industry. Mr. Carnemark has a degree in Civil Engineering from the University of Virginia, as well as 25 years of experience. His expertise covers all aspects of construction and enables him to provide meaningful and accurate insight to a project. His extensive knowledge and proficiency with Mission Critical facilities has taught him to understand their unique requirements as well as the security, safety,
© American Society for Engineering Education, 2008
P
Optimizing Data Center Redundancy Using
Life Cycle and Cost-Effective Analysis
Abstract
The major questions addressed in this paper are: What is the optimal tradeoff between capital cost and downtime/reliability for a data center? How much redundancy is justified?
Owners of data centers need to choose an engineering design to decide how much capital to spend in order to minimize the life cycle costs and maximize reliability. Data Center costs include the initial capital for building and equipment, electrical usage, equipment maintenance and periodic upgrades. Downtime can be measured in hours or in monetary terms.
A case study will be presented to explore the problem of optimizing data center redundancy. Capital and operating estimates will be provided by a major engineering design firm. Downtime for each design was estimated by a nationally recognized source.
An overall decision process is presented which combines cost and benefit estimates with economic and non-economic analyses to arrive at an optimal solution. Three decision process scenarios are identified that are caused by how downtime is measured and whether downtime is considered a dependent or independent attribute in the final decision. One scenario is presented in the paper that uses After Tax Analysis (ATA) to estimate the Life Cycle costs (EUAC) without downtime included and downtime (hours per year) as an independent variable. This scenario uses Cost Effective Analysis (CEA) as the decision analysis approach.
The ATA decision process described could be used in an engineering economy course. The scenario could provide a practical example for when and how to use various Figures of Merit (FoMs) and associated decision processes.
The case presented illustrates limitations in teaching engineering economics. One limitation is that decision processes like CEA and Multi-Attribute Analysis (MAA) are generally not taught to undergraduate engineering students; they are only covered in some graduate engineering programs. Yet, as this case illustrates, these techniques are important to select among various engineering designs and to make capital selection decisions.
Future research efforts are identified that will more fully explore the case presented.
Keywords: Capital Projects, Cost / Benefit Estimation, Data Center Redundancy, Life Cycle Analysis, Cost-Effective Analysis, Multi-Attribute Analysis, Engineering Economics.
Introduction
An organization’s computer network is critical to the operation of the enterprise. While the attack on the World Trade Center may be a dramatic example of how the loss of a computer
P
network drastically impacted the companies concerned, there are computer network disruptions and degradations occurring every day. Unexpected outages are not only disruptive, they are expensive. Our ability to conduct normal business operations has become so dependent on computer processing that each hour of"downtime" can have a significant negative effect on the bottom line of the organization. The loss amount varies by industry as well as the role each computer system plays in everyday business transactions. Idle labor cost alone brings this risk into perspective.
Minimizing network downtime is a major concern for almost all organizations that are dependent upon their computer systems to function efficiently. This is true for profit as well as non profit organizations like the government and the military. Solutions involve installing more reliable software and hardware as well as a systems approach to network integration.
This paper will concentrate on one aspect of this problem, i.e. the problem of how to economically build redundancy into the computer data centers to reduce downtime. It is a
problem which involves analyzing the capital required to build a data center and an estimation of the amount (hrs.) and cost ($/hr.) of downtime related to the design. The decision process and Figures of Merit (FoMs) used will depend upon how downtime is estimated and whether downtime is an independent or dependent variable in the decision process.
Data Center Redundancy – Capital and Operating Cost Estimates
SKANSKA, one of the world’s largest design and construction companies, developed a number of data center designs with varying degrees of reduancy8. SKANSKA’s designs included the capital cost for a data center building and related equipment8. Equipment included Control Room Chiller Units (CRAC), Uninterrupted Power Supply Units (PDU), Power Distribution Units (PDU), Back-up Generators, Fire Protection Units and other miscellaneous electrical equipment. Maintenance and electrical costs were estimated using rules of thumb based on the capital involved. Estimates of fixed costs were based on typical costs for insurance and other items.
Data Center Redundancy – Downtime/Reliability Estimates
SKANSKA developed a series of data center designs that resulted in various levels of downtime per year. Thus, a Tier I design was estimated to have 28.8 hours/year of downtime versus Tier II with 22 hours/year, Tier III with 1.6 hours/year and Tier 4 with .8 hours/year. Downtime
estimates were based on the Uptime Institute Field Data8.
Decision Process for an Optimal Solution
A decision model is required to determine the optimal economics. The most prevalent industry approach is to use an After Tax Analysis (ATA)1. Appendix I – Figure 2 is a description of a typical ATA decision process. Appendix II is a more detailed description of the 8 major steps in the Figure 1 decision process1.
P
Why After Tax Analysis? ATA is necessary because the government is a “partner” in every capital decision. Depreciation rates, tax rates, investment tax credits and capital gains taxes greatly influence the attractiveness of capital expenditures.
How Downtime Cost and/or Reliability Estimates Impact the Decision Process
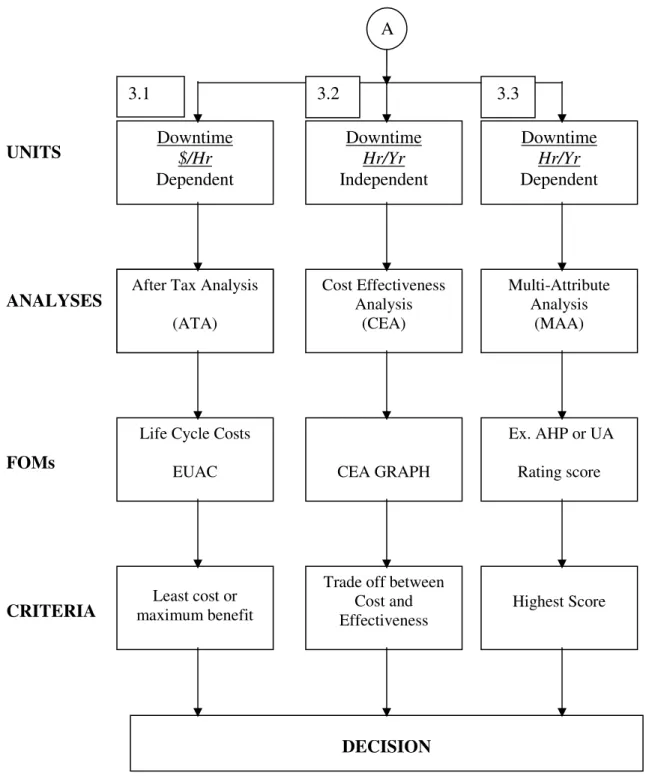
There are, however, limitations to using ATA. One limitation is ATA’s assumption that all inputs can be expressed in monetary terms. This also applies to the downtime estimate. What if downtime is an independent variable and/or cannot be monetized? How downtime is estimated directly impacts the decision process, the FoM used and the criteria used to make a decision. There are at least three possible scenarios related to how downtime is estimated. Appendix III - Figure 3 indicates how these different downtime estimates impact the decision making approach. The Cost-Benefit Estimation (Step 2 and 3 of the Decision Process) was expanded to include the units estimated, whether this attribute is dependent or independent, which decision analysis should be used, which Figures of Merit (FoMs) could be used and the decision criteria.
The first scenario is to consider downtime as a dependent variable which can be monetized (see Appendix III - Figure 3 - 3.1). There are a number of studies which provide estimates that vary by industry group and cause. Studies include the Meta Group5 , the Yankee Group8, and
Infonetics Research2, 3. If the downtime can be monetized then After Tax Analysis (ATA) can be used to determine the least cost EUAC (e.g. Life Cycle Cost) or the maximum benefit (NPV). If a least cost approach is used, then the cost of downtime is used directly in the ATA. If a
maximum benefit approach is employed, then the savings for a particular alternative compared to the base case yields savings that are used in the ATA and the highest Net Present Value (NPV) would be chosen. This case, however, is not presented in this paper. Further work is needed to provide the cost of downtime in $/hr.
The second scenario is to consider downtime as an independent variable (see Appendix III- Figure 3 - 3.2). This scenario occurs when network downtime (hours/year) is specified by contract, by security considerations or by some protocol or standard relevant to the
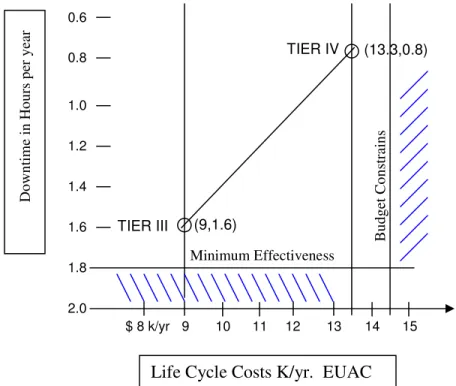
business/industry involved. Downtime is measured as an independent variable in hours per year. For this case Cost Effectiveness Analysis (CEA) can be used. CEA will provide a tradeoff between cost (EUAC – life cycle) and the effectiveness as measured by hours of downtime. Table 1 provides the EUAC for the Tier III and IV cases without downtime costs. Figure 1 illustrates the CEA for this case. This case is discussed in the next section.
Lastly, the scenario where downtime is an independent variable along with other variables which impact the decision on engineering design and capital is illustrated (see Appendix III- Figure 3- 3.3). In this scenario downtime in hours per year is just one of many dependent attributes that will be used in the decision. In this case some type of Multi-Attribute Analysis (MAA) would be employed. Other attributes may include cost, reliability and/or downtime, security, ability to upgrade which are relevant to the decision makers. Multi-Attribute Analysis (MAA) techniques include Analytical Hierarchy Process (AHP), Utility Analysis (UA), democratic voting and others 4. However, this case is not presented in this paper. Further work is needed to determine the other attributes and their weights.
P
Cost Effectiveness Analysis (CEA) – Case 3.2
Table 1 is based on two cases in the SKANSKA analysis 1. The cases deal with the construction of Tier III and Tier IV data centers. They represent cases where adding equipment to create redundancy and reduce downtime increases capital costs. The EUAC in this example excludes any downtime costs. The downtime estimates (hours/year) are treated as an independent attribute. Note that Tier III had the lowest capital cost, NPV and EUAC. But Tier IV had the lower (more efficient) down time. The question then is: which alternative should be chosen?
Units Tier III Tier IV Difference IV-III
Capital Cost 000 $ ($41,512) ($58,569) ($17,057)
Net Present Value 000 $ ($51,284) ($75,428) ($24,144)
Life Cycle Costs - EUAC 000 $ per year ($9,076) ($13,350) ($4,274)
Effectiveness Hours of Downtime 1.60 0.80 (0.80)
Ratio of EUAC/Effectiveness 000$ /yr / hour downtime ($5,673) ($16,688) $5,343
Ratio Capital Cost / Effectiveness 000$ Cap / downtime hour ($25,945) ($73,211) $21,321
Notes: MARR = 12%; Income Tax Rate = 35%; Project Life = 10 years
Table 1. Life Cycle Cost vs. Effectiveness
Figure 1 is the CEA analysis for Tier III and IV. The question is which alternative should be chosen? The answer depends upon the decision criteria initially selected. If life cycle cost is paramount then Tier III should be chosen. If effectiveness (lower downtime) is paramount then Tier IV should be selected.
Figure 1. Cost Effective Analysis
$ 8 k/yr 9 10 11 12 13 14 15 TIER III Minimum Effectiveness 2.0 1.8 1.6 1.4 1.2 1.0 0.8 0.6 TIER IV (9,1.6) (13.3,0.8) B u d g et C o n st ra in s
Life Cycle Costs K/yr. EUAC
D o w n ti m e in H o u rs p er y ea r P age 13.954.5
Another approach would be to conduct an incremental analysis, which would require
predetermined criteria of what is acceptable. In this case the question is: would a client pay an additional $17 million in capital and $4.3 m/yr in annual costs (EUAC) to achieve a .8 hour reduction in downtime? Again, predetermined criteria would help make this decision. Knowing the cost per hour of downtime answers this last question. However, if the cost per downtime hour is known, then Case 3.1 (See Appendix III, Figure 3 - 3.1) and the ATA approach would be used.
Some other observations about this case: Minimum effectiveness and maximum budget constraints were not considered. Obviously, if these are known, they would influence the decision.
Also, the gap in Capital Cost and Life Cycle Cost is large compared to the reduction in downtime hours. That may mean that other cases like III A, etc. should be examined. It appears that there may be an ‘S” curve in Cost Effectiveness between Tier III and IV.
Implications for Engineering Economics (EE) Education
This case illustrates how the analysis method, Figures of Merit and decision criteria are influenced by downtime estimate units and whether this estimate should be included as part of the analysis or be an independent attribute. These are real differences which reflect actual industry practice.
However, this insight reveals two problems in engineering economics education. The first is that ATA is not part of the Fundamentals of Engineering (FE) exam (see reference7 page 551) and the second is that CEA and MAA are generally not taught in undergraduate engineering economics courses.
A trend in engineering economics education is to teach undergraduates Fundamentals. A review of typical fundamental engineering economic texts7 and widely used engineering texts6 indicates that topics like Cost Effectiveness Analysis (CEA) and Multi-Attribute Analysis (MAA) are not included. Also not included are realistic examples or cases which illustrate how to choose among the various decision analyses.
Another problem in EE education is that topics like CEA and MAA are not generally taught in engineering specific masters programs. The exception are industrial engineering, engineering management and systems masters programs. Yet in some of these programs the engineering economics courses do no teach CEA and MAA. The question then is: when do engineers learn when to use and how to choose among decision analysis techniques like ATA, CEA and MAA?
Conclusions
Reducing computer network downtime is an important problem in the current environment where computer networks are vital to our society and businesses. While there are many dimensions to this problem, Data Center redundancy is an essential part of the solution.
P
Choosing the most economical engineering design is complex and is further complicated by the choice of an appropriate decision process.
The decision process will depend upon the benefits estimation, especially the downtime units, and whether this is dependent or independent of the analysis. This is an important insight which is not generally found in engineering economics texts.
Three scenarios with different FoMs, decision criteria and economic analyses were identified and discussed. One of the scenarios (CEA) was presented to illustrate the differences caused by the downtime estimates. The other scenarios require additional research and will be presented later. The case presented in this paper involved tradeoffs between engineering design and economics. How does an engineer make these tradeoffs without knowledge of more advanced decision processes and figures of merit? This paper provided a specific industry problem and showed how these engineering decisions are made.
Future Research
Research is needed to quantify the $/hour cost of downtime. The references cited are excellent sources. However, the $/hour downtime costs vary widely by industry and cause.
This body of knowledge needs to be reduced into three or four cases and then analyzed. If this is accomplished then a more comprehensive ATA analysis is possible along with sensitivity analysis to determine the most relevant variables. This would be a case where all attributes are monetized (see Appendix III, Figure 3- 3.1).
Additional research is required to identify which criteria decision makers use in data center construction. This could be used to conduct a Multi-Attribute Analysis and would be a case where downtime is one of a number of attributes used to make a decision (see Appendix III, Figure 3 – 3.3).
P
Appendix I. Decision Process:
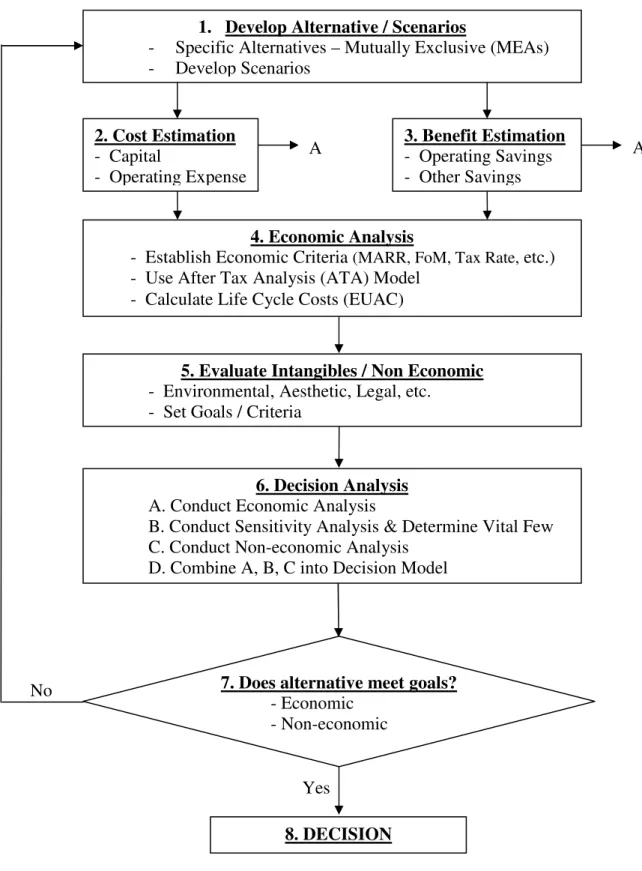
Figure 2. General Decision Model 1. Develop Alternative / Scenarios
- Specific Alternatives – Mutually Exclusive (MEAs) - Develop Scenarios 2. Cost Estimation - Capital - Operating Expense 3. Benefit Estimation - Operating Savings - Other Savings 4. Economic Analysis
- Establish Economic Criteria (MARR, FoM, Tax Rate, etc.) - Use After Tax Analysis (ATA) Model
- Calculate Life Cycle Costs (EUAC)
5. Evaluate Intangibles / Non Economic
- Environmental, Aesthetic, Legal, etc. - Set Goals / Criteria
6. Decision Analysis
A. Conduct Economic Analysis
B. Conduct Sensitivity Analysis & Determine Vital Few C. Conduct Non-economic Analysis
D. Combine A, B, C into Decision Model
7. Does alternative meet goals?
- Economic - Non-economic 8. DECISION Yes No A A P age 13.954.8
Appendix II - Description of Typical Decision Process
Figure 2 illustrates a typical decision process used to choose among competing alternatives.
Step 1 is to develop feasible alternatives that are mutually exclusive. In this case alternatives are various combinations of data center hardware and software that result in various levels of redundancy and downtime. In addition to alternatives, scenarios can be constructed which could combine alternatives along with other factors such as potential breakdowns or disaster scenarios.
Step 2 is to estimate the capital and operating costs. Table 1 explains the estimates for the case under consideration.
Step 3 is the most critical step because of the need to estimate the benefits. Benefits can be:
a. The savings in operating cost compared to a base case. This could caused by a more efficient design than the base case.
b. Based on downtime savings. This is dependent upon the industry and upon how downtime is valued. Step 4 is the economic analysis. The first part is to establish economic criteria like the Minimum
Attractive Rate of Return or MARR. The MARR reflects the opportunity cost for the investor’s capital. Risk plays a role because some investments may be more risky than others.
The time horizon needs to be determined along with whether the after tax analysis (ATA) will use the full equity or be leveraged with some sort of financing. Generally, most companies conduct the economic analysis using full equity and then, after choosing the most economical alternative, look at financing options. Because this is an after tax analysis an applicable tax rate needs to be estimated for the chosen time horizon.
The last criteria are the Figure of Merit (FoM). Given that the ATA model is run on an excel spreadsheet it is relatively easy to report on more than one FoM. FoMs include the Net Present Value (NPV) and the Equivalent Uniform Annual Cost or EUAC. EUAC is the FoM for Life Cycle costs.
Step 5 involves evaluation of the intangibles and non-economic factors impacting this decision. There are a number of multi-attribute tools which can be used. Analytical Hierarchy Process (AHP) and Utility Analysis are two common techniques.
Step 6 involves the decision process. Sensitivity analysis should be employed to determine the most sensitive attributes impacting the decision. This helps in separating the “vital few” from the “trivial many”. This is an aid in decision making because it focuses the effort on the most important variables. Next, a decision needs to be made whether an economic or non-economic analysis is to be employed. If all the attributes can be monetized and converted into dollars then the standard ATA with a FoM such as NPV or EUAC can be used to either maximize benefits or minimize costs. However, if the downtime cannot be monetized then some form of non-economic analysis must be employed. There are at least three different process flows depending upon the downtime values and costs. This will be discussed in the next section.
Step 7 involves the decision whether the analysis yields an alternative which meets the economic and/or not-economic criteria. If it does than a decision is made. If it does not, the process needs to be repeated starting with step number 1. This process needs to continue until a mutually exclusive feasible solution is
Appendix III – Impact of Benefit Estimation on Decision Process
Figure 3. Impact of Benefit Estimate on Decision Process
A
After Tax Analysis ATA After Tax Analysis
(ATA)
Life Cycle Costs EUAC Least cost or maximum benefit Cost Effectiveness Analysis (CEA) CEA GRAPH
Trade off between Cost and Effectiveness Multi-Attribute Analysis (MAA) Ex. AHP or UA Rating score Highest Score Downtime $/Hr Dependent Downtime Hr/Yr Independent Downtime Hr/Yr Dependent UNITS ANALYSES FOMs CRITERIA DECISION 3.1 3.2 3.3 P age 13.954.10
Bibliography:
1. Carnemark, J. (2007) “The Real Cost of Redundancy”, SKANSKA, September 2007.
2. Infonetics Research, (2005). “The Cost of Enterprise Downtime: North American Vertical Markets 2005”.
3. Infonetics Research, (2006). “The Cost of Downtime: North American Medium Business, Cost Analyzer 2006”.
4. Lang, Hans. J. and Donald, N. Merino, (1993). “The Selection Process for Capital Projects, John Wiley and
Sons, Incorporated, Hoboken, NJ
5. META Group, Inc., (2000). “Quantifying Performance Loss: IT Performance Engineering and Measurement
Strategies”, Clients of META Group, Inc. can read the full Delta Summary from: http://www.metagroup.com/cgi-bin/inetcgi/jsp/displayArticle.do?oid=18750
6. Newman, Donald G., Lavelle, Jerome P., Eschenbach, Ted G. (2008), “Engineering Economic Analysis – 10th
Edition” Oxford University Press, Inc., New York, NY
7. Park, Chan S. (2008), “Fundamentals of Engineering Economics – 2 nd. Edition” Pearson Prentice Hall,
Uppper Saddle River, NJ
8. Yankee Group, (2004). “The Road to a Five-Nines Network”
P