Student Outcomes in
California’s Community
Colleges
May 2014
Hans Johnson • Marisol Cuellar Mejia
with research support from Kevin Cook
Supported with funding from the Donald Bren Foundation
S U M M A R Y
C
alifornia’s community colleges off er more online credit courses than any other public higher education institution in the country. By 2012, online course enrollment in the state’s community colleges totaled almost one million, representing about 11 percent of total enrollment. Indeed, practically all of the enrollment increases over the past ten years have occurred in online courses. Among students taking credit courses in 2011–12, one of every fi ve took at least one online course.These trends raise critical questions about the eff ect of online learning on student out-comes. In this study, we consider both short- and long-term outcomes, focusing on partici-pation, course completion and passing, degree attainment, and transfer to four-year institu-tions. As the enrollment trends suggest, we fi nd that online learning has provided new access to higher education, with online participation increasing for each of the state’s largest ethnic groups. Still, participation is uneven across groups, with African Americans participating at relatively high rates and Latinos lagging all groups.
When we examine student outcomes, we fi nd a surprising result: short-term outcomes are poor, but long-term outcomes are not. How does this break down?
In the short term, course by course, student outcomes are worse in online courses than in traditional courses. Students are less likely to complete an online course than a traditional course, and they are less likely to complete an online course with a passing grade. We fi nd lower course success rates across all types of students, across a wide set of subjects, and
across almost all colleges. Indeed, once we control for a full set of student characteristics (including overall grade point averages [GPAs]) and institutional factors, we find that online course success rates are between 11 and 14 percentage points lower than traditional course success rates. In addition, we find that online learning does nothing to overcome achieve-ment gaps across racial/ethnic groups—in fact, these gaps are even larger in online classes.
However, when we examine long-term outcomes, the picture looks brighter. Students who take at least some online courses are more likely than those who take only traditional courses to earn an associate’s degree or to transfer to a four-year institution. For some stu-dents, online courses offer a useful tool that helps them to reach their goals.
Online learning is still relatively new—and there is reason to believe that the online per-formance gaps that we identify in this report can be minimized with strategic planning and improved technology. Providing more online versions of high-demand courses should be one priority. Community colleges should also review the quality of current online courses and consider implementing a standardized learning management system to assess student behavior and engagement and to identify areas where improvement is needed. Finally, gath-ering information on the cost of developing and maintaining online courses is vital to under-standing the potential efficiencies of online learning.
Governor Jerry Brown has proposed spending tens of millions of dollars to promote innovations in learning across California’s higher education systems. With more funding and new initiatives on the horizon, the community colleges have the opportunity to make even greater strides in their online learning programs.
For the full report and related resources, please visit our publication page: www.ppic.org/main/publication.asp?i=1096
Students are less likely to complete an online course than a traditional course,
and they are less likely to complete an online course with a passing grade.
Introduction
As costs of attending college have risen and access to higher education has declined, policymakers and com-munity college officials are looking to online learning as one way to better serve student needs, increase access, promote completion, and increase transfer to four-year universities—all in a cost-effective manner. In California, Governor Jerry Brown stressed the importance of online learning in the 2013–14 budget for the state’s public col-leges and universities, providing tens of millions of dol-lars to promote online learning in the state’s three public higher education sectors—the University of California (UC), the California State University (CSU), and the Cali-fornia Community Colleges (CCC). In the specific case of California Community Colleges, Governor Jerry Brown has outlined a plan to fund his Online Education Initia-tive (OEI) for $56.9 million over 55 months beginning in December 2013. For the current fiscal year, the OEI has received $16.9 million. If successful, the OEI is expected to have continuous funding at a rate of $10 million per year over the next four years.
Online learning is still a relatively new phenomenon. Although it has generated a great deal of interest in policy and higher education circles, only a few studies have rigor-ously examined the effect of online courses on student outcomes using a large and representative set of online courses.1 Specifically, the Community College Research
Center at Teacher’s College, Columbia University, has conducted rigorous large-scale examinations of online learning in the community colleges of Washington state and Virginia (Xu and Jaggars 2011, 2013a, 2013b).2 Other
studies have compared student performance between online and traditional courses; however, most of these studies focus on one or two specific courses or are descrip-tive in nature. Because the California Community Colleges Chancellor’s Office (CCCCO) provided us with access to unique longitudinal student- and course-level data from all of the state’s 112 community colleges, we are able to rigor-ously examine the effect of online courses for hundreds of thousands of students.
For online courses to be a cost-effective alternative to traditional, face-to-face courses, they not only need to be less expensive but must also yield comparable student outcomes. In this report, because cost data are not readily available, we focus on student outcomes.3 We answer three
central questions:
• What are the enrollment trends in online learning? • How do online courses compare to traditional courses in
terms of successful completion?
• What is the relationship between online learning and
long-term student outcomes, particularly earning a
certifi-cate or a degree or transferring to a four-year university?
We concentrate on the California Community College system for several reasons. First, it is the largest postsecondary education system in the nation, and it has a long history of using technology to provide courses to a diverse set of students. Second, the increase in online learning at Califor-nia’s community colleges has been remarkable. In 2011–12, one-fifth of California’s community college students were enrolled in at least one online course for credit—this is almost seven times higher than the share enrolled in 2002–03. Third, community colleges are more likely than other institutions of higher education to serve nontraditional students. These students often have employment and family obligations and therefore may potentially benefit the most from online learning.
This report is organized as follows. First, we provide infor-mation on the scale of online learning in California’s commu-nity colleges, describing enrollment levels and trends. Next, we examine student success rates, short and long term. Finally, we offer some policy recommendations and conclusions.
For online courses to be a cost-effective
alternative to traditional, face-to-face courses,
they not only need to be less expensive but
must also yield comparable student outcomes.
How Common Is Online Learning
in the Community Colleges?
California’s community colleges have a long history of using technology to provide courses to a diverse set of stu-dents. Even before computers were widely available, com-munity colleges provided distance education through a variety of means, beginning with correspondence courses. With advances in communications, community colleges subsequently offered courses via instructional television, audiocassettes, and videocassettes. Over the past decade, courses based on these earlier technologies have been almost wholly replaced by online courses.
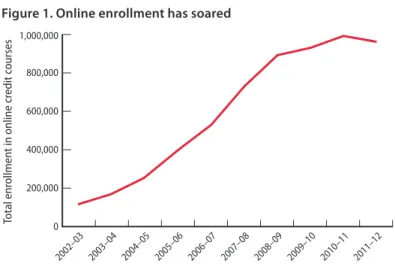
Online learning at California’s community colleges, in terms of both courses offered and students enrolled, has grown remarkably—a testament to those institutions’ flexibility and willingness to adopt new technologies to better serve their students. Online course enrollment reached close to one million in 2010–11, up from only 114,000 in 2002–03 (Figure 1).4 In fact, almost 530,000
community college students (19.5% of all students taking credit courses) took at least one credit course online in 2011–12. Over the past ten years, online course enrollment has increased by almost 850,000, while traditional course enrollment has declined by almost 285,000. Consequently, online course enrollment as a share of all enrollments at the community colleges increased from 1.4 percent to 10.7 percent over the same period (Figure 2). More evidence of the increasing role of online learning at California’s community colleges is the fact that over half of community colleges offer at least one degree or certificate that can be earned solely through distance education, mostly through online instruction (CCCCO 2013).5
Undoubtedly, the scarcity of traditional courses has been a factor in the huge increase that we have seen in online enrollments. With the state cutting support to community colleges by more than $1.5 billion between 2007–08 and 2011–12, community colleges experienced an unprecedented falloff in enrollment (Bohn, Reyes, and Johnson 2013). Between 2008–09 and 2011–12, total credit enrollment at California’s community colleges declined by almost a million. Reflecting these budget constraints, growth in online enrollment decelerated in 2009–10 and even turned negative in 2011–12. With additional fund-ing allocated to the community colleges in the current
Online course enrollment reached
close to one million in 2010–11,
up from only 114,000 in 2002–03.
What is online learning?Online courses are those in which at least 80 percent of
the instruction is Internet-based. These courses are accessed online through the Internet, and are classified either as “delayed interaction” courses, in which the student accesses the course at times that are convenient for the student, or as “simultaneous interaction” courses, in which the student must be online at the same time as the instructor. The vast major-ity of online courses (91% in 2011–12) are offered as delayed interaction. About 11 percent of credit course enrollment in 2011–12 was in online courses.
Blended courses are those in which a substantial share of
instruction—30 to 80 percent—is offered online, with the remainder of instruction occurring in a traditional classroom setting (sometimes referred to as “face to face”). The manner in which courses are blended varies, with some courses using online instruction for lectures and traditional settings for labs and others offering a mix of online and traditional settings for lectures and sections. Only 1 percent of credit enrollment in 2011–12 was in blended courses. Because blended courses are so uncommon, we do not examine them in any detail in this report.
Traditional courses are those in which the vast majority of
instruction (70% or more) takes place in a traditional class-room with the instructor and students physically present at the same time. Technology is often used in such classrooms, including Internet and online components, but primarily within the classroom itself. In 2011–12, 87 percent of total credit enrollment was in traditional courses.
and projected fiscal years, we expect enrollment in online learning to resume its upward trajectory.
Participation across Colleges and Subjects
The use and popularity of online courses varies tremen-dously across the community college system and across academic subject areas. Across the system, some commu-nity colleges have much more online course activity than others. At one end of the spectrum, more than one-third of credit enrollment is in online courses—currently this
occurs at just three colleges: Coastline (60.4%), Barstow (49.8%), and Cerro Coso (34.7%).6 At the other end of the
spectrum, several colleges report practically no online credit enrollment (see technical appendix Table B3).
Online learning is more popular in some subjects than in others (Figure 3). Almost one-third of enrollment in business courses and more than one-third of enrollment in information technology courses are online. By contrast, online courses are uncommon in engineering, the physical sciences, and the biological sciences—perhaps because of laboratory requirements. Very few basic skills courses— precollege–level courses in such areas as math, composition, and English as a Second Language—are offered online (they constituted just 2.2% of total online enrollment in 2011–12).7 Participation across Student Groups
An important consideration in evaluating online learning is whether enrollment in online courses reflects the diverse
population of students served by community colleges. How Figure 1. Online enrollment has soared
SOURCE: Authors’ analyses based on CCCCO Management Information System (MIS) data. NOTES: Annual course enrollments are the sum of fall, winter, spring, and summer semesters or quarters for each academic year. See technical appendix Table B1 for more details.
2002–03 2003–04 2004–05 2005–06 2006–07 2007–08 2008–09 2009–10 2010–11 2011–12 0 200,000 400,000 600,000 800,000 1,000,000 Total enr ollmen t in online cr edit c ourses Shar e of enr ollmen t in online cr edit c ourses (%) 2002–03 2003–04 2004–05 2005–06 2006–07 2007–08 2008–09 2009–10 2010–11 2011–12 Figure 2. One of every nine student course enrollments is in an online course
SOURCE: Authors’ analyses based on CCCCO MIS data.
NOTES: Annual course enrollments are the sum of fall, winter, spring, and summer semesters or quarters for each academic year. See technical appendix Table B1 for more details.
0 2 4 6 8 10 12 10.7
Figure 3. Online offerings vary widely across subjects
SOURCE: Authors’ analyses based on CCCCO MIS data.
NOTE: Restricted to course subjects with at least 100,000 enrolled students. See technical appendix Table B2 for details.
Share of enrollment in online credit courses (%), 2011–12
0 5 10 15 20 25 30 35 40
Engineering and industrial technologies Physical sciences Biological sciences Mathematics Interdisciplinary studies Foreign language Education Health Humanities (letters) Public and protective services Fine and applied arts Family and consumer sciences Psychology Social sciences Media and communications Business and management Information technology 2.3 4.4 4.6 6.0 6.3 6.5 6.5 7.0 7.7 7.8 8.2 14.2 15.1 15.1 15.9 30.2 33.8
does online learning affect ethnic and other demographic
gaps in access to higher education?
The good news is that online participation is increasing for each of the state’s largest ethnic groups. The bad news is that participation levels are notably lower among Latino students (Figure 4a). This disparity is in part a reflection of the digital divide, with Latinos substantially less likely than whites, Asians, or African Americans to have broad-band access at home (Baldassare et al. 2013). Because Latinos are underrepresented in higher education, lower enrollment in online courses exacerbates the access gap. Conversely, African Americans are also underrepresented in higher education in California, but online enrollment rates for African Americans are quite high.
Gender differences in online learning participation are almost as wide as ethnic differences (Figure 4b). Men, who are underrepresented in higher education in California, are less likely than women to take online courses (8.5% of male students versus 12.6% of female students in 2011–12). In fact, women compose the vast majority (62%) of online credit enrollment.
Differences among age groups are of particular inter-est for community colleges, which serve a large number of
older students. Here, we find the widest participation gap
of all, with students ages 25 and older much more likely than younger students to take online courses (Figure 4c). This gap is almost certainly a reflection of the job and fam-ily demands that make the convenience of online courses especially compelling for older students. A 2011 survey of community college students found that the majority cited either job schedules (38%) or family commitments (20%) as the primary reason they enrolled in a distance education course (CCCCO 2011).8
As these findings indicate, it appears that online courses have increased access to community colleges— at least for some types of students. The fact that the share of African American and older students is higher in online than in traditional courses suggests that online learning has improved access for these students. In 2011–12, the share of students ages 25 and older in online courses was 47.0 percent, compared to 30.6 percent in traditional courses.
SOURCE: Authors’ analyses based on CCCCO MIS data.
Shar e of enr ollmen t in online cr edit c ourses (%) Shar e of enr ollmen t in online cr edit c ourses (%) Shar e of enr ollmen t in online cr edit c ourses (%) 0 2 4 6 8 10 12 14 16 2002–03 2003–04 2004–05 2005–06 2006–07 2007–08 2008–09 2009–10 2010–11 2011–12 Figure 4a. Latinos are less likely than other students to take online courses 13.1 12.8 10.5 8.1 White African American Asian Latino
SOURCE: Authors’ analyses based on CCCCO MIS data.
0 2 4 6 8 10 12 14 16 2002–03 2003–04 2004–05 2005–06 2006–07 2007–08 2008–09 2009–10 2010–11 2011–12 Figure 4b. Male students are less likely than female students to take online courses
Female
Male 12.6
8.5
SOURCE: Authors’ analyses based on CCCCO MIS data.
0 2 4 6 8 10 12 14 16 2002–03 2003–04 2004–05 2005–06 2006–07 2007–08 2008–09 2009–10 2010–11 2011–12 Figure 4c. College-age students are less likely than older students to take online courses
Older students College-age students
15.4
Similarly, the share of African American students in online courses was 9.4 percent, compared to 7.6 percent in tradi-tional courses.
Student Success in Online Courses
Increased access to online courses is an important step, but it is not very meaningful if that access does not trans-late into completing and passing those courses. In this sec-tion, we compare student success in online and traditional courses, defining the success rate as the share of students who complete a course with a passing grade.
We find that course success rates are lower in online courses than in traditional courses (Figure 5). In 2011–12, 79.4 percent of all students enrolled in online courses completed these courses, compared to 85.9 percent among those enrolled in traditional courses. Moreover, 60.4 per-cent of all students enrolled in online courses completed with a passing grade—10 percentage points lower than the average success rate in traditional courses (70.6%). As Figure 5 illustrates, the gap between success rates in online and traditional courses has remained relatively constant over the past ten years.
This simple comparison provides a measure of student success rates in online and traditional courses, but it is not an adequate assessment of the efficacy of online courses. Many other factors must be considered to properly evaluate the difference in student success in online and traditional courses. For example, it is possible that student success Data and methods
The data used in this report come from the California Com-munity Colleges Chancellor’s Office Management Information System. This dataset includes student demographics, course enrollment, transcript data, and information on each course (including subject, credit, transfer, and basic skills status). We use various subsets of the full data in our analyses. The descriptive information was calculated on the entire set of courses and students.
Our statistical models focus on the cohort of students who initially enrolled in one of California’s community colleges dur-ing the fall term of 2006. These students were tracked for over six years, through the fall term of 2012. Our sample excludes special-admit students (those enrolled while still in K–12) and students with invalid Social Security Numbers or unknown birth dates. We make these exclusions because these two data fields allow us to identify students attending multiple cam-puses. We further restrict our sample to students between the ages of 15 and 64 at the time of first enrollment and students who remained in the California Community College system for more than one term. Finally, we focus on enrollment in credit courses, as the vast majority of courses fall in this category.
Most of our methodological approach follows the work done by Xu and Jaggars (2013a, 2013b) at the Columbia University Community College Research Center. Two online technical appendices to this report provide full details of our work. Technical Appendix A contains our empirical strategy, and Technical Appendix B contains descriptive statistics and the results of our statistical models.
Figure 5. Success rates are lower in online courses
SOURCE: Authors’ analyses based on CCCCO MIS data. NOTE: See technical appendix Table B1 for details.
Per cen tage 55 57 59 61 63 65 67 69 71 73 75 60.4 70.6 2002–03 2003–04 2004–05 2005–06 2006–07 2007–08 2008–09 2009–10 2010–11 2011–12 Traditional sections Online sections
Increased access to online courses is an
important step, but it is not very meaningful
if that access does not translate into
completing and passing those courses.
for the factors described above. For this analysis, we limit our examination to courses offered through both online and traditional sections. The final sample includes over 750,000 section enrollments, of which 21 percent were in online sections.
Our results suggest that simple comparisons underesti-mate the difference between student success rates in online and traditional courses. As Figure 6 shows, controlling for student characteristics—demographic attributes and aca-demic preparedness—has only a very modest effect on the estimated gap, increasing the size of the gap from 7.4 per-centage points to 7.6 perper-centage points (meaning that with these controls, course success rates are 7.6 percentage points lower in online than in traditional courses).9 However, once
we simultaneously account for student characteristics and the fact that online courses may be more prevalent within particular terms, colleges, and subject areas, the estimated performance gap increases to 10.9 percentage points. Finally, once we control for both student characteristics that can be observed and those that are more difficult to measure, the negative gap becomes further magnified, to 14 percentage points. In summary, our results suggest that, on average, students in online courses are at least 11 percentage points rates are lower in online courses because those courses
attract students who are less academically able to complete a course successfully regardless of delivery type. Moreover, a simple comparison does not account for the fact that online courses are more prevalent at particular colleges, in particular subject areas, and during particular terms. Even within a particular college, term, or subject area, certain courses are more likely to be offered online. For example, advanced courses may be more likely than entry-level courses to be offered online. There is also the possibility that additional student characteristics that are difficult to measure (such as academic motivation and ability, time management, or self-directed learning skills) or for which we do not have information available (such as employment status and actual working hours) may jointly influence online course enrollment and student course success. All of these factors make isolating the effect of online delivery format on student outcomes a challenging task.
To paint a more complete picture of online learning and student success, we rely on various statistical regres-sion techniques (explained in detail in Technical Appendix A). Although we cannot account for the many varieties of online learning, in terms of presentation style, content, pedagogical practices, or quality, we control as best we can
Figure 6. Many factors influence the performance gap between online and traditional courses
SOURCE: Authors’ analyses based on CCCCO MIS data.
NOTES: Each bar is based on a different probit regression and shows the average marginal effect of taking a course online instead of taking a traditional course. Also, each bar represents the results of controlling for the label factor plus the factors above it. We cluster standard errors at the course level to account for potential within-course error correlation. Data are based on 2006 student cohort data. See Technical Appendix A and technical appendix Tables B7 to B10 for details.
Online performance gap (percentage points)
–16 –14 –12 –10 –8 –6 –4 –2 0 None –14.0 –11.4 –10.9 –7.6 –7.4
Student demographic characteristics and academic preparedness attributes (e.g., gender, race/ ethnicity, first-term GPA) Prevalence of online courses within terms, colleges, and subject areas The fact that certain courses may more likely be offered online Student characteristics that cannot be observed (e.g., academic motivation and ability)
Factors accounted for:
Student success rates in online courses are between 11 and 14 percentage points lower than in traditional courses.
and as much as 14 percentage points less likely to success-fully complete an online course than otherwise similar students in traditional format classes.
The fact that the performance gap between online and traditional courses becomes larger once we control for student characteristics that cannot be observed supports the notion that online courses are more prevalent among more “motivated” and academically prepared students.10
As a result, the failure to take into account self-selection into online courses is likely to underestimate the online performance gap.
The Online Performance Gap across Student Populations
Some types of students perform worse than others in online courses. To examine these differences, we compare a student’s performance in online courses to his or her own performance in traditional courses.11 We call the difference
in success rates in online and traditional courses the online performance gap.
We find that the size of this performance gap varies across type of students. According to our estimates, younger students, African Americans, Latinos, males, students with lower levels of academic skill, and part-time students are all likely to perform markedly worse in online courses than in traditional ones (Figure 7).
The bigger the gap, the worse a student’s performance is in online courses compared to traditional ones. The gap is largest for Latino and African American students (15.9 and 17.9 percentage points, respectively). By contrast, the online performance gap is only 13.6 and 10.6 percent-age points for whites and Asians, respectively.12 The online
performance gap for male students is slightly higher than the one for female students (14.7 and 13.6 percentage points, respectively). Likewise, younger students experi-ence an online performance gap that is 4.3 percentage points higher than that for students ages 25 and older (14.5 and 10.2 percentage points, respectively).
We also find telling online performance gaps when
we look at students’ academic attributes. Here, the largest
differences are between full-time and part-time students.
Again, both types of students perform better in traditional courses, but the online performance gap is 6.9 percentage points for full-time students and more than double— 16.5 percentage points—for those enrolled part-time. Stu-dents who already have a college degree, those who have showed behavioral intent to transfer to a four-year institu-tion, and students with GPAs greater than 3.0 appear to experience smaller online performance gaps than their less academically prepared peers—not surprising given that these students tend to perform better overall.
Online Learning and the Achievement Gap
How does online learning affect the existing achievement gaps between demographic groups? Because the community Figure 7. Some students perform particularly poorly in
online courses
SOURCE: Author’s analyses based on CCCCO MIS.
NOTES: Standard errors are clustered at the student level. Each set of bars represents a separate regression. All within-category differences are statistically different from zero. According with our evidence, the online performance gap—that is, the difference in the likelihood of student success in online courses relative to traditional courses—does not vary with basic skills enrollment, prior dual enrollment, disability status, economically disadvantaged status, and other financial aid recipient status. Data are based on 2006 student cohort data. See Technical Appendix A and technical appendix Table B11 for details.
A. Student demographic characteristics
–14.7 –13.6 –17.9 –15.9 –13.6 –10.6 –10.2 –14.5 –14.0
Online performance gap (percentage points)
–20 –18 –16 –14 –12 –10 –8 –6 –4 –2 0 Male Female African American Latino White Asian Older student College-age student Average online performance gap
–14.8 –13.2 –16.6 –13.1 –14.2 –8.6 –16.5 –6.9 –14.0
Low first-term GPA High first-term GPA No behavioral intent to transfer Behavioral intent to transfer High school graduate College degree Part-time student Full-time student
B. Student academic attributes
Online performance gap (percentage points)
–20 –18 –16 –14 –12 –10 –8 –6 –4 –2 0
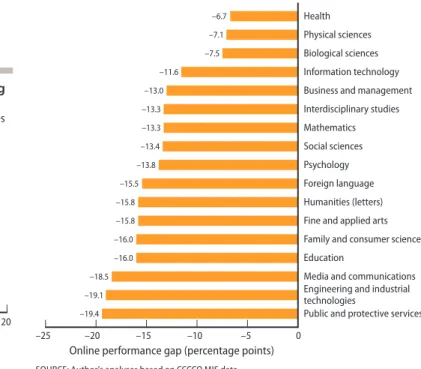
The Online Performance Gap across Subject Areas In every academic subject area, students are less likely to
succeed in online than in traditional courses. However,
in some subject areas, the gap between the two types of courses is narrower than in others, suggesting that certain subjects lend themselves to an online format more eas-ily than others do. Identifying subject areas that are more or less amenable to online instruction may help colleges determine a strategic approach to their online offerings.
According to our estimates, the subject areas in which the online performance gap is relatively small are health, physical sciences, and biological sciences (Figure 9). Our results suggest that these subject areas are relatively better suited for online learning, but currently, less than 5 percent of enrollment in physical and biological sciences is in online courses.
At the other end of the spectrum, students in engineer-ing and industrial technologies, public and protective ser-vices, and media and communications exhibited the largest difference in success rates between online and traditional colleges are such an important access point for groups
under-represented in higher education, the role of online courses in contributing to or alleviating achievement gaps is critical.
We find that online learning exacerbates existing achievement gaps (Figure 8). For example, in traditional courses, the achievement gap between white and African American students is 12.9 percentage points. In online courses, it is 17.5 percentage points. Similarly, the gap between white and Latino students is 7.3 percentage points in traditional courses and 9.8 in online courses. In con-trast, white students tend to perform slightly better than Asian students in traditional courses (an achievement gap of 1.4 percentage points), but they do slightly worse than Asian students in online courses (an achievement gap of –1.4 percentage points).
We also find that older students perform better than younger students, and this performance gap widens in the online course setting: the achievement gap between older and younger students is 10.2 percentage points in traditional courses and 14.8 percentage points in online courses.13 The same is true but to a lesser degree in the
case of the gender achievement gap—the achievement gap between female and male students is 1.9 percentage points in traditional courses and 3.1 percentage points in online courses.
Figure 9. Online performance gaps are wider in some subject areas
SOURCE: Author’s analyses based on CCCCO MIS data.
NOTES: Data are based on 2006 student cohort data. See Technical Appendix A and technical appendix Table B12 for details.
Online performance gap (percentage points)
–25 –20 –15 –10 –5 0
Public and protective services Engineering and industrial technologies
Media and communications Education
Family and consumer sciences Fine and applied arts Humanities (letters) Foreign language Psychology Social sciences Mathematics Interdisciplinary studies Business and management Information technology Biological sciences Physical sciences Health –19.4 –19.1 –18.5 –16.0 –16.0 –15.8 –15.8 –15.5 –13.8 –13.4 –13.3 –13.3 –13.0 –11.6 –7.5 –7.1 –6.7
Figure 8. Achievement gaps are exacerbated in the online setting
SOURCE: Authors’ analyses based on CCCCO MIS data.
NOTES: Achievent gaps are calciulated on the predicted success rates from regression models that control for differences in the student mix across terms, colleges, and subject areas. Data are based on 2006 student cohort data.
Achievement gap (percentage points)
White-Asian achievement gap White-African American achievement gap White-Latino achievement gap Older-younger achievement gap Female-male achievement gap Traditional courses Online courses –5 0 5 10 15 20
courses, with students performing particularly poorly in online courses in these subject areas. Online courses are uncommon in engineering and industrial technolo- gies (only 2.3% of enrollment), somewhat more common in public and protective services (7.8% of enrollment), and relatively common in media and communications (15.9% of enrollment).
The variation in online performance gaps across subject areas may have many different causes. For exam-ple, students may perform significantly worse in online sections of a course in subject areas that require more intensive student-instructor interactions, a high degree of hands-on demonstration and practice, or immediate per-sonalized feedback. Alternatively, students may be exposed to higher performing peers in some subject areas and lower performing peers in others. If peer performance is signifi-cantly different in online than in traditional courses, then peer effects—the potential for peers to affect individual achievement—can be another potential source of this variation (Xu and Jaggars 2013b).14
Online Learning and Long-Term
Student Outcomes
As we have demonstrated so far, students in California’s community colleges are less successful in online courses than in traditional courses. This finding is true across the board—for all kinds of students, in all subject areas, at
almost all colleges around the state. However, these find
-ings focus on how well students do in a particular course at a particular time. They do not address another important
aspect of online learning, which is how it affects long-term student outcomes.
We find that in the long term, students who take online classes tend to be more successful than those who enroll only in traditional courses. In this analysis, we con-sider two definitions of success: transferring to a four-year institution and earning an associate’s degree. We control for an array of factors: student demographic character-istics, student academic performance during his or her college career, and the fact that some community colleges have higher completion and transfer rates than others. We separate our sample into three groups based on total units earned and use the proportion of units taken online as a predictor of long-term success (see Technical Appendix A for details).
Community colleges serve a diverse population of stu-dents with a broad range of educational goals. Therefore, we restrict this analysis to degree- or transfer-seeking stu-dents and exclude stustu-dents whose stated goal was to take a few courses to improve basic skills, acquire or update job skills, and so on. Our final sample for this analysis includes about 130,000 students in the 2006 cohort, one-third of whom took at least one course online during the six years we followed them.
We find that online course-taking varies with the total units a student earns, with those who take more units more likely to take an online course. Therefore, we divide our sample of students into three groups accord-ing to how many course credits they earned duraccord-ing their college careers (< 30, 30–60, > 60). Among students who took fewer than 30 units, 13.6 percent took at least one online course, and among those who took between 30 and 60 units, 35.2 percent did so. Among those students taking the most units—at least 60—more than half (53.9%) took at least one online course.
Perhaps unsurprisingly, we find that the likelihood of long-term success increases with the total number of units that a student earns, regardless of whether those units were earned online or in traditional classrooms. About 38 percent of community college students in our cohort completed at least 60 units. For these students,
In every academic subject area,
students are less likely to succeed in online
than in traditional courses.
students who take online courses do successfully pass those courses. For students juggling school, family, and work obligations, the ability to maintain a full-time load by mix-ing in one or two online courses per term may outweigh the lower chances of succeeding in each particular online course. Moreover, if a student’s choice is between taking an online course or waiting for the course to be offered in a classroom at a convenient time, taking the online course can help expedite completion or transfer. Overall, it appears that the availability and flexibility of online courses help many students achieve their long-term educational goals.15
Conclusions and Policy
Recommendations
Online learning has generated keen interest among policy-makers and higher education officials.16 Governor Brown’s
2013–14 budget provided tens of millions of dollars to expand online learning in California’s public institutions of higher education.17 In addition, the state legislature
proposed six bills in the 2013–14 session related to online education in an attempt to make it more accessible, effi-cient, and accountable.18 Only one of these bills has been
signed into law—suggesting that interest is trumping a clear consensus of how to move forward in this realm.
But even in the absence of overarching and consistent state policies, California’s community colleges have been quick to adapt. The rapid rise in online course offerings and enrollment is strong evidence of community colleges’ willingness to innovate. Their success in establishing a vast online learning program relies in large part on the ability to use existing infrastructure—in the form of distance learning departments—to adopt new technologies. The community college mission to reach as many students as possible and a faculty willing to participate have also helped to create a strong online learning culture.
Community college efforts in this realm have paid tremendous dividends, at least in terms of access to higher education. Over the past ten years, online course enroll-ment has increased by almost one million, and online course online course-taking is strongly associated with improved
long-term success rates (Figure 10). In general, the more online units these students took, the more likely they
were to transfer or earn an associate’s degree. However,
this finding did not hold true for students who completed between 30 and 60 units (21.6% of our cohort). In this group, those who took some units online had only slightly higher completion rates than those who took no online courses. And this effect does not increase as the share of units taken online increases. Among those who took fewer than 30 units (40.3% of our cohort), we see that more online units are associated with improved outcomes.
Even though course success rates are lower in online courses than in traditional courses, the majority (60%) of
SOURCE: Authors’ analyses based on CCCCO MIS data.
NOTES: Success count is the number of students who earned an associate’s degree, or a Chancellor's Office-approved Certificate, or transferred to a four-year institution. Data are based on the 2006 student cohort data. See Technical Appendix A and technical appendix Tables B13 to B15 for details.
Figure 10. Long-term outcomes are better for students who take online courses Per cen tage 0 10 20 30 40 50 60 70 80 0 5 10 20 30 40 50 60 70 80 90 100
Share of units taken online (%)
A. Likelihood of transfering to a four-year institution
At least 60 units Between 30 and 60 units Less than 30 units
Per cen tage 0 10 20 30 40 50 60 70 80 0 5 10 20 30 40 50 60 70 80 90 100
Share of units taken online (%)
B. Likelihood of earning an associate's degree
At least 60 units Between 30 and 60 units Less than 30 units
ment of courses is especially important across California’s higher education systems, from the community colleges to California State University and the University of California.
Understanding lower success rates in online courses will require better information-gathering on the current state of online courses. Little is currently known about the presentation of online course material in California’s com-munity colleges. Some courses might be highly interactive, but others are simply videotaped lectures. Courses also vary in terms of teacher-student contact. In our analyses, we are unable to identify the specifi c presentation style of
online courses. However, our discussions with community
college offi cials, including coordinators of distance educa-tion, lead us to expect that the vast majority of community college online courses are relatively simple, consisting primarily of video lectures and PowerPoint presentations.
To fi nd out more about the quality of online courses and to identify areas of improvement, the community col-leges could develop a standardized learning management system (LMS). Th ese systems are widely used, in online and classroom-based courses alike, to create environments in which students interact with their professors, their course materials, and each other. But unlike traditional enrollment has increased to nearly 11 percent of all
commu-nity college course enrollments. In addition, participation in online courses has increased for each of the state’s largest ethnic groups—and online enrollment rates for African American students, an underrepresented group in higher
education in California, are particularly high. However,
these rates are much lower among Latino students. Online learning is not without its challenges. We fi nd that students in California’s community colleges are less successful in online courses than in traditional courses. And this fi nding is true across the board—for all kinds of students, in all subject areas, at almost all colleges around the state. Moreover, achievement gaps are even greater in online courses than in traditional courses.
Despite these issues, online learning does off er some cause for optimism. We fi nd that long-term outcomes are better for students who take online courses than they are for those who take only traditional courses. Students who have taken an online course are more likely than those who have not to earn an associate’s degree or to transfer to a four-year university.
It is important to remember that online learning is still relatively new. Th ere is reason to believe that the online performance gaps that we identify in this report can be minimized with strategic planning, improved technology, and increased funding.
Strategic planning can help online learning at the community colleges become more eff ective for students. Currently, online course off erings are relatively ad hoc, with course development primarily dependent on faculty interest and initiative. Better planning on a system level would allow for several improvements. For instance, online courses could be used to satisfy unmet demand for tra-ditional courses—in particular, prerequisites and other courses that act as gatekeepers to success. By extension, online learning could also be eff ective in opening up popu-lar degree pathways that experience enrollment bottlenecks.
Th is type of planning would be useful at the individual college level and systemwide. In both cases, the portability of online courses is an important consideration—units earned at one college should count at another. Better
align-Going forward, a stronger strategic approach will help California to make the most of its investments in online learning.
Technical appendices to this report are available on the PPIC website: www.ppic.org/content/pubs/other/514HJR_appendix.pdf
classrooms, these environments can keep a detailed log of everything that happens there, providing a rich data source for instructors and administrators to assess student behav-ior and engagement.
A standardized LMS could aggregate data across com-munity college campuses and distribute them to administra-tors, faculty, and students to improve online pedagogy. This approach would allow the colleges to target their limited resources toward interventions that improve course comple-tion and long-term outcomes—including professional development for faculty in course development and delivery and online student support tools such as counseling and tutoring. These efforts are especially important for at-risk and nontraditional students. The governor recognizes the need for a standardized LMS, and in his 2013–14 budget for the community college system, he specifically stipulated that a share of the $16.9 million earmarked for technological innovation be spent on “the creation of a single, common, and centralized delivery and support infrastructure for all courses delivered through technology and for all colleges.”
How much would new developments in online learning cost? Unfortunately, cost is one of the great unknowns of
online learning. Policymakers who promote online learn-ing often do so in the hope and expectation that online courses will be less expensive to deliver than traditional courses. But empirical evidence on the costs of online education is lacking (as it is for traditional courses). Online learning might be especially cost-effective if faculty and infrastructure costs (including classroom space) are lower for online courses than traditional courses, and if course sizes are larger than traditional courses. But the fixed costs to create an online course, and even the continuing costs to
maintain and operate an online course, could be quite high. For example, online courses require greater investments in technology than face-to-face courses. Training for instruc-tors in developing and teaching online courses also might mitigate any cost benefits of online courses.
Systematic information on the cost of developing and maintaining online courses is not collected in the com-munity college system. Our discussions with comcom-munity college officials lead us to believe that relatively little funding has been available to develop and deliver online courses.19 With new funding on the horizon, community
colleges can increase their planning and priority-setting efforts for online learning. Additional funds might best be directed toward enhancing the pedagogical and techno-logical sophistication of online courses to improve student success. It would also be valuable to track costs involved in developing and maintaining online courses.
Online learning in California’s community colleges has already made significant strides in expanding oppor-tunities in higher education. And it has the potential to become an even more important method of increasing student access and improving student success. The com-munity colleges’ Online Education Initiative is an impor-tant step toward improvement. Its success will depend on identifying and implementing effective policies and programs that improve student outcomes. In addition, establishment of a statewide higher education body would enhance the ability to assess and plan for online learning across the state’s higher education systems. Going forward, a stronger strategic approach will help California to make the most of its investments in online learning, for the ben-efit of students and the state. ●
Notes
1 Lack (2013) provides an overview of online learning in higher education.
2 Their results suggest that community college students who choose to take courses online are less likely to complete and perform well in those courses.
3 Unfortunately, given the lack of systematic information on the costs of developing and providing a course (online or not) and the multiple complexities involved in making generalizations about costs across different types of courses and institutions, we cannot address the first assumption underlying the cost-effectiveness argument.
4 Course enrollment is a duplicate count of students.
5 Certificate programs are more common than degree programs (CCCCO 2013).
6 Two of the three are in isolated areas of the state (Cerro Coso in the eastern Sierra and Barstow in the Mojave Desert) where online learning is seen as a way to reach more students. Coast-line was originally established to serve as a distance learning college for the Coast Community College District (in Orange County) with a history of extensive outreach to and enrollment of military personnel.
7 Based on the authors’ analyses of CCCCO MIS data. Before 2002, distance education courses did not include noncredit courses. Other regulatory changes in 2002 allowed distance education courses to be treated the same as traditional courses for calculating enrollment and thus funding (CCCCO 2011). 8 The survey was conducted among students who withdrew from distance education courses. It is not clear how the results would vary for all online students.
9 Specifically, we control for college age, gender, race/ethnicity, nativity status, economically disadvantaged status, other finan-cial aid recipient, highest level of education at the time of initial enrollment, prior dual enrollment, ever enrollment in basic skill courses, full-time status, disability status, academically disad-vantaged status, intent to transfer, enrolled in more than one college, and student’s GPA in his or her first term.
10 In other words, students tend to be positively selected into online coursework.
11 For this analysis, we include all the courses taken by those students in the 2006 cohort who were ever enrolled in an online course. This yields a sample of almost 1.8 million enrollments (13.8% in online courses).
12 According to a recent study that uses a different empirical approach, Latino California community college students experienced a 9 percentage point lower success rate, grades that average two-tenths of a grade point lower, and withdrawal rates over twice as high as Latino students in face-to-face sec-tions of the same courses (Kaupp 2012).
13 Other studies have found that older community college stu-dents tend to have poorer long-term academic outcomes than college-age students because of family and employment obliga-tions (see, for example, Calcagno et al. 2007).
14 As we showed in the previous section, some subpopulations of students have lower online performance gaps than others. Therefore, it is possible that the type of students who took online courses in each subject area is one factor driving the variation in online performance gaps across subject areas. In fact, the variation across subject areas in terms of online course success persisted after taking into account both the characteristics of students in each subject area and how those characteristics might differentially influence performance in online versus face-to-face courses.
15 However, caution is necessary in making causal interpreta -tions of these results, given that we are unable to control for self-selection bias in this specific analysis (self-selection bias is introduced by the fact that students choose whether to enroll in online learning sections as opposed to classroom sections). For example, it is possible that those students with higher shares of units online and positive long-term outcomes were highly selected in ways that we cannot account for.
16 For example, the Little Hoover Commission (2013) identified online learning as a promising area to improve higher educa-tion access and lower costs. The Legislative Analyst’s Office in 2010 offered a broad overview and set of recommendations on distance education for California’s public higher education institutions.
17 According to the revised version of the governor’s 2013–14 budget, the language requiring that the UC and CSU systems spend $10 million each in allocated funds for online learning was removed. Instead, the funds were earmarked to “increase the number of courses available to matriculated undergraduates
through the use of technology” to provide more financial flex-ibility to the two systems. Representatives of UC and CSU have stated that the primary use of the funds would still be for online course development. Identical language was used in the budget for the community college system, earmarking $16.9 million to “increase the number of courses available to matriculated undergraduates through the use of technology.” However, the community college earmark stipulated, “Priority will be given to development of courses that can serve greater numbers of students while providing equal or better learning experiences, but only if those courses are aimed at advanced students who are likely to succeed in these types of courses. This initiative will include three key elements: (1) the creation of a “virtual campus” to increase statewide student access to 250 new courses delivered through technology, (2) the creation of a single, common, and centralized delivery and support infrastructure for all courses delivered through technology and for all colleges, and (3) the expansion of options for students to access instruction in other environments and earn college credit for demonstrated knowl-edge and skills through credit by exam.”
18 Assembly member Marc Levine (D-10) introduced two bills, Assembly Bill (AB) 386 and AB 387, which proposed the establishment of uniform definitions of online learning for the CSU system, creation of an easily accessible database of online courses, and authorization for any student enrolled at a particular CSU school to enroll in an online course provided by any other CSU campus. Other legislation such as AB 944 (Brian Nestande), AB 895 (Anthony Rendon), and Senate Bill (SB) 547 (Marty Block) focused on the attainment of similar goals of streamlining online education, as well as articulating and increasing the general knowledge base surrounding the identification of best practices in online education. Senate Pro Tem Darrell Steinberg went a step further with his bill, SB 520, which sought to incentivize the three higher education systems to increase access to online courses by providing grants to individual campuses that showed progress in increasing online course offerings and subsequent enrollments. Only AB 386 was eventually signed into law.
19 In general, faculty do not receive financial support for the time they devote to developing online courses; however, they do receive support from distance education coordinators in terms of technology and training.
References
Baldassare, Mark, Dean Bonner, Sonja Petek, and Jui Shrestha. 2013. California’s Digital Divide, San Francisco: Public Policy Institute of California. Available at http://www.ppic.org/main /publication_show.asp?i=263.
Bohn, Sarah, Belinda Reyes, and Hans Johnson. 2013. The Impact of Budget Cuts on California’s Community Colleges. San Francisco: Public Policy Institute of California. Available at http://www.ppic.org/main/publication.asp?i=1048.
Breslow, Lori, David Pritchard, Jennifer DeBoer, Glenda Stump, Andrew Ho, and Daniel Seaton. 2013. “Studying Learning in the Worldwide Classroom, Research into EdX’s First MOOC.”
Research and Practice in Assessment 8, Summer.
Calcagno, Juan Carlos, Peter Crosta, Thomas Bailey, and Davis Jenkins. 2007. “Stepping to a Degree: The Impact of Enrollment Pathways and Milestones on Community College Student Out-comes.” Research in Higher Education 48 (7), 775–801.
CCCCO (California Community College Chancellor’s Office). Undated. “Data Element Dictionary.” Available at http://extranet .cccco.edu/Divisions/TechResearchInfoSys/MIS/DED.aspx. ———. 2011. Distance Education Report. Sacramento, CA. Avail-able at http://extranet.cccco.edu/Divisions/AcademicAffairs /InstructionalProgramsandServicesUnit/DistanceEducation.aspx. ———. 2013. Distance Education Report. Sacramento, CA. Avail-able at http://extranet.cccco.edu/Divisions/AcademicAffairs /InstructionalProgramsandServicesUnit/DistanceEducation.aspx. Chiburis, Richard C., Jishnu Das, and Michael Lokshin. 2011. “A Practical Comparison of the Bivariate Probit and Linear IV Estimators.” Policy Research Working Paper 5601. Available at http://elibrary.worldbank.org/doi/pdf/10.1596/1813-9450-5601.
Greene, William. 2002. “The Bias of the Fixed Effects Estima-tor in Nonlinear Models Estimating Econometric Models with Fixed Effects.” Available at http://people.stern.nyu.edu/wgreene /nonlinearfixedeffects.pdf.
Kaupp, R. 2012. “Online Penalty: The Impact of Online Instruc-tion on the Latino-White Achievement Gap.” Journal of Applied Research in the Community College 12 (2), 1–9.
Lack, Kelly A. 2013. “Current Status of Research on Online Learning in Postsecondary Education.” Ithaka S & R. Available at http://www.sr.ithaka.org/research-publications/current -status-research-online-learning-postsecondary-education. Little Hoover Commission. 2013. “A New Plan for a New Economy: Reimagining Higher Education.” Report #218. Available at http://www.lhc.ca.gov./studies/218/Report%20218.pdf. Taylor, Mac. 2010. “The Master Plan at 50: Using Distance Education to Increase College Access and Efficiency.” Legislative Analyst’s Office Report. Available at http://www.lao.ca.gov /reports/2010/edu/distance_ed/distance_ed_102510.pdf. Xu, Di, and Shanna Smith Jaggars. 2011. “The Effectiveness of Distance Education Across Virginia’s Community Colleges: Evidence from Introductory College-Level Math and English Courses.” Educational Evaluation and Policy Analysis 33. ———. 2013a. “The Impact of Online Learning on Student’s Outcomes: Evidence from a Large Community and Technical College System.” Economics of Education Review 37, December, 46–57.
———. 2013b. “Performance Gaps Between Online and Face-to-Face Courses: Differences Across Types of Students and Academic Subject Areas.” The Journal of Higher Education
About the Authors
Hans Johnson is a Bren fellow at the Public Policy Institute of California.
His work focuses on the dynamics of population change in California and
policy implications of the state’s changing demography, with a focus on higher education. At PPIC, he has conducted research on education projec-tions and workforce skills, population projecprojec-tions, international and domestic migration, and housing. Before joining PPIC as a research fellow, he was senior demographer at the California Research Bureau, where he conducted
research on population issues for the state legislature and the governor’s office. He has also worked
as a demographer at the California Department of Finance, specializing in population projections.
He holds a Ph.D. in demography from the University of California, Berkeley.
Marisol Cuellar Mejia is a research associate at the Public Policy Institute of
California’s Sacramento Center, where her work focuses on tracking economic
and demographic trends that shape policy issues in the state. Her research
interests include labor markets, housing, business climate, workforce skills, and higher education. Before joining PPIC, she worked at Colombia’s National Association of Financial Institutions as an economic analyst, concentrating on issues related to the manufacturing sector and small business. She has also conducted agricultural and commodity market research for the Colombian National Federation of Coffee Growers and the National Federation of Palm Oil Growers of Colombia. She holds an M.S. in agricultural and resource economics from the University of California, Davis.
Acknowledgments
The authors would like to acknowledge the efforts of Patrick Perry, Alice Van Ommeren, and
Myrna Huffman at the California Community Colleges Chancellor’s Office. Their excellent work
in creating data files and their deep knowledge of the community colleges made our jobs much easier. We benefited from the helpful comments and reviews of Shanna Smith Jaggars, Russ Poulin, Sarah Bohn, Patrick Murphy, and Lynette Ubois. We also appreciate the information provided to us via confidential interviews with community college faculty and administrators. Finally, this work would not have been possible without the support of the Donald Bren Foundation. Research publi-cations reflect the views of the author and do not necessarily reflect the views of the staff, officers, or Board of Directors of the Public Policy Institute of California. Any errors are our own.
Board of Directors
D O N N A LU C A S , C H A I R
Chief Executive Officer Lucas Public Affairs
M A R K BA L DA SSA R E
President and CEO
Public Policy Institute of California
R U B E N BA R R A L E S
President and CEO GROW Elect
M A R Í A B L A N CO
Vice President, Civic Engagement California Community Foundation
B R I G I T T E B R E N
Attorney
WA LT E R B . H E W L E T T
Member, Board of Directors
The William and Flora Hewlett Foundation
PH I L I S E N B E R G
Vice Chair
Delta Stewardship Council
M A S M A SU M OTO
Author and Farmer
S T E V E N A . M E R K SA M E R
Senior Partner
Nielsen, Merksamer, Parrinello, Gross & Leoni, LLP
K I M P O L E S E
Chairman ClearStreet, Inc.
T H O M A S C . SU T TO N
Retired Chairman and CEO Pacific Life Insurance Company
PPIC is a public charity. It does not take or support positions on any ballot measures or on any local, state, or federal legislation, nor does it endorse, support, or oppose any political parties or candidates for public office. PPIC was established in 1994 with an endowment from William R. Hewlett.
Copyright © 2014 Public Policy Institute of California. All rights reserved. San Francisco, CA Mark Baldassare is President and Chief Executive Officer of PPIC.
Donna Lucas is Chair of the Board of Directors.
Short sections of text, not to exceed three paragraphs, may be quoted without written permission provided that full attribution is given to the source.
Research publications reflect the views of the authors and do not necessarily reflect the views of the staff, officers, or Board of Directors of the Public Policy Institute of California.
Library of Congress Cataloging-in-Publication Data are available for this publication. ISBN 978-1-58213-158-0
PU B L I C P O L I C Y I N S T I T U T E O F C A L I F O R N I A
500 Washington Street, Suite 600 ● San Francisco, California 94111
Telephone 415.291.4400 ● Fax 415.291.4401
PPI C SAC R A M E N TO C E N T E R
Senator Office Building ● 1121 L Street, Suite 801 ● Sacramento, California 95814
Telephone 916.440.1120 Fax 916.440.1121