Copyright © 2016 Vilnius Gediminas Technical University (VGTU) Press Technika http://www.bjrbe.vgtu.lt
doi:10.3846/bjrbe.2016.18 OF ROAD AND BRIDGE ENGINEERING ISSN 1822-427X / eISSN 1822-4288
2016 Volume 11(2): 153–159
1. Introduction
Geodetic engineering works, topographical and cadastral measurements, construction of roads, road repair works, reconstruction of the structures or other works serve as a certain part of the continued technological process, re-quiring an accurate marking out of the location. Roads and streets are objects of the country’s strategic infrastructure. They comprise a specific area when creating a topographic map. According to the Law on Roads (1995), a road is de-fined as an engineering structure designed for vehicle and pedestrian traffic. The roadway consists of subgrade, car-riageway, verges, central reservation, road ditches, cross-ings, bus stops, rest areas, pedestrian and bicycle paths, road constructions, technical traffic control means, veg-etation lanes, road weather and transport traffic observa-tion devices, lighting and other objects (Papšienė et al. 2014) with the ground area on which they stand (Plati, Georgouli 2014). Land area occupied by a road ranges from 8 m to 39 m. But including the situation markings, road components and surrounding objects, the measured road width can reach 100 m.
Most of the roads (streets) in Lithuania have already been built. Although at present a relatively small number of completely new projects are being prepared, the need for such projects exists for the newly planned residential districts. Topographical maps are mainly implemented for already existing roads, for the purpose of their repair, reconstruction, inventory, etc.
In order to carry out the measurements as accurately as possible, digital surveying devices are used (Ruzgienė et al. 2015). Topographical measurements are performed applying various methods representing different tools and instruments, their systems and technologies (Papšienė et al. 2014). Today, a wide range of choices is available, from optical levelling instruments and electronic tacho-meters to laser scanning systems, which are able to per-form automated measurements, solve geodetic tasks. They are capable communicating with other equipment, process data, immediately submit the derived results, etc. The time expenditure tends to be reduced, the accuracy of the measurements is improved, the scope of the cham-ber works is decreased, etc. The above mentioned factors
ADVANTAGES OF LASER SCANNING SYSTEMS FOR TOPOGRAPHICAL
SURVEYS IN ROADS ENGINEERING
Vladislovas Česlovas Aksamitauskas1, Vilma Kriaučiūnaitė-Neklejonovienė2,
Donatas Rekus 3, Birutė Ruzgienė4, Virgaudas Puodžiukas5, Arminas Stanionis6
1, 6Dept of Geodesy and Cadastre, Vilnius Gediminas Technical University, Saulėtekio al. 11, 10223, Vilnius, Lithuania 2, 3Kaunas University of Technology, Donelaičio g. 73, LT–51367 Kaunas, Lithuania,
4Klaipėda State College, Jaunystės g. 1, LT–91274 Klaipėda, Lithuania
5Dept of Roads, Vilnius Gediminas Technical University, Saulėtekio al. 11, LT–10223, Vilnius, Lithuania E-mails: 1ceslovas.aksamitauskas@vgtu.lt; 2vilma.kriauciunaite@ktu.lt; 3donatas.rekus@ktu.lt;
4b.ruzgiene@kvk.lt; 5virgaudas.puodziukas@vgtu.lt; 6arminas.stanionis@vgtu.lt
Abstract. The objective of the work is to assess the advantages of the laser scanning system in the topographical surveys. The analysis and assessment of two methods, the classical total station method and mobile laser scanning are presented in the article. The results of the performed investigations have been compared, the technological characteristics and accuracy of the investigations have been presented, as well as the procedure of the topographic image formation, possi-bilities and efficiency have been assessed. The real-life topographic survey’s projects on the analysis of roads and streets (components) have been used where the ground surface, the components of the roads and the surrounding objects have been analysed. The analysis provides information on the availability and potential of the investigated methods and the final attained accuracy due to a certain number of the control points. The obtained results indicate that the main differences of the methods revealed when compiling the topographical images for urban or rural areas are the speed of measurements and data processing, level of detail of the results and various possibilities of the method implementation.
are significant when performing topographical measure-ments, which in turn greatly determine the quality of an engineering structure as well as its life cycle.
Many highway bridges were designed and built years ago for smaller vehicular loads, applying at that time valid codes and standards. Therefore, the behaviour of structural components of these bridges should be inspected and controlled more carefully.
The main reason for using the Light Detection and Ranging (LIDAR) system is the potential of the system within a short period of time to accumulate a large amount of information on the position of the Earth’s surface points (Kalantaitė, Stankevicius 2009). The present development of the high accuracy laser scanning provides greater feasi-bility in performing engineering geodetic and geotechni-cal tasks. The LIDAR technology presents extensive possi-bilities for scientific geodetic research studies. The method is presented as a modern and effective digital mapping of the Earth’s surface and other objects, especially in the developed territories, where it is difficult to apply stereo-photogrammetry (Žalnierukas et al. 2009). Aero-photog-raphy could only partly be supplemented by such type of scanning. The accuracy of the scanned data of the largest cities was analysed by Žalnierukas et al. (2009). Scanning was compared with the obtained aero-photogrammetric data. The authors achieved surprisingly good results when analysing the final accuracy, which satisfied the accuracy requirements mandatory for the development of digital models. While investigating and performing tests with the mobile scanning system, certain errors were detected, however the potential of the method was anticipated when further developing the method. When scanning by the surface scanner or mobile scanner, a high density of the surface points was acquired reaching thousand readings per m2 and more, unlike when scanning from the airplane (1–4 deductions per m2) (Kalantaitė et al. 2012).
By this experimental study, the attempt was made to present technological differences between diverse mea-suring methods and assessment of them. The study in-troduces the alternative for the traditional measurements
(electric tachometer) as well as the visualized and summa-rized results of the topographical survey of the particular road and street sections.
The objective of the survey was to assess the advanta-ges of laser scanning systems in the topographical surveys.
The tasks of the survey were:
1. To compile topographic images for the selected road or street;
2. To investigate the mobile scanning method for compiling topographic images for roads (streets) and to compare it with the total station method;
3. To assess the possibilities and efficiency of the met-hod when compiling topographic images.
The object of the survey is the procedure of com-piling topographic images for the sections of roads and streets by means of the mobile laser scanner and the total stations method.
2. The object of the research and methodology
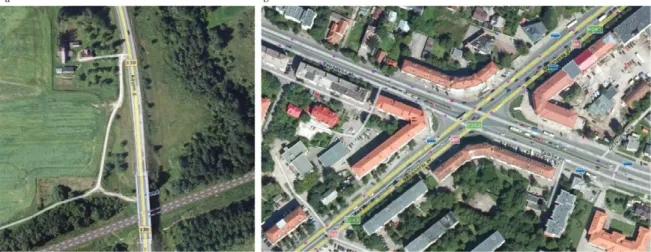
The measurements were performed in Kaunas region. The differences in the chosen measuring methods were high-lighted by selecting urban and rural environments. The surveyed Savanorių street crossroad, at Taikos street in Kaunas city is considered to be one of the busiest transport hubs. About 300 m of Savanorių street and 150 m of Taikos street as well as of Tvirtovės street intersection (Fig. 1a) have been measured. The section of the local country road No. 130, named Kaunas–Prienai–Alytus, located in Kau-nas region, near the village Pagiriai in the municipality of Garliava, was selected. The section was located between 12.738 to 13.038 km (300 m) (Fig. 1b). In both territories, the zone of 50 m width was measured; the total area com-prised about 4.25 ha. The main difference between the an-alysed objects was the following:
Crossroad of Savanorių street and Taikos street in Kaunas: the intersection of the streets is located on the same level with the relief; the residential buildings located around the crossroad are of 4–5 storey height (and lower), the territory is densely populated.
Section of road No. 130. The section of the road was constructed on the roadway foundation, which, when approaching the traffic roundabout, elevates the road by more than 4 m above the naturally dominant relief; the area is located in a rural environment, dominated by open fields, meadows, greenery plantations. The area contains an overpass over the railway track.
The obtained results can enable selecting the optimal measuring method when performing purposeful works. The size of the territory is close to the scope of the com-mon repair works performed normally on sections of the roads (streets) which normally are 100–500 m length.
The topographic images of the road and street sections were made by the laser scanning system and by the electro-nic tachometer. The peculiarities of the measuring process were assessed, and the results were derived during the mea-surements. The possibilities of the method application were determined. The measuring characteristics were assessed in terms of the complexity of the process when deriving the results and the time required performing the measu-rements. The data (collected during the measurements and processed) are compared visually and analytically.
The topographic image basis (gathering of the control points) was performed applying the portable receiver GNSS Trimble R8. Total station measurements were per-formed by applying Leica TCRP1205 electronic tachome-ter. Mobile laser scanner was performed by applying the platform of Street Mapper 360 system, which was mounted on Nissan Navara off-road vehicle frame.
Total station method was applied using Leica TCRP1205 in the Non-Prism Mode. The phase shift of measurement was applied, i.e., the total station sends a laser impulse into the measuring object that bounces off the object and returns to the device. The microprocessor calculates the time for the signal to return back and con-verts it into a distance. Then, according to the readings of the limbs, the angle is calculated, thus the spatial posi-tion of the point is determined. The measurement method without applying the reflector makes it possible to bring nearer the diverse methods of measurements and enables performing the comparison more objectively.
In the system Street Mapper 360, two high accuracy laser scanners (Reigl), GNSS receiver (Novatel), the mo-dule of the inertia navigation (IGI), two side cameras and computers are used for collecting data, monitoring and managing data streams. Both scanners viewed in a 360° angle and the measured distance could reach 300 m due to the tilted scanners by 45° angle. The system was able to scan the infrastructure of roads, buildings and vegetation from the moving vehicle. During the scanning process, the scanner sensor fixed the spatial position of the point, just after the reflection of the laser was returned back from the measured object. The scanning was performed without exceeding the specified speed in the urban and rural areas, 45 km/h and 70 km/h, respectively. The average density of points within the distance of 5 m from the scanner, at the scanning frequency of 300 kHz and speed of 45 km/h is
about 716 points/m2. When the speed is 70 km/h, the den-sity becomes 466 points/m2.
The field works started by compiling the points of the image basis using a mobile receiver GNSS Trimble R8, with the help of the static method of measurement. Eleven points of the base were collected in total (Fig. 2). The points were marked with a reflective paint in order to be easily recognized when processing the data after laser scanning.
The data collected during the process of the mobile laser scanning were processed by applying four software packages. GrafNav 8.40 was used for GNSS data proces-sing; AEROoffice V5.3b was used for the navigation data processing; RiWORLD v4.3 was applied for the generation of the point cloud; Microstation V8i together with Ter-raSolid sub-programs was used for managing the point cloud (filtration, adapting the system of coordinates and geoids, etc.) as well as for point control (deleting of points, editing, etc.). When measuring by the electronic tachome-ter, the data of measurements were directly exported from the device and using the CAD system compiled into un-derstandable files on the codes of pickets, the targeted po-sition and the altitude popo-sition.
The detailed scheme for measurements and data pro-cessing is presented in Table 1, which indicates that the equal number of technological steps was performed du-ring the field works by both methods. All the measure-ments were performed during the first half of a day, ta-king into consideration the more favourable GPS satellite location predictions, low air humidity, dry asphalt coating and ground surface.
The air temperature during the measurements was about +12 °C.
3. Results
The issues related to this survey are time expenditure, lev-el of detail and accuracy. According to previous studies (Grussenmeyer et al. 2008; Nuikka et al. 2008), the mea-surement of higher objects in terms of the time expendi-ture is more favourable to use laser scanning. However, it is necessary to draw attention to the fact that those studies
did not indicate the exact duration of time spent for the camera work execution. Therefore, it remains unclear what was the general (field and camera works) time duration. When measuring by the total stations, one point is mea-sured in 3–6 s. The beam of impulses (600 000 impulses per second), sent by the scanning system when reflected from the diverse surfaces, returns to the scanners within different periods (thus is caused by the texture of the sur-faces). A certain part of the laser impulses remains non-re-flected or only very few signals are renon-re-flected (Žalnierukas et al. 2009). The time in this study is assessed in accor-dance with the time the whole object is measured and the time required for the processing of data to be assessed.
The total station measurements directly depend on the number of the measured points as indicated in Table 2. It specifies the time consumed for visualizing separate ele-ments of the situation. During the mobile laser scanning
process the decisive factor of the time used is the size of the object, i.e. the covered distance and speed of the mea-suring process etc. Thus, this method is recommended for measurements of larger objects. When comparing the scope of the cameral works, it is obvious that the process of pro-cessing laser scanning data is considered to be a complica-ted one requiring a large amount of time.
The level of detail in this study is defined as the para-meter, which describes the absolute number of the measu-ring points (the number of readings) in the whole object being measured and in the area unit (in a square meter), in other words, it is considered as the density of the points. Taking into consideration similar surveys, the laser scan-ning is unambiguously the most advanced in terms of the level of detail. In all the cases, this advantage of the scan-ner helped to compile very detailed models of the surface. As stated by Nuikka et al. (2008), it is possible to view the
Table 1. The workflow of measurements and data processing
Technological step Description of the process
No. 1 Measurements of the control points with GPS receiver
No. 2
Topographical measurements Mobile laser scanning 1. Preparing for the measurements of total station
(centring, levelling of instrument, orientation) 1. Initialization of the system 2. Measurements of the points 3. Scanning of the object
No. 3 Export of the measurements
Data processing 1. GNSS data processing
2. Generating of the points cloud
3. Adjustments according to control points
No. 4 Topographical picture
Table 2. Comparison of methods according to the time expenditure and level of detail of the results
Time expenditure and level of detail of the results
Topographical method Mobile laser scanning Crossroad of Savanorių
and Taikos str. Section of road No. 130 Crossroad of Savanorių and Taikos str. (speed 45 km/h) 130 (speed 70 km/h)Section of road No. Measurement time
(field works) 2 h 30 min 30 min 20 min
Processing of the measurements. Generation of the points
cloud (cameral works)
12 min 12 min 3 h 30 min 3 h
Total time 2 h 12 min 42 min 4 h 3 h 20 min
Measurement processing. Generation of the points
(cameral works) 468 195 59.7 mln 6.7 mln
Average of point quantity,
in 1 m2 (1 point/59 m<1 2) (1 point/77 m<1 2) >2550 >1130 Averages of altitudes
differences on the soft surface, in cm
Grass cover (selected points 13 and 11) Soil (selected points 2 and 4)
2 3.5 0.7 0.8
Averages of altitudes differences on the hard
surface, in cm
Asphalt cover (selected points 9 and 11) Concrete (tiles) (selected points 6 and 4)
0.4 0.5 0.5 0.6
smallest deflections and deformations when investigating the floor planes. Laser scanning is able to fundamentally change the ordinary measurements, where high level of detail is required within a short period. As the results of the analysis indicate (Table 2), 34–127 thousand times more points were measured by the mobile laser scanning procedure than when using the tachometer.
The matrix of points, obtained by the scanning sys-tem, is such a dense one (distance between the points is from 1 cm), that without the auxiliary visual material it is possible to spot and recognize even the smallest details, e.g. the facades of the buildings, the contours of the ve-hicles, etc. Due to such a high level of detail of scanning, the points are spread on all the surrounding objects. The-refore, not a single square meter of the surface is left empty in the field of the scanner view. While using the total sta-tions method, only the characteristic points are marked, e.g. the refraction angles of the complex elements of the relief and roads and the objects are interpreted as the sepa-rate dotted elements (electric poles, wells and etc.).
By applying both methods, 78 393 366 points were collected in this study. During the measurements, about 10% of points became “bad“, which did not correspond to the current situation and they did not belong to any surfa-ce. To delete the points, which appeared during the mobile scanning, the filters of TerraScan subprogram, based on the algorithmic calculations, were used. These calculations could be adjusted according to the consumer needs at any moment. Meanwhile, the errors that occurred during the total station measurement process, if needed, could be de-leted manually, because only a small number of bad points were obtained and there was no need to produce compli-cated filters. The deleted errors could be compensated by the data of the additional measurements or by interpola-ting the surrounding points.
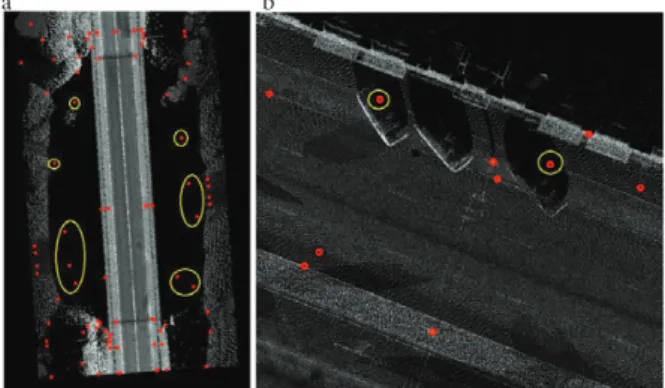
After overlaying the measuring results of both met-hods, very informative data were derived. In addition, the methods supplemented each other. During the scanning in the road distance at the road overpass, a very small amount of data was obtained, because the laser field of view was obs-cured by the bridge structures. Therefore, very little data was available for areas under the road overpass (Fig. 3). Shor-tage of information is successfully supplemented at this place by the total station measurements. At the crossroad, the data of scanning are more difficult to understand in those places which are blocked up by various (permanent and variable) objects, e.g. parked cars. Therefore, a shadow effect is obtained at such locations (Fig. 3). If there is a ne-cessity, these “shadows” could be supplemented by the to-tal station measurements.
The accuracy is understood as the correctness of the device readings, which is determined according to the maximum available size of the error. Electronic tachom-eter, which uses more complicated methods than the scan-ner methods for determining the point location, measures rather precisely. The great amount of the scanned points was adjusted by comparing with the control points. The
adjustment was performed by applying the subprogram of Terrasolid family or Tmatch and was exercised by specify-ing the locations of the control points in the large amount of the scanned points. The accuracy of the results was as-sessed by the interdependent differences of the altitude and the forecasted fixation of the objects. Šlikas and Kalantaitė (2013) assessed the accuracy of the altitudes of LIDAR data by comparing random points of the topographic map, col-lected by the common measuring methods, with the clos-est points of the scanned surface. The authors stated that the accuracy of the altitude of the points of the scanned surface, made from the plane, depended on the texture of the reflected surface. The most accurate points were those, which are reflected from the hard surface, such as asphalt and concrete. Thus, when assessing the differences of the altitudes randomly, 15 points on hard (stable) and soft (variable) surfaces were selected in this study. The derived results (Table 2) indicate that the greatest agreement (ac-curacy) between the methods was attained on the asphalt and concrete surfaces. The worst results were obtained on the surface of grass measured by laser and especially in ar-eas with tall, dense and not cut grass. The results are doubt-ful in the areas with dense vegetation (despite the devise used, a total station or a scanner), because the laser beam is unable to adequately reach the soil surface and only few points are measured. In accordance with the results of the performed analysis (differences of the altitudes), it is pos-sible to state that the accuracy of measurements directly depends on the texture, structure and stability of the re-flected surface.
In this survey, the difference of the forecasted fixation of the objects is comprehended rather subjectively. During the laser scanning procedure, a dense network of points covered all the surfaces located within the field of vision. Such a dense overlaying of the surfaces rather accurately repeats all the scanned contours and lines, so that the fore-casted accuracy is determined only by the distances be-tween the lattice of the points (the position of the entire bulk of points is not assessed) and the errors caused by the distance of the scanners (technical parameter). The measur-ing error of the scanner is up to 1 cm when scannmeasur-ing by the maximum range of 500 m (IGI 2013). Within the performed
study, the shortest observed distance between the scanned points was 0.1 cm. By providing a high density of the points, the scanner presents the forecasted situation more precise-ly (in a more detailed way), e.g. exactprecise-ly reflecting the road curves and other small details. When analysing the mea-surements of the typical elements, certain characteristics of the measuring methods are revealed. When measuring the angular component the forecasted, difference of the meth-ods is up to 2 mm, thus it is possible to declare that the ac-curacy of both measurements in this location is excellent. When analysing the characteristics of the circular (or semi-circular) component, it was obvious that when measuring with a total station, only one side of the circular element was measured (in this case the diameter of the pole was 0.35 m), while the scanner indicated the full component. The as-sumption can be made that using the total station method
for circular objects, an error of ½ of the diameter of the cir-cular component should be applied.
After completing the topographic measurements of the linear engineering structure, the general differences and peculiarities of the systems were identified for com-parison. The general technological differences of the sys-tems (Table 3) indicate the advantages and disadvantages of the analysed methods.
When compiling topographic images by the analysed methods, good results were derived, satisfying the accura-cy requirements for geodetic surveys applied for roads and streets. Both methods are fully applied when solving various engineering, geodetic and other tasks. Different level of de-tail enables reaching specified objectives not only for roads and streets. The most appropriate selection of the method has to be assessed in accordance with four criteria, i.e. the
Table 3. General differences of the analysed systems
Comparative object Mobile laser scanning system Total station
Measurement
Selection of points Bulk of points, individual
measurements are not possible Only single points Monitoring of measured objects Complicated, on computer screen
visible only laser readings on objects Objects are visible on straight viewing Remote control Impossible Possible, when using additional
equipment
Measurements of invisible points Impossible Partially possible, indicating displacements
Work Mode Full automatic Manual or half automatic (programming)
Data management
Cameral works Complicated, require considerable
manual work Not necessary Generation of points Slow, depends on computer speed and
number of generated points Fast, readings file is exported straight from the instrument Editing of points Automatic and manual Half automatic
“Bad” points >10% <10%
Visualisation Visualisation Complex structures are shown in details Visualized only characteristically collected points
Operating features
Point coverage of the object > 95% 10‒20% Speed of the measurements High Low Results Point cloud, random distribution of
points Single classified points Data processing Complicated Simple
Use of the instrument Simple Relatively difficult Applicability Special instrument Universal instrument Practical application Cadastral work;
designing;
detailed surface models creation; longitudinal and transverse inclination; identification of defects in coating; oversized cargo route planning; localising hinders;
archaeological, culturological, architecture research; engineering control works;
water lines, slope stability studies, etc.
Cadastral works;
scope of measurements, requirement for the level of detail, purpose of application and economic factor. The priority in selecting the method is mainly determined by the costs of an instrument and software as well as their cost effectiveness.
4. Conclusions
1. In the same territory within a rather short time peri-od (~30 min), significantly more detailed (>1000 points per 1 m2) and informative data is derived with the laser scanning method than when measuring by total station method. Mapping large and multi-component objects, it is more appropriate to use the laser scanning, because with increasing size of the object, the difference between the methods in terms of the time expenditure decreases.
2. Regarding the more informative data, the system of laser scanning could be applied for the multiple practi-cal uses. The areas of application include geodetic surveys of the linear engineering structures, compilation of the detailed models of the surfaces; identification of defects of coatings and coverings; implementation of archaeological, cultural, architectural investigations; engineering and inspection works; water reservoirs lines; investigations of slope stabi-lity, etc. Such systems are able to completely substitute the traditional measurements by the total stations.
3. The main differences of the analysed methods when compiling the topographic image in diverse areas is the informativeness of the measurements and data, the speed of data processing, the level of detail of the results and various possibilities of their application. Both methods are effectively employed when solving miscellaneous engi-neering, geodetic and other assignments.
References
Kalantaitė, A.; Stankevicius, Z. 2009. Simplification Algo-rithms of Selection Parameters of LIDAR Ground Sur-face Points Cloud, Geodezija ir kartorafija 35(2): 44–49. Available from Internet: http://www.tandfonline.com/doi/ pdf/10.3846/1392-1541.2009.35.44-49
Kalantaitė, A.; Paršeliūnas, E. K.; Romanovas, D.; Šlikas, D. 2012. Generating the Open Space 3D Model Based on LiDAR Data,
Geodezija ir kartorafija 38(4): 152–156. Available from
Inter-net: http://www.tandfonline.com/doi/abs/10.3846/20296991. 2012.758438
Nuikka, M.; Rönnholm, P.; Kaartinen, H. 2008. Comparison of Three Accurate 3D Measurement Methods for Evaluating As-Built Floor Flatness, The International Archives ofthe Photo-grammetry, Remote Sensing and Spatial Information Sciences
37 (B5): 129–134. Available from Internet: http://www.isprs. org/proceedings/XXXVII/congress/5_pdf/23.pdf
Plati, C.; Georgouli, K. 2014. Field Investigation of Factors Af-fecting Skid Resistance Variations in Asphalt Pavements, The
Baltic Journal of Roads and Bridge Engineering 9(2): 108–114.
http://dx.doi.org/10.3846/bjrbe.2014.14
Papšienė, L.; Balčiūnas, A.; Beconytė, G.; Motiejauskas, D.; Ro-manovas, D.; Aksamitauskas, Č.; Papsys, K. 2014. Feasibility of Integrated Transport Network Model in Lithuania, Trans-port 4(2): 346–354.
http://dx.doi.org/10.3846/16484142.2014.982175
Ruzgienė, B.; Berteška, T.; Gečytė, S.; Jakubauskienė, E.; Aksami-tauskas, Č. 2015. The Surface Modelling Based on UAV Photo-grammetry and Qualitative Estimation, Measurement 73: 619– 627. http://dx.doi.org/10.1016/j.measurement.2015.04.018 Grussenmeyer, P.; Landes, T.; Voegtle, T.; Ringle, K. 2008.
Com-parison Methods of Terrestrial Laser Scanning, Photogramme-try and TacheomePhotogramme-try Data for Recording of Cultural Heritage Buildings, The International Archives of the Photogrammetry,
Remote Sensing andSpatial Information Sciences 37 (B5): 213–
218. Available from Internet: http://isprsserv.ifp.uni-stuttgart. de/proceedings/XXXVII/congress/5_pdf/38.pdf
Šlikas, D.; Kalantaitė, A. 2013. Area 3-D Model Generation Ap-plying Data of Dimensional Scanning, Aviacijos technologijos
1(1): 52–56. Available from Internet: http://www.at.vgtu.lt/ index.php/at/article/view/at.2013.12
Žalnierukas, A.; Ruzgienė, B.; Kalantaitė, A.; Valaitienė, R. 2009. Miestų skenavimo LiDAR metodu tikslumo analizė,
Geodezi-ja ir kartografiGeodezi-ja 35(2): 55–60 (in Lithuanian).
http://dx.doi.org/10.3846/1392-1541.2009.35.55-60