* Corresponding author. E-mail: [email protected] Aja TUMAVIČĖ (ORCID 0000-0002-2373-5427)
Igoris KRAVCOVAS (ORCID 0000-0001-5772-6054) Vilma JASIŪNIENĖ (ORCID 0000-0002-6093-2825)
Copyright © 2020 The Author(s). Published by RTU Press
This is an Open Access article distributed under the terms of the Creative Commons Attribution
IDENTIFICATION AND ANALYSIS
OF PROBLEMS IN THE IMPLEMENTATION
OF ROAD SAFETY AUDIT IN LITHUANIA
AJA TUMAVIČĖ, IGORIS KRAVCOVAS*,
VILMA JASIŪNIENĖ Road Research Institute, Vilnius Gediminas Technical University,
Vilnius, Lithuania
Received 8 January 2019; accepted 3 January 2020
Abstract. Road Safety Audits have already been tightly incorporated in the road design process throughout the world. It has proven to be an effective way of increasing road safety without requiring many resources. The cost-benefit-ratios of Road Safety Audits in developed countries are rather high. In Lithuania, the procedure on Road Safety Audits is fairly new, and the direct links between different problems and their occurrence frequency throughout the years are yet to be determined. In this paper, several audits on road safety, performed between the years 2011 and 2017 by the Road Research Institute of Vilnius Gediminas Technical University, is analysed. The trends of most relevant problem types identified in those audits throughout the years for different types of roads and streets are presented. Based on those trends, the causes of some common problems are being recognised. Recommendations on possible solutions are suggested.
2020/1 5(2 )
Introduction
As the world develops in all aspects, one of the main concerns is reducing the unnatural death rate. One of the main causes of early deaths in road accidents. About 1.3 million people die in road accidents worldwide each year, and about 50 million people are getting injured (World Health Organization, 2015). Many deaths are in low- and middle-income countries, though recently the accident rate has increased in developed countries as well, despite the implemented road safety instructions and legislation. The possible reason for that is the increase in the number of vulnerable road users (pedestrians, cyclists, elderly, and children) on the streets and roads.
Around the world, efforts are being made to minimise the number of road accidents involving dead or injured people. For example, one of the United Nations (UN) Sustainable Development Goals (United Nations, 2018) is to reduce the number of road accidents, in which people died or were injured, by 50% by 2020 compared to 2010.
Janstrup (2017) reports that the positive trend over the last few years of reduced road fatalities interrupted in 2015 and 2016. In 2015, the number of fatalities increased in 21 International Traffic Safety Data and Analysis Group (IRTAD) member countries compared to 2014, in 2016 – fatalities increased in 14 countries. Figure 1 shows fatalities per 100 000 inhabitants in 2015 by IRTAD data.
In 2016, 3201 injuries on road accidents were recorded in Lithuania, in which 192 road users were killed. These numbers correspond to a 20.7% decrease in fatalities compared to 2015, while the number of
Figure 1. Road fatalities per 100 000 inhabitants in 2015 (Janstrup, 2017)
2.
3 2.7 2.8 3.1 3.1 3.5 3.6 3.7 3.8 3.8 4.3 4.9 4.9 5.1 5. 6 5.7
5.
8 6.4 6.5 6.5 6.9 7 7.3 7.7 8.
4
8.
4 9.1 10.
9
11.
1
11.
9 13.3 14 14.
5
14.
6
21.
5 23.6
0 5 10 15 20 25
Norway Sweden
United
Kingdom
Switzerland Denmar
k
Ir
el
an
d
Spai
n
Netherlands
Is
rael
Ja
pa
n
German
y
Icelan
d
Finlan
d
Au
st
rali
a
Ital
y
Po
rtuga
l
Sloveni
a
Luxembur
g
Be
lg
iu
m
Hungary
New
Ze
land
Cz
ech
Re
spublic Greece Poland
Li
thua
ni
a
Serbia Kore
a
United
St
at
es
Mo
rocc
o
Chil
e
Me
xico
Ja
maic
a
Ca
m
bodi
a
Urugua
y
Ma
lays
ia
South Africa
Road
fa
talitie
s
per
100
000
inhabitant
and Analysis of Problems in the Implementation of Road Safety Audit in Lithuania road accidents increased by 5.5%. In 2017, the number of fatalities stays
the same while the number of road accidents decreased by 0.3%. Based on the data from the Lithuanian Road Police Service in the first half of 2018 the number of fatalities increased by 1.3% ant the number of road accidents increased by 5.5% (Lithuanian Road Administration…, 2019). The number of road accidents, fatalities, and injuries from 2000 to 2017 in Lithuania is shown in Figure 2.
World experts continuously try to improve road safety by designing new traffic calming measures as well as regulating the use of standard measures such as speed humps, and road narrowing. However, even such effective measures have disadvantages. For example, Jasiūnienė, Pociūtė, Vaitkus, Ratkevičiūtė, & Pakalnis (2017) researched the effects of trapezoidal speed humps, installed on Lithuanian roads, on the driver and vehicle occupants. They found out that vertical acceleration values showed that 60% of humps exceeded the limit of very undesirable discomfort.
The planning stage could also be improved. Gaca & Kiec (2016) suggest that the design speed should be replaced with the concept of “the designing speed” and should cover not only the minimum values of the parameters but also their maximal values. This technique will allow obtaining a sufficiently uniform road image by “adjusting” its class and function.
Figure 2. Number of road accidents, fatalities, and injuries
from 2000 to 2017 in Lithuania (Lithuanian Road Administration…, 2019)
5807 5972 6090 5963 6372
6771 6658
6448
4795
3827 3530
3266 3392 3418 3255 3033 3201 3192 6960 7103 7427 7263
7877
8466 8334
8042
5818
4459 4230
3919 3952 4040 3785
3594 3750 3752
641 706 697 709 751 773 760 740 499
370 299 296 302 258 267 242 192 192 0
1000 2000 3000 4000 5000 6000 7000 8000 9000
2000 2001 2002 2003 2004 2005 2006 2007 2008 2009 2010 2011 2012 2013 2014 2015 2016 2017
Nu
mb
er of
road accidents,
fa
talities
and injuries
Year
2020/1 5(2 )
Huvarinen, Svatkova, Oleshchenko, & Pushchina (2016) thinks that the weakest component of the traffic network and one of the main reasons for a still high accident rate worldwide is “a person” in the context of growing motorisation and psychological stresses and increase of accidents risks. The human factor is one of the main causes of traffic accidents, that is why most developed countries try to eliminate it from the accident equation. As reported by Tisca, Istrat, Dumitrescu, & Cornu, (2016), Sustainable Safety in the Netherlands and the Swedish Vision Zero are the best-known examples of road safety visions, which were adopted by other countries. In both visions, the basic idea is to transform the road system to eliminate all known human-error possibilities, and to reduce physical damages due to accidents. It is also important to note that the number of elderly, i.e. y 60 or more years, is overgrowing in the world. The proportion of people in the mentioned age group being killed during the road accident is higher than their proportion in the population. Also, when the percentage of road fatalities in the world is decreasing globally, the proportion of older people deaths in road accidents is increasing (Janstrup, 2017). The number of road fatalities in the European Union (EU) decreased by more than half among people aged between 10 and 34 years old during 2006–2015 but increased for the elderly aged over 85 years old (Janstrup, 2017).
1.
Road Safety Audit as a tool for Road Safety
Management
Even though it is nearly impossible to eliminate the human factor from the traffic accident equation, there is a number of measures that could be implemented to promote the concept of the safe road worldwide. On 19 November 2008 European Parliament and the Council released a directive on Road Infrastructure Safety Management. After the publication of directive, many European countries developed procedures (Figure 3):
• Road Safety Impact Assessment (RSIA);
• Road Safety Audit (RSA);
• Road Safety Inspection (RSI);
• Network Safety Management (NSM);
• treatment of high accident concentration sections (Blackspot management).
and Analysis of Problems in the Implementation of Road Safety Audit in Lithuania
Figure 3. The methods of safety management of roads (Strnad, 2018)
Road Safety Impact Assessment
(RSIA)
Road Safety Audit (RSA)
Road Safety Inspection
(RSI)
Network Safety Ranking
(NSR)
High accident concentration
sections
Planned roads Roads in operation
Proactive Reactive
Good practices all over the world have proved the effectiveness of RSAs and RSIs. The cost-benefit-ratios of RSAs in other countries range from 1.34:1 (“acceptable”) to 99:1 (“excellent”) (ROSEBUD Consortium, 2006). Based on the request of the Europe Union directives to all member states to implement road safety procedures, Requirements of the Road Safety Audit (Lithuanian Road Administration…, 2012) and Requirements to the Procedure of the Road Safety Audit (Lithuanian Road Administration..., 2011a) issued in Lithuania by Lithuanian Road Administration under the Ministry of Transport were approved in Lithuania. These documents describe what requirements RSA must meet, obligations of auditor and others. On November 2011, Road Infrastructure Safety Management Guidelines (Lithuanian Road Administration…, 2011b) issued in Lithuania by Lithuanian Road Administration under the Ministry of Transport were approved in Lithuania were approved as well. These guidelines are used when assessing the impact on road safety of national significance roads, performing RSAs, RSIs, identifying road safety levels and road sections with a high accident concentration (Lithuanian Road Administration…, 2011b).
Road Safety Audit is a detailed road safety technical inspection in all design and implementation stages, from planning to road maintenance, as well as an assessment of the condition of the road in terms of road safety. The results of RSA are a description of the potential safety deficiencies. Usually, a list of recommendations for improvement is included in the report.
2020/1 5(2 )
prevention of such a significant amount of accidents saves justifies the costs required for the safety audit performance and implementation of the recommendations of the auditor.
Initial analyses in Poland by Jamroz, Budzyński, Kustra, Michalski, & Gaca (2014) show that RSA reduces the number of casualties by 5–20%. Over ten years, the costs of procedures and money saved because of fewer accidents produce an effect of 195:1. This improvement means that each euro spent on the operation of the RSM system generates 195 euro saved on accident costs.
Road safety audit identifies road design deficiencies, which have a possibility to affect the safety of road users adversely. The deficiencies identified in the RSA include small-radius vertical and horizontal curves, visibility limitations, inaccurate vertical and horizontal road markings, inadequate infrastructure for vulnerable road users, especially for people with special needs (disabled, children, and elderly), and others. Auditors in different European countries determined the most relevant problems in road design and other safety aspects. Road safety audits show that certain errors, which involve faulty designs of cross-sections and alignment, layout maps (Budzynski, Jamroz, Kustra, Gaca, & Michalski, 2011a, 2011b), poor pedestrian crossing design and vulnerable user separation from motorised traffic, lack of road markings and inadequate signage, bad intersection design occur frequently and are common to most European countries. Jovanov, Vollpracht, Beles, Popa, & Tolea (2017) determined additional significant road safety deficiencies identified within South-Eastern Europe, which include vertical and horizontal curves, public and private services, services along the roadside, roadside features and passive safety installations, roadside obstacles (plants, trees, light poles, and advertisements), temporary signing and marking at work zones. The most frequent problems in Poland identified by Jamroz, Budzyński, Kustra, Michalski, & Gaca (2014) are the lack of central reservation, structures placed on narrow pavements, insufficient visibility distance, poor surface drainage of the carriageway, interchanges mismatching the size and directional distribution of traffic. Additionally to common European road safety problems, Modal Highway Consultants Ltd. (2018) road safety auditors in the United Kingdom (UK) distinguish additional problems common to the UK, which include poorly sited street furniture, lack of guard railing, lack of anti-skid measures, poorly sighted traffic signal heads, lack of dropped kerbs for pedestrians and wheelchair users.
and Analysis of Problems in the Implementation of Road Safety Audit in Lithuania project had been implemented, i.e. when construction is done, it is very
complicated and requires much investment to repair these deficiencies. Therefore, it is essential to take the appropriate decisions when designing a road at the initial stages of the project (planning, design).
3. Methodology of analysis
In this paper, a total count of 317 RSAs was analysed. These audits were carried out in the years 2011–2017 by Road Research Institute of Vilnius Gediminas Technical University. Projects of various national and local roads, streets and intersections, driveways, and parking lots across Lithuania were audited. All audits were grouped by year, by the type of design project (road, street, and intersection), by the client (Lithuanian Road Administration, or municipalities or private clients). Road administration governed object audits were grouped by the type of road (highways, transit roads or regional roads).
After analysing all the 317 RSAs, a total of 2897 issues (problems) were registered. Each problem was assigned to one or more than one of 14 categories depending on an issue type. Categories are as follows: driveways, intersections, roadside, parking space, bus stops, pedestrians and bicyclists, speeds, alignment and profile geometry, road markings, road signs and vertical marking, carriageway geometry, traffic safety measures, unrecognisable roads, unsafe manoeuvres.
Later the problems were divided into categories, design object type and year were more thoroughly analysed in two perspectives. The first thing to be estimated was the significance of each problem category at any given year, expressed as a percentage of a number of problems assigned to any given category divided by the total number of problems registered that year. The second thing to be estimated as the rate of any given problem category during all analysed years. This rate is expressed as a percentage indicating category significance each year.
4. Overview of road safety problems identified
in the audit report
2020/1 5(2 )
fluctuation in the last three years. The Road Safety Audit statistics, depending on the object type – Lithuanian Road Administration object (state-level road or intersection) or local municipality and private client object (streets and local roads) are shown in Table 2. Table 2 also shows even steadier growth in audit count and joint problems and audit number in local municipalities and private client objects. The possible reason for the increase of the total number of audits per year is caused by stricter requirements for local authorities for the auditing procedure. Road safety audits are officially mandatory from 2011, and the control of their implementation becomes stricter each year, thus the increase. The possible reason behind the increase in the average problem and audit
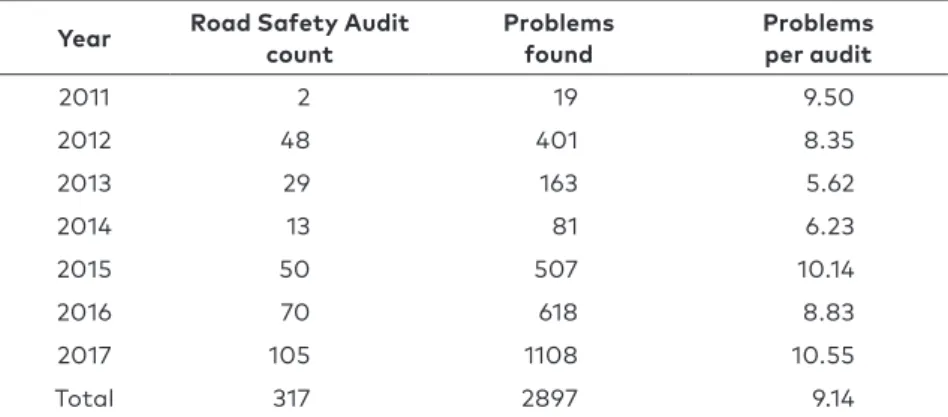
Table 1. Distribution of Road Safety Audit count and problems
Year Road Safety Audit count Problemsfound Problemsper audit
2011 2 19 9.50
2012 48 401 8.35
2013 29 163 5.62
2014 13 81 6.23
2015 50 507 10.14
2016 70 618 8.83
2017 105 1108 10.55
Total 317 2897 9.14
Table 2. Road Safety Audit distribution by year divided by object type
Year
Road administration objects Objects of the municipalityand private client
Road Safet
Audit count Problems found Problems per audit Road Safety Audit count Problems found Problemsper audit
2011 2 19 9.50 – – –
2012 46 388 8.43 2 13 6.50
2013 22 134 6.09 7 29 4.14
2014 6 37 6.17 7 44 6.29
2015 26 300 11.54 24 207 8.63
2016 48 447 9.31 22 171 7.77
2017 27 265 9.81 78 843 10.81
and Analysis of Problems in the Implementation of Road Safety Audit in Lithuania
number is the growing competence of auditors. Road safety specialists become more attentive to details with each new audit. Also, useful practice techniques, adapted from international colleagues, helps to see each audit from a different perspective. Another possible reason that road designers try to implement new road safety elements and choose individual solutions without having much practice of using them. This situation usually happens because in Lithuania all RSA orders are made via public procurement procedure, where the winner is determined by offered price for the job, and those auditors sometimes are quite inexperienced. Because of that, those solutions can often become erroneous and misinterpreted, and the higher auditor competence compared to designers in road safety matters lead to an increased number of issues in each project. However, another reason for the high number of problems found in road and street design projects is the short terms for the project implementation.
After further analysis of the distribution of Lithuanian Road Administration objects into highways, transit roads and regional roads related objects, a noticeable trend is the increase of regional road projects and their audits up to the year 2016 (Table 3). This regularity could be caused by an increased number of projects aimed to turn gravel and other unpaved roads to asphalt roads.
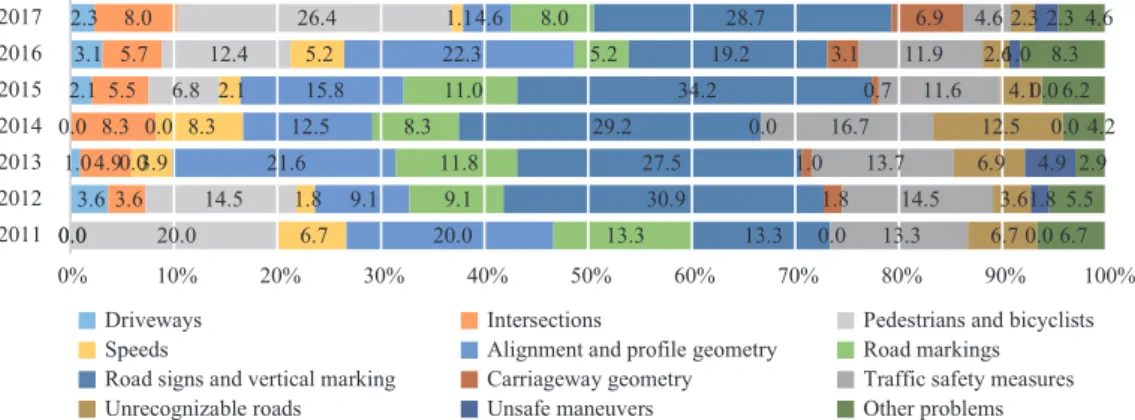
The first set of figures (Figures 4–8) shows the significance, expressed in the occurrence frequency of each problem category at any given year. Results during some years are greyed-out, meaning that this exact year they are unreliable because of a small number of complete audits or total problem categories assigned.
Figure 4 shows the statistics for all object types. What is noticeable, the most common problem in earlier years was related to road signs
Table 3. Road Safety Audit count by different road administration objects
Year Road administration objects
Highways Transit roads Regional roads
2011 1 0 1
2012 18 18 10
2013 2 8 12
2014 3 1 2
2015 5 7 14
2016 4 22 20
2017 11 10 5
2020/1 5(2 )
and vertical marking. The peak was in the year 2012 – problems of this category were registered 39.4% of the time and in 2017 – only 19.7%. This type of problem is of lesser importance, and the decrease could be explained by the growing experience od road designers in road sign correct usage and placement partially due to newly released regulations.
The reverse trend is observed in the problem related to pedestrians and bicyclists category. This type of problem occurrence frequency increased from 8.7% in 2012 to 26.6% in 2017. These numbers indicate the increased focus by the government on the pedestrians and non-motorized traffic safety and convenience. New measures are being implemented on city streets and roads for the most vulnerable road users, such as ramps, and warning surfaces for people with disabilities. In addition, the bike path network is growing as well as its complexity is increasing. Road designers are sometimes unable to keep up with the latest tendencies and good practice from other countries, and often make mistakes. On the other hand, road safety auditors in the latter years rapidly increase their competence in pedestrian and bicyclist safety, thus the increase in this type of problem occurrence frequency.
Figure 5 shows the occurrence frequency of each problem category at any given year for highways. It is observed in Figure 5 that the more significant problems road-safety wise, related to categories, such as alignment geometry, intersections, driving speeds, unsafe manoeuvres are less frequent in the 2017 year. For example, the alignment and profile geometry related problem frequency decreased from 5.3% at its peak 2014 year to 1.6% in 2017, the intersection related problem frequency decreased from 21.1% at its peak 2014 year to 4.7% in 2017. It means
Figure 4. The occurrence frequency of each problem category for all Road Safety Audit object types
4.0 1.3 1.1 1.1 0.9 3.6 5.3 4.0 5.1 3.7 16.5 8.9 7.2 5.7 16.0 8.7 4.2 16.5 11.6 25.2 26.6 4.0 2.9 2.6 5.5 1.4 3.2 2.3 20.0 4.9 14.8 4.4 6.6 9.2 2.0 8.0 16.8 12.7 17.6 14.3 6.7 9.1 16.0 39.4 33.3 18.7 29.2 21.1 19.7 8.0 2.7 2.1 2.2 5.5 5.3 7.1 8.0 10.3 10.1 7.7 9.1 10.6 9.6 4.0 3.8 6.9 4.4 3.7 2.3 3.8 4.0 2.9 4.2 1.1 1.8 1.4 1.1 4.0 1.1 4.2 4.4 7.0 4.3 7.6
0% 10% 20% 30% 40% 50% 60% 70% 80% 90% 100%
2011 2012 2013 2014 2015 2016 2017
Driveways Intersections Pedestrians and bicyclists
Speeds Alignment and profile geometry Road markings
Road signs and vertical marking Carriageway geometry Traffic safety measures
Unrecognizable roads Unsafe maneuvers Other problems
10.0 0.9 5.3 0.0 1.0 6.7 3.1 10.0 5.4 5.3 21.1 11.5 13.3 4.7 10.0 9.9 10.5 10.5 8.3 24.4 25.0 0.0 2.7 0.0 5.3 1.0 4.4 0.0 20.0 2.3 0.0 5.3 3.1 0.0 1.6 0.0 18.5 10.5 15.8 13.5 6.7 9.4 20.0 40.5 42.1 10.5 29.2 28.9 23.4 20.0 3.6 5.3 5.3 8.3 0.0 7.8 0.0 10.4 5.3 10.5 11.5 8.9 17.2 0.0 2.7 10.5 5.3 6.3 0.0 1.6 10.0 2.3 5.3 5.3 4.2 4.4 1.6 0.0 0.9 0.0 5.3 2.1 2.2 4.7
0% 10% 20% 30% 40% 50% 60% 70% 80% 90% 100%
2011 2012 2013 2014 2015 2016 2017
Driveways Intersections Pedestrians and bicyclists
Speeds Alignment and profile geometry Road markings
Road signs and vertical marking Carriageway geometry Traffic safety measures
THE BALTIC JOURNAL OF ROAD
AND BRIDGE ENGINEERING
2020/1 5(2 )
the road designers pay more attention to the critical details of any highway design project. Also, the same tendency on some less significant problems is observed as in Figure 4.
In addition, highway-level road recognizability improves each year. It means that road design solutions on highways become more unified and friendly for intuitive driving. For example, in the year 2015, 6.3% of problems were linked with unrecognisable roads, and in 2017 this number decreased to 1.6%. This improvement might be caused by increased control of every cycle of the project, thus growing competence of designers.
The trend of road recognizability problem frequency is reversed for transit roads, as shown in Figure 6. Frequency of this type of problem has increased in the later years. In 2015, 1.1% versus 6.8% in 2017. These numbers might indicate the reduced attention to less category road, meaning less time for design projects for those types of roads and less strict controlling of all project life cycle.
Figure 7 shows the occurrence frequency of each problem category at any given year for regional roads. The results are the same as with highways or transit roads with one exception – increased frequency of problems related to alignment and profile geometry throughout the years. For example, this type of problem occurred 22.3% of the time in 2016 (the year when the most audits were analysed – 20) for regional roads. In comparison, the same year the same problem occurred only 2.6% of the time for transit roads. The cause of such difference is that Lithuanian road designers when preparing an existing regional road reconstruction project must often squeeze the road into tight spaces
Figure 5. The occurrence frequency of each problem category at any given year for highways
4.0 1.3 1.1 1.1 4.0 5.1 3.7 16.5 16.0 8.7 4.2 16.5 4.0 2.9 2.6 5.5 20.0 4.9 14.8 4.4 8.0 16.8 12.7 17.6 16.0 39.4 33.3 18.7 8.0 2.7 2.1 2.2 8.0 10.3 10.1 7.7 4.0 3.8 6.9 4.4 4.0 2.9 4.2 1.1 4.0 1.1 4.2 4.4
0% 10% 20% 30% 40% 50% 60% 70% 80% 90% 100%
2011 2012 2013 2014
Driveways Intersections Pedestrians and bicyclists
Speeds Alignment and profile geometry Road markings
Road signs and vertical marking Carriageway geometry Traffic safety measures
Unrecognizable roads Unsafe maneuvers Other problems
10.0 0.9 5.3 0.0 1.0 6.7 3.1 10.0 5.4 5.3 21.1 11.5 13.3 4.7 10.0 9.9 10.5 10.5 8.3 24.4 25.0 0.0 2.7 0.0 5.3 1.0 4.4 0.0 20.0 2.3 0.0 5.3 3.1 0.0 1.6 0.0 18.5 10.5 15.8 13.5 6.7 9.4 20.0 40.5 42.1 10.5 29.2 28.9 23.4 20.0 3.6 5.3 5.3 8.3 0.0 7.8 0.0 10.4 5.3 10.5 11.5 8.9 17.2 0.0 2.7 10.5 5.3 6.3 0.0 1.6 10.0 2.3 5.3 5.3 4.2 4.4 1.6 0.0 0.9 0.0 5.3 2.1 2.2 4.7
0% 10% 20% 30% 40% 50% 60% 70% 80% 90% 100%
2011 2012 2013 2014 2015 2016 2017
Driveways Intersections Pedestrians and bicyclists
Speeds Alignment and profile geometry Road markings
Road signs and vertical marking Carriageway geometry Traffic safety measures
2020/1 5(2 )
between private land plots, what usually results in a needlessly curvy alignment or sharp corners.
As for city streets (Figure 8), it is noticeable that the problems concerning driving speeds are slightly more frequent. This relation indicates that designers tend to overlook some critical decisions concerning speed regulations in cities and measures to achieve observance of the speed limits. A very often mistake is the implementation of an overly sharp corner in some tight space without lowering the speed limit in those places. Despite the decreasing number of traffic accidents each year in Lithuania, the accident rate per 1.3 0.0 0.0 1.1 4.4 8.3 5.9 0.0 25.0 7.8 7.9 6.8 4.6 12.5 25.0 16.7 30.6 23.3 3.9 3.1 25.0 2.2 1.2 1.5 7.8 0.0 0.0 1.1 2.4 0.0 18.3 6.3 0.0 15.6 7.5 9.0 38.6 59.4 25.0 31.1 23.0 24.8 2.0 6.3 0.0 7.8 7.1 6.0 9.8 3.1 0.0 11.1 9.9 9.8 3.3 3.1 0.0 1.1 3.2 6.8 4.6 3.1 0.0 2.2 1.2 0.8 0.0 3.1 0.0 2.2 1.6 3.0
0% 10% 20% 30% 40% 50% 60% 70% 80% 90% 100%
2012 2013 2014 2015 2016 2017 0.0 3.6 1.0 0.0 2.1 3.1 2.3 0.0 3.6 4.9 8.3 5.5 5.7 8.0 20.0 14.5 0.0 0.0 6.8 12.4 26.4 6.7 1.8 3.9 8.3 2.1 5.2 1.1 20.0 9.1 21.6 12.5 15.8 22.3 4.6 13.3 9.1 11.8 8.3 11.0 5.2 8.0 13.3 30.9 27.5 29.2 34.2 19.2 28.7 0.0 1.8 1.0 0.0 0.7 3.1 6.9 13.3 14.5 13.7 16.7 11.6 11.9 4.6 6.7 3.6 6.9 12.5 4.1 2.6 2.3 0.0 1.8 4.9 0.0 0.0 1.0 2.3 6.7 5.5 2.9 4.2 6.2 8.3 4.6
0% 10% 20% 30% 40% 50% 60% 70% 80% 90% 100%
2011 2012 2013 2014 2015 2016 2017
Driveways Intersections Pedestrians and bicyclists
Speeds Alignment and profile geometry Road markings
Road signs and vertical marking Carriageway geometry Traffic safety measures
Unrecognizable roads Unsafe maneuvers Other problems
Driveways Intersections Pedestrians and bicyclists
Speeds Alignment and profile geometry Road markings
Road signs and vertical marking Carriageway geometry Traffic safety measures
Unrecognizable roads Unsafe maneuvers Other problems
Figure 7. The occurrence frequency of each problem category for regional roads
Figure 6. The occurrence frequency of each problem category for transit roads 1.3 0.0 0.0 1.1 4.4 8.3 5.9 0.0 25.0 7.8 7.9 6.8 4.6 12.5 25.0 16.7 30.6 23.3 3.9 3.1 25.0 2.2 1.2 1.5 7.8 0.0 0.0 1.1 2.4 0.0 18.3 6.3 0.0 15.6 7.5 9.0 38.6 59.4 25.0 31.1 23.0 24.8 2.0 6.3 0.0 7.8 7.1 6.0 9.8 3.1 0.0 11.1 9.9 9.8 3.3 3.1 0.0 1.1 3.2 6.8 4.6 3.1 0.0 2.2 1.2 0.8 0.0 3.1 0.0 2.2 1.6 3.0
0% 10% 20% 30% 40% 50% 60% 70% 80% 90% 100%
2012 2013 2014 2015 2016 2017 0.0 3.6 1.0 0.0 2.1 3.1 2.3 0.0 3.6 4.9 8.3 5.5 5.7 8.0 20.0 14.5 0.0 0.0 6.8 12.4 26.4 6.7 1.8 3.9 8.3 2.1 5.2 1.1 20.0 9.1 21.6 12.5 15.8 22.3 4.6 13.3 9.1 11.8 8.3 11.0 5.2 8.0 13.3 30.9 27.5 29.2 34.2 19.2 28.7 0.0 1.8 1.0 0.0 0.7 3.1 6.9 13.3 14.5 13.7 16.7 11.6 11.9 4.6 6.7 3.6 6.9 12.5 4.1 2.6 2.3 0.0 1.8 4.9 0.0 0.0 1.0 2.3 6.7 5.5 2.9 4.2 6.2 8.3 4.6
0% 10% 20% 30% 40% 50% 60% 70% 80% 90% 100%
2011 2012 2013 2014 2015 2016 2017
Driveways Intersections Pedestrians and bicyclists
Speeds Alignment and profile geometry Road markings
Road signs and vertical marking Carriageway geometry Traffic safety measures
Unrecognizable roads Unsafe maneuvers Other problems
Driveways Intersections Pedestrians and bicyclists
Speeds Alignment and profile geometry Road markings
Road signs and vertical marking Carriageway geometry Traffic safety measures
population is still one of the highest in the EU. This connection means that some problems are missed during RSA, and regulations still have a room for improvements. The possible ways to implement that could increase the deadline for RSA, educating road designers and auditors. For example, the Slovenian government has designed a training course for auditors in which they must complete to get an authorisation for assessing the impact on traffic safety in road concept design (Tollazzi & Rencelj, 2012). The training course lasts for seven days or 36 hours and takes place in the afternoon. The only exception is the day of the field training exercise. It is possible to implement similar mandatory training in Lithuania.
Conclusions
1. It was determined that an average audit contained 9.14 problems having analysed 317 Road Safety Audits, performed in the years 2011–2017. The general trend throughout the years is the growth in audits performed per year as well as problems identified in each audit. The reason for that is the growing acknowledgement of Road Safety Audit as one of the best practices to increase traffic safety, as well as the growing competence amongst auditors. 2. The most common problem in the earlier audits was related to
road signs and vertical marking. The percentage of occurrence has halved from the year 2012 to 2017. This change means that road
Figure 8. The occurrence frequency of each problem category for streets and local roads
0.0 0.0 2.3 0.0
2.6 5.3
0.0 2.8
18.2 10.5
6.1 5.3
11.8 5.6
27.3 14.0
30.6 27.0
0.0 0.0
2.3 0.9
3.1 2.7
0.0 16.7
0.0 4.4
7.7 2.1
5.9
22.2
25.0 16.2
7.1 9.3
58.8
22.2
15.9 25.3
18.4 18.0
0.0 0.0
2.3 6.6
6.6 7.2
0.0 8.3
2.3 5.7
10.2 9.6
23.5 8.3
0.0 3.5
1.5 3.7
0.0 2.8
0.0 1.7
1.5 1.0
0.0 11.1
4.5 11.4
4.6 8.8
0% 10% 20% 30% 40% 50% 60% 70% 80% 90% 100%
2012 2013 2014 2015 2016 2017
Driveways Intersections Pedestrians and bicyclists
Speeds Alignment and profile geometry Road markings
Road signs and vertical marking Carriageway geometry Traffic safety measures
2020/1 5(2 )
designers pay more attention to design signs and markings, as stated in regulations.
3. In the latter years, the most frequent problem was related to pedestrians and bicyclists. The percentage of occurrence has tripled from the year 2012 to 2017. On the one hand, in the later years, the number of bike and pedestrian path projects has noticeably increased. Consequently, the number of mistakes made in those projects has also increased. On the other hand, governments focus on vulnerable road users and steer auditors in the same direction to increase competence in pedestrian and bicyclist safety.
4. Most related problems in highway projects are more serious ones, such as alignment geometry, intersections, driving speeds, unsafe manoeuvres. Even though the percentage of occurrence of those types of problems decreased in 2017, they still have a significant impact on accident rate and more specifically on the fatal accident rate. The possible solution is for designers to have more leniency in choosing the right solutions for certain highway elements. For example, a possible solution is to choose the more expensive but safer roundabout intersection or an interchange instead of a typical four-way intersection, even though the latter takes less space.
5. Based on the data, highway recognizability increases while recognizability of transit road on the contrary – decreases. This might indicate the reduced attention to less category road, meaning less time for design projects for those types of roads and less strict control of the whole life cycle of the project. It is suggested to adequately estimate the time a designer needs to complete the specific type of project and to pay as much attention to less-category road control as possible.
6. For rural roads, one of the most common problems is alignment and profile geometry. Lithuanian road designers when preparing an existing regional road reconstruction project often must squeeze the road into tight spaces between private land plots, which usually results in a needlessly curvy alignment or sharp corners. Relevant measures should be implemented to simplify the process of designing public infrastructure at private plots to solve this problem.
and Analysis of Problems in the Implementation of Road Safety Audit in Lithuania measures to achieve observance of the speed limits. A very often
mistake is implementing an overly sharp corner in some tight spaces without lowering the speed limit in those places. The possible solution is increasing designers understanding of the right driving speeds in different types of urban areas.
REFERENCES
Budzynski, M., Jamroz, K., Kustra, W., Gaca, S., & Michalski, L. (2011a). Manual for Road Safety Auditors − Part I − Road safety impact assessment. Report for General Directorate for National Roads and Motorways.
Budzynski, M., Jamroz, K., Kustra, W., Gaca, S., & Michalski, L. (2011b). Manual for Road Safety Auditors − Part II −Road safety audit. Report for General Directorate for National Roads and Motorways.
Gaca, S., & Kiec, M. (2016). Speed management for local and regional rural roads.
Transportation Research Procedia, 14, 4170-4179.
https://doi.org/10.1016/j.trpro.2016.05.388
Huvarinen, Y., Svatkova, E., Oleshchenko, E., & Pushchina, S. (2016). Road Safety Audit. In 12th International Conference “Organization and Traffic
Safety Management in large cities“. SPbOTSIC-2016, 28–30 September 2016,
St. Petersburg, Russia
Jamroz, K., Budzyński, M., Kustra, W., Michalski, L., & Gaca, S. (2014). Tools for road infrastructure safety management–Polish experiences. Transportation
Research Procedia, 3, 730-739. https://doi.org/10.1016/j.trpro.2014.10.052
Janstrup, K. H. (2017). Road Safety Annual Report 2017. https://doi.org/10.1787/23124571
Jasiūnienė, V., Pociūtė, G., Vaitkus, A., Ratkevičiūtė, K., & Pakalnis, A. (2018). Analysis and evaluation of trapezoidal speed humps and their impact on the driver. The Baltic Journal of Road and Bridge Engineering, 13(2), 104-109. https://doi.org/10.7250/bjrbe.2018-13.404
Jovanov, D., Vollpracht, H. J., Beles, H., Popa, V., & Tolea, B. A. (2017, October). Most common road safety engineering deficiencies in South Eastern Europe as a part of safe system approach. In IOP Conference Series: Materials Science
and Engineering (Vol. 252, No. 1, p. 012021). IOP Publishing.
https://doi.org/10.1088/1757-899X/252/1/012021
Lithuanian Road Administration under the Ministry of Transport and Communications (2011b). Guidelines for the Management of Road
Infrastructure Safety (in Lithuanian)
Lithuanian Road Administration under the Ministry of Transport and Communications (2011a). Requirements to the Procedure of the Road Safety
Audit (in Lithuanian)
2020/1 5(2 )
Lithuanian Road Administration under the Ministry of Transport and Communications (2019). Statistics of Road Accidents (in Lithuanian)
Modal Highway Consultants Ltd. (2018). 10 Common Road Safety Problems. ROSEBUD Consortium (2006). Examples of assessed road safety measures-a short
handbook.
Strnad, B. (2018). Road Safety Audit and Road Safety Inspection on the TEM
network (No. ECE/TRANS/NONE/2018/4).
Tisca, I. A., Istrat, N., Dumitrescu, C. D., & Cornu, G. (2016). Issues concerning the road safety concept. Procedia Economics and Finance, 39, 441-445.
https://doi.org/10.1016/S2212-5671(16)30346-X
Tollazzi, T., & Rencelj, M. (2012). Typical deficiencies in traffic safety and irregularities of Slovenian roads. Procedia-Social and Behavioral Sciences, 53, 655-663. https://doi.org/10.1016/j.sbspro.2012.09.915
United Nations (2018). The sustainable development goals report 2018. United
Nations.