Received 18 Mar 2016|Accepted 5 Dec 2016|Published 27 Jan 2017
mTORC2 signalling regulates M2 macrophage
differentiation in response to helminth infection
and adaptive thermogenesis
R.W. Hallowell
1,*, S.L. Collins
2,*, J.M. Craig
3, Y. Zhang
4, M. Oh
5, P.B. Illei
6, Y. Chan-Li
2, C.L. Vigeland
2,
W. Mitzner
7, A.L. Scott
7, J.D. Powell
5& M.R. Horton
2Alternatively activated macrophages (M2) have an important function in innate immune responses to parasitic helminths, and emerging evidence also indicates these cells are regulators of systemic metabolism. Here we show a critical role for mTORC2 signalling in the generation of M2 macrophages. Abrogation of mTORC2 signalling in macrophages by selective conditional deletion of the adaptor molecule Rictor inhibits the generation of M2 macrophages while leaving the generation of classically activated macrophages (M1) intact. Selective deletion of Rictor in macrophages prevents M2 differentiation and clearance of a parasitic helminth infection in mice, and also abrogates the ability of mice to regulate brown fat and maintain core body temperature. Our findings define a role for mTORC2 in macrophages in integrating signals from the immune microenvironment to promote innate type 2 immunity, and also to integrate systemic metabolic and thermogenic responses.
DOI: 10.1038/ncomms14208 OPEN
M
acrophages can be defined by their activation state as classically activated macrophages (M1 macrophages) or alternatively activated macrophages (M2 macrophages). Using this heuristic convention, the generation of M1macro-phages is the result of stimulation with IFNg and
lipopolysac-charide (LPS)1 and is associated with a Th1 environment. M1
macrophages have an important function in killing intracellular
pathogens1,2 and produce IL-12, IL-6, TNF and iNOS3. On the
other hand, M2 macrophage generation results from stimulation with IL-4 (refs 4,5) or IL-13 (refs 4,6) and is associated with a Th2
environment1,4. M2 macrophages have been implicated in
fighting parasitic infections1,7 and attenuating excessive
inflammation8, while contributing to tissue remodelling and
repair2,9. Additionally, M2 macrophages have a central role in
regulating glucose tolerance and systemic metabolism10,11.
Through the release of IL-10, M2 macrophages maintain
insulin sensitivity in adipocytes12,13 and sustain adaptive
thermogenesis by inducing thermogenic gene expression in the
adipose tissue of mice exposed to cold14. Although we use
conventional M1 and M2 definitions, we also specify the context in which the macrophages are polarized and activated, as per the
latest nomenclature guidelelines15.
Evidence indicates that macrophages have phenotypic
plasti-city depending on their environment1,16 and that changes in
phenotype are accompanied by alterations in metabolism17.
mTOR (the mechanistic target of rapamycin) is a serine/ threonine kinase that belongs to the phosphatidylinositol
3-kinase-related kinase protein family18. In yeast and
mammalian cells, TOR integrates environmental cues, including growth factors and nutrient or energy availability to direct cell
growth19,20. mTOR signals via two complexes, TOR complex
1 (mTORC1) and TOR complex 2 (mTORC2), and each complex
has specific functions in cell signalling and metabolism21–24.
Studies have shown that mTOR regulates the differentiation
of T cells25,26, with mTORC1 and mTORC2 activity being
required for the differentiation of T cells into Th1/Th17 and
Th2 cells, respectively25,26.
A role for mTOR signalling in macrophage activation, differentiation and function seems equally likely. Evidence indicates that mTOR and its related pathways can regulate
the function of dendritic cells27–32, monocytes32 and
macrophages33,34. Although the selective deletion of mTORC1
signalling inhibits Th1 differentiation of T cells, the inhibition of mTORC1 in macrophages seems to enhance expression
of M1-associated cytokines32,35. The precise role of mTORC2
signalling in macrophage differentiation and function is yet to be defined. To this end, we generated mice in which the mTORC2 adaptor protein Rictor is genetically deleted in macrophages (termed Rictor LysM mice). Our data indicate a selective role for mTORC2 signalling in the generation of M2 macrophages.
Furthermore, our in vivo findings not only define a role
for mTORC2 in integrating external cues to guide macrophage M2 differentiation and function but also substantiate the critical
role of M2 macrophages in controlling thermogenesis
and maintaining core body temperature.
Results
Generation of mTOR and Rictor null macrophages. While a number of studies have used the pharmacologic inhibitor
rapamycin to examine the role of mTORC1 on M1 function36,37
(although rapamycin in high doses or for prolonged periods can also inhibit mTORC2 as well) and others have examined the consequence of hyper-active mTORC1 activity by deleting TSC1
and TSC2 on macrophage differentiation and function34,38,39, the
role of mTORC2 in regulating macrophage activation has yet to
be determined. To this end, we crossed Rictor flox mice with mice that express Cre under the control of the lysozyme (LysM-Cre) promoter. As a control, and for comparisons to delineate the unique role of mTORC2 signalling, we also crossed mTOR floxed mice with the LysM-Cre mice in order to genetically ablate both mTORC1 and mTORC2 signalling in macrophages.
First, to determine if mTOR and Rictor were efficiently genetically deleted in macrophages, bone marrow-derived macrophages (BMDM) were analysed for the synthesis of mTOR and Rictor protein using immunostained western blots. Rictor and mTOR were not detectable in lysates from the Rictor LysM and mTOR LysM macrophages, respectively (Fig. 1a,b). The selective deletion of mTOR or Rictor in macrophages did not have a substantial effect on the overall cellularity of the lungs, liver, skin or spleen (Supplementary Fig. 1a). Although the total baseline cellularity in the bone marrow of Wt LysM, mTOR LysM
and Rictor LysM mice were similar, upon in vitro culture with
MCSF1 for 7 days, there was a decrease in the yield of macrophages from the mTOR LysM bone marrow (Supple-mentary Fig. 1b). To test for possible cellular effects caused by
lysozyme expression in other cell types40, we compared the
numbers of alveolar macrophages, neutrophils, dendritic cells and interstitial macrophages in the lungs. There were no strain-associated differences in the total numbers or percentages of these
cells (Supplementary Fig. 1c). Thus, prior to any in vivo
activation, the tissue macrophages, dendritic cells and
neutrophils were equivalent in number between the Wt LysM, mTOR LysM and Rictor LysM mice.
Next, we sought to confirm the biochemical and functional consequences of deleting Rictor and mTOR in BMDM. mTORC1 activity of LPS-stimulated cells was interrogated by examining the phosphorylation status of S6 and 4-EBP1, targets of mTORC1 (Fig. 1d). mTORC2 activity was assessed in IL-4-treated cells by measuring the phosphorylation of Akt at serine 473. As a control, we measured the phosphorylation of Akt at Threonine 308, which is not mTORC2 dependent. As predicted, the deletion of mTOR significantly reduced the phosphorylation of S6, 4EBP-1 and Akt. Alternatively, the deletion of Rictor selectively mitigated Akt phosphorylation of serine 473 while the level of phosphorylation of S6 was near that of the control (Fig. 1d). In addition, we demonstrate decreased mTORC2 activation over time in the mTOR and Rictor LysM null macrophages as measured by phosphorylation of AKT-S473 as well as the downstream target of Akt activation, P-Foxo (Fig. 1e). Thus the mTOR LysM and Rictor LysM mice harbour macrophages that are selectively defective in carrying out the biochemical functions of mTORC1/mTORC2 and mTORC2, respectively.
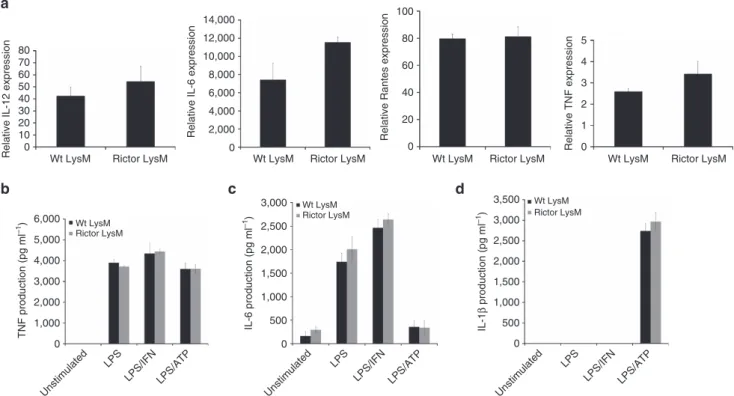
mTORC2 is not required for M1 macrophage differentiation. Pharmacologic inhibition of mTORC1 promotes the increased
expression of M1 cytokine expression36. Because it is possible that
mTORC2 was part of the mechanism that resulted in enhanced M1 activation after blocking mTORC1, we tested the role of mTORC2 activity on M1 cytokine expression. BMDM were
skewed to an M1 phenotype with LPS, LPS/IFNgor LPS/ATP and
the expression of M1 markers were measured by RT-PCR or ELISA. Rictor LysM BMDM had similar expression levels of the
M1-associated genes/markers IL-12a, IL-6, RANTES and TNF as
that observed in Wt LysM BMDM (Fig. 2a). Rictor LysM BMDM
also produced similar levels of TNF, IL-6 and IL-1bprotein as
Next we wanted to determine if mTORC2 signalling played a role in the differentiation and function of M2 macrophages. To this end, BMDM were M2 polarized with IL-4 and the expression of canonical M2 markers were measured by RT-PCR. Rictor LysM BMDM had significantly lower expression of
Ym1 (Chil3), Fizz1 (Retnla) and Arg1 (Fig. 3a) than the
M2-polarized BMDM from the control LysM mice. Consistent with these expression results, arginase enzymatic activity was significantly lower in Rictor LysM BMDM (Fig. 3b) as was the steady state levels of Arginase-1 protein (Fig. 3c). The diminished M2 activation in the Rictor LysM mice was not due to decreased expression of the IL-4 receptor, as there was no significant difference in the cell-surface expression between
Wt LysM and Rictor LysM BMDM (Fig. 3d). Additionally, we observed significantly decreased levels of expression of
Arg1, Ym1 and Mrc1 (mannose receptor 1, CD206) by mTOR
LysM BMDM indicating that M2 macrophage generation occurs in an mTOR-dependent manner (Supplementary Fig. 2.)
Next we wanted to determine the mechanism by which mTORC2 regulates M2 differentiation. Previous studies have demonstrated that the deletion of Rictor in T cells inhibits Th2
differentiation in part by mitigating STAT6 phosphorylation26.
The most studied inducer of M2 differentiation of macrophages is
IL-4-induced STAT6 phosphorylation41. Thus, we sought to
determine the effect of Rictor deletion on IL-4-mediated STAT6 phosphorylation in macrophages. BMDM were stimulated with
Wt LysM
Rictor LysM
mTOR LysM
Wt LysM Wt LysM
IL-4 IL-4
mTOR Rictor
P-AKT (S473)
P-AKT (S473) AKT1
AKT1 P-Fox01/3a
(Thr24/32) P-Fox01/3a(Thr24/32)
Fox01 Fox01
Actin Actin
0 5' 15' 30' 0 5' 15' 30' kDa 0 5' 15' 30' 0 5' 15' 30' 250
60 60
80
80
50
60
60
80
80
50 200
mTOR LysM Rictor LysM
Wt LysM
Rictor LysM
Rictor
P-AKT (Ser473) P-AKT (Thr308)
P-S6 (S240/244)
P-4EBP1 (T37/46)
4EBP1
Actin S6 AKT1 Wt
LysM Rictor LysM
mTOR LysM
1,000
800
600
400
200
0
1,000
800
600
400
200
0
1,000
800
600
400
200
0
200 400 600 800 1,000 0
100
80
60
40
20
0
100101102103104 100101102103104
% of max
100
80
60
40
20
0
% of max
100
80
60
40
20
0
% of max
100
80
60
40
20
0
% of max
100
80
60
40
20
0
% of max
100
80
60
40
20
0
% of max
SSC-H: SSC-height
SSC-H: SSC-height
SSC-H: SSC-height
Wt LysM
Rictor LysM
mTOR LysM Wt
LysM Rictor LysM
mTOR LysM Wt
LysM Rictor LysM
mTOR LysM
mTOR LysM mTOR
mTOR Actin
IL-4 LPS
Unstimulated Rictor
Actin
kDa 200 50
kDa 250 50
kDa
250
200
60
60
60
30
30
20
20
50
FSC-H: FSC-height
200 400 600 800 1,000 0
FSC-H: FSC-height
FL3-H: F4.80 PERCP FL1-H: CD11B FITC
100101102103104 100101102103104
FL3-H: F4.80 PERCP FL1-H: CD11B FITC
200 400 600 800 1,000
0 100101102103104 100101102103104
FSC-H: FSC-height FL1-H: CD11B FITC FL3-H: F4.80 PERCP
a b c
d
e
IL-4 and the phosphorylation status of STAT6 was determined by western blotting (Fig. 3d). While IL-4 strongly induced phosphorylation of STAT6 in the control LysM macrophages, deletion of Rictor resulted in a significantly decreased level of STAT6 phosphorylation, indicating that the defect observed in the M2 differentiation of Rictor LysM macrophages was due to altered IL-4R signal transduction.
In T cells, the defect in STAT6 phosphorylation was shown to coincide with increased expression of suppressor of cytokine
signalling 5 (SOCS5)26. Based on these data we sought to
determine whether SOCS family members contributed to the observed decrease in STAT6 phosphorylation in Rictor LysM macrophages. BMDM were stimulated with IL-4 and western blot analysis was performed to estimate the levels of SOCS3 (Fig. 3e), SOCS1 (Fig. 3f) and SOCS5 (Fig. 3g). The expression of SOCS3 was unchanged and equivalent between the control LysM and Rictor LysM macrophages. However, both SOCS1 and SOCS5 had significantly increased
expression in Rictor LysM macrophages, with SOCS5
being expressed regardless of stimulation with IL-4 and SOCS1 being strongly upregulated upon IL-4 stimulation. These data indicate that mTORC2 functions as an inhibitor of the synthesis of both SOCS1 and SOCS5 in macrophages,
allowing for phosphorylation of STAT6, which drives
M2 macrophage differentiation. Taken together these data suggest that mTORC2 plays a unique role in promoting M2, but not M1 macrophages.
mTORC2 signalling and the response to hookworm infection. We wanted to determine the role of mTORC2 signalling in
promoting M2-mediated immune responses in vivo. M2
macro-phages have been shown to play a critical role in host defenses
against parasitic helminths42,43 and the rodent hookworm
Nippostrongylus brasiliensis has been extensively characterized for its ability to induce a strongly polarized Th2 immune
response44 and robust generation of M2 macrophages in the
lungs during the early, tissue migratory stage of the infection. In order to analyse the role of mTORC2 signalling in the generation of M2 macrophages following primary exposure to the parasite, control LysM, mTOR LysM and Rictor LysM mice were infected
with 400 stage 3N. brasiliensis larvae (L3) and 5 days later
the lungs were harvested and RNA was analysed for M2-associated gene expression (Fig. 4a–c). The lungs from infected mTOR LysM and Rictor LysM mice displayed
significantly reduced expression of Arg1, Fizz1 and Ym1 when
compared to Wt LysM mice. Flow cytometry of whole lungs indicated similar percentages of total alveolar and interstitial macrophages after primary infection indicating that decreased levels of M2 markers were not due to decreased lung cellularity (Supplementary Fig. 3). There were no significant differences in adult worm burden in the small intestine indicating that all mice did in fact receive equivalent infections of the helminth (Fig. 4b). In addition, the magnitude and dynamics of parasite egg production was not significantly different between groups (Fig. 4c) indicating that M2 macrophages are not playing a role in blocking larval development in the lungs or in accelerating the expulsion of adult hookworms from the intestine during a primary infection. These data support an important role for TORC2 signalling in the specific generation of M2 macrophages in vivo.
M2 macrophages have been reported to be important for the resolution of inflammation and promoting repair after lung
injury45.Using measures of pulmonary function, we sought
to determine whether mTOR LysM and Rictor LysM mice had increased lung damage following primary infection. Mice were
8,000 10,000 12,000 14,000
6,000 4,000 2,000 0
5 4 3 2 1 0 80
100
60
40
20
0
Relative IL-12 expression
TNF production (pg ml
–1)
Relative IL-6 expression Relative Rantes expression
Relative TNF expression
80 70 60 50 40 30 20 10 0
Wt LysM Rictor LysM Wt LysM Rictor LysM Wt LysM Rictor LysM Wt LysM Rictor LysM
IL-6 production (pg ml
–1)
IL-1
β
production (pg ml
–1
)
Wt LysM Rictor LysM
Wt LysM Rictor LysM
Wt LysM Rictor LysM
3,000 2,500 2,000 1,500 1,000 500 0
3,000 2,500 3,500
2,000 1,500 1,000 500 0 6,000
5,000 4,000 3,000 2,000 1,000 0
Unstimulated LPS
LPS/IFN LPS/ATP
Unstimulated LPS
LPS/IFN LPS/ATP
Unstimulated LPS
LPS/IFN LPS/ATP
a
b c d
exposed to 400 infective stage L3N. brasiliensisand 21 days later their lungs were subjected to pulmonary function testing. No significant differences were observed between Wt LysM, mTOR LysM and Rictor LysM mice when comparing diffusion capacity, lung compliance or lung resistance (Supplementary Fig. 4). These data do not support a role for M2 macrophages in the resolution of lung injury following primary hookworm infection.
In secondary hookworm infection, M2 macrophages have been shown to surround and kill hookworm larvae in the
lungs, subsequently reducing the number of N. brasiliensis
larvae that reach the gut43. Based on these data, we sought to
determine whether Rictor LysM mice would be able to mount an effective secondary response to hookworm infection. In this model, adult worms are expelled from the intestines such that the mice are parasite-free by day 11. Wt LysM, mTOR LysM and Rictor LysM mice received a primary subcutaneous infection as outlined above, and then 4 weeks later were given
a secondary intravenous infection of 1000 L3 N. brasiliensis
larvae (to avoid larval trapping in the skin). Two days following secondary infection, the lungs were harvested, fixed and histology was performed. Lungs of Wt LysM mice contained numerous eosinophilic granulomas, with entrapped larvae and few free larvae (Fig. 4d). In contrast, the lungs from mTOR LysM and Rictor LysM mice contained free larvae in the airways with little evidence of granuloma formation (Fig. 4d). These data indicate that macrophage mTORC2 signalling is required for the effective M2 macrophage response associated with lung-based killing of hookworm larvae during secondary challenge.
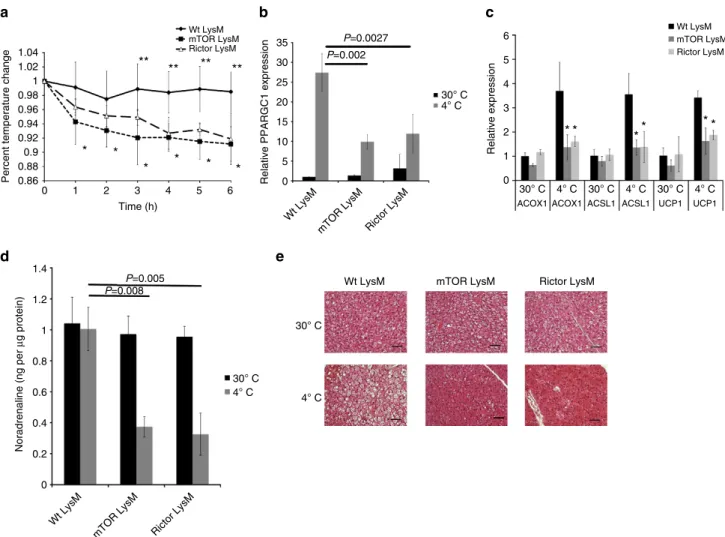
mTORC2 signalling and adaptive thermogenesis. It has become increasingly clear that immune cells play an important role
in regulating systemic metabolism46–49. Along these lines, it
has recently been demonstrated that IL-4-induced M2 activation
of macrophages is required for adaptive thermogenesis in mice14.
Exposure to cold promotes M2 macrophage differentiation that subsequently secrete catecholamines to induce thermogenic gene expression in brown adipose tissue (BAT) and lipolysis in
white adipose tissue (WAT)14. In light of our data demonstrating
defective M2 macrophage differentiation in vitro and in vivo
in the absence of Rictor, we wanted to determine if mTORC2 signalling in macrophages was required to regulate thermogenesis in vivo. To accomplish this, we analysed the expression of M2 markers on BAT- and WAT-derived macrophages in mice
housed at 30°C (thermoneutrality) or after an acute challenge
at 4°C. Consistent with previous findings, there was an increase
in the expression ofArg1 and Mrc1in both BAT and WAT of
wild type mice exposed to 4°C (Fig. 5a,b). In contrast, mTOR
LysM and Rictor LysM mice failed to demonstrate an increase in M2 activation of BAT and WAT macrophages when exposed to the cold environment, as demonstrated by the lack of expression ofArg1andMrc1. Brown fat macrophages also failed to express the M1-associated genes CD274, NOS2 and TNF, indicating that brown fat macrophages from mTOR LysM and Rictor LysM are not preferentially becoming M1 in the absence of M2 gene expression (Supplementary Fig. 5). Regardless of genotype, all mice demonstrated an increase in the percentage
of macrophages in the brown fat following 6 h at 4°C
(Supplementary Fig. 6). This increase appeared to be due to increased influx from the periphery since the expression of the
kDa Wt LysM
Wt LysM Rictor
LysM
Rictor LysM
Arginase-1
100 80 60 40 20 0
% of max
100 80 60 40 20 0
100101102103104
100101102103104
% of max
Actin 40
50
FL2-H: IL4R PE FL2-H: IL4R PE 50.9 52.2
P=0.00015 P=0.00014
10 9 8 7 6 5 4 3 2 1 0
Arginase activity (U ml
–1)
Relative ARG1 expression
600 500 400 300 200 100 0 140
120 100 80 60 40 20 0 Relative YM1 expression Relative Fizz1 expression
4,000 3,500 3,000 2,500 2,000 1,500 1,000 500 0
P=0.003 P=0.005
Rictor LysM Wt LysM
Rictor LysM Wt LysM
Rictor LysM Wt LysM
Rictor LysM Wt LysM
a b
c d
e
IL-4
Wt LysM Rictor LysM 0 3hr 6hr 0 3hr 6hr kDa
20 50 SOCS1
IL-4
Wt LysM Rictor LysM 0 1hr 2hr kDa
110 100 30 50 0 1hr 2hr
P-Stat6 (T641) Stat6 SOCS3 Actin
Actin
IL-4
Wt LysM Rictor LysM 0 1hr 2hr 0 1hr 2hr kDa
60 50 SOCS1
Actin
f g
proliferation marker Ki67 was unchanged (Supplementary Fig. 7). When we analysed the surface expression of the M2 surface markers CD301 (the C-type lection family member CLEC10A) and CD206 (mannose receptor) by flow cytometry, we observed a significant reduction in their expression on BAT- and
WAT-derived macrophages from mTOR LysM and Rictor
LysM mice exposed to 4°C (Fig. 5c,d). Overall, these
data support a role for TORC2 signalling in the generation
of M2 macrophages in vivo in response to systemic
thermo-regulatory mechanisms. P=0.002 P=0.010 25 20 15 10 5 0 Wt LysM
mTOR LysM Rictor LysM
Wt LysM
mTOR LysM Rictor LysM
Wt LysM
mTOR LysM Rictor LysM Wt LysM
mTOR LysM Rictor LysM
Wt LysM
mTOR LysM Rictor LysM
P=0.0029 P=0.0005
P=0.0002 P=0.012 25 20 15 10 5
0 Relative YM1 expression
Lung hookworms
Relative Fizz1 expression
Relative ARG1 expression
20 18 16 14 12 10 8 6 4 2 0 16 14 12 10 8 6 4 2 0
Eggs per gram of faeces
300,000 250,000 200,000 150,000 100,000 50,000 0
Adult worms/small intestine
300 250 200 150 100 50 0 Wt LysM mTOR LysM Rictor LysM Days
5 6 7 8 9 10 11
P=0.0008
P=0.0017
a
b c d
Figure 4 | mTOR and Rictor deficiency inhibit M2 macrophage responses to hookworm infection.(a) Real-time PCR analysis of markers of alternative activation in lung tissue 5 days following subcutaneous injection ofNippostrongylus brasiliensis. (b) Worm burden in small intestine 5 days following subcutaneous injection ofN. brasiliensis. (c) Average eggs per gram of protein in faeces following subcutaneous injection ofN. brasiliensis. (d) Number of cell-freeN. brasiliensislarvae in the lung 2 days following secondary infection. Error bars represent s.d. Experiments were performed three times with 10 mice per group. Significance determined by 1-way ANOVA followed by Tukey’s test.
20 P=0.004
BAT BAT WAT WAT P=0.0017 P=0.008 P=0.006 P=0.0029 P=0.0045 P=0.0021 P=0.003 30° C 4° C 30° C 4° C 30° C 4° C 30° C 4° C 30° C
4° C 30° C4° C
30° C 4° C 30° C 4° C 5 4.5 4 3.5 3 2.5 2 1.5 1 0.5 0 250 200 150 100 50 0 70 60 50 40 30 20 10 0 70 80 90 60 50 40 30 20 10 0 Relative CD206 expression Relative CD206 expression Relative ARG1 expression Relative ARG1 expression
18 16 14 12 10 8 6 4 2 0 CD301 (MFI)
CD206 (MFI) CD301 (MFI) CD206 (MFI)
120 100 80 60 40 20 0 16 14 12 10 8 6 4 2 0 14 12 10 8 6 4 2 0 WT LysM mTOR LysM Rictor LysM WT LysM mTOR LysM Rictor LysM WT LysM mTOR LysM Rictor LysM WT LysM mTOR LysM Rictor LysM WT LysM mTOR LysM Rictor LysM WT LysM mTOR LysM Rictor LysM WT LysM mTOR LysM Rictor LysM WT LysM mTOR LysM Rictor LysM P=0.007 P=0.009 P=0.010 P=0.008 P=0.003
P=0.006 P=0.0035
P=0.0019
a b
c d
To investigate the effect of defective M2 macrophage
genera-tion on cold-induced thermogenesis in intact animals,
we challenged Wt LysM, mTOR LysM and Rictor LysM
mice to 4°C. Unlike the control LysM mice, mTOR LysM and
Rictor LysM mice exhibited a drop in core body temperature
when exposed to 4°C (Fig. 6a). In addition, the mTOR LysM
and Rictor LysM mice lost significantly less weight over the 6-h cold challenge, indicating a defective thermogenic response (Supplementary Fig. 8). Wt LysM mice responded to the decrease in temperature by expressing the thermogenic genes Ppargc1aand Ucp1and the B-oxidation genes Acox1and Acsl1
in BAT (Fig. 6b,c)50,51. The induction of thermogenic genes by
BAT was significantly abrogated in mTOR LysM and Rictor LysM mice. We also observed abrogated expression of thermogenic genes by WAT from mTOR LysM and Rictor LysM animals (Supplementary Fig. 9). These data indicate that differentiation of BAT- and WAT-resident macrophages to M2 is required for the thermogenic response to cold temperatures.
It has recently been demonstrated that thermogenic gene induction is dependent upon the production of catecholamines by
BAT-resident M2 macrophages14. Therefore, we sought to
determine if the observed defect in adaptive thermogenesis by
mTOR LysM and Rictor LysM mice was due to a lack of catecholamine production by BAT-resident macrophages. After mTOR LysM, Rictor LysM and control mice were cold challenged
at 4°C for 6 h, brown fat was isolated and the concentration
of noradrenaline was measured. In contrast to the control LysM mice that showed no significant change in noradrenaline whereas the mTOR LysM and Rictor LysM mice had a significant reduction in noradrenaline content when cold challenged indicating that the defective thermogenic response in these mice may be due to insufficient catecholamine production by BAT-resident macrophages (Fig. 6d).
Catecholamines released by M2 macrophages in the WAT bind
the b-adrenergic receptor on adipocytes and induce the
expression of tyrosine hydroxylase. This induces lipolysis of WAT and results in the release of free fatty acids into the blood
stream14. Since we observed decreased catecholamine production
in both mTOR LysM and Rictor LysM mice we sought to determine if this resulted in defective lipolysis. In order
to confirm equivalent expression of the b-adrenergic receptor
on adipocytes, WAT was isolated and western blot was performed
for the b-adrenergic receptor (Supplementary Fig. 10).
b-adrenergic receptor expression was found to be present and
Relative expression
Relative PPARGC1 expression
Percent temperature change
** ** **
**
* *
* *
* * 1.04 1.02 1 0.98 0.96 0.94 0.92 0.9 0.88 0.86
Noradrenaline (ng per
μ
g protein)
1.4
1.2
1
0.8
0.6
0.4
0.2
0
Time (h)
0 1 2 3 4 5 6
35 30 25 20 15 10 5 0
6 5 4 3 2 1 0 30° C
ACOX1
4° C
30° C 4° C
30° C
4° C
30° C 4° C 30° C 4° C 30° C 4° C
ACOX1 ACSL1 ACSL1 UCP1 UCP1
* * *
* *
*
Wt LysM mTOR LysM Rictor LysM
Wt LysM mTOR LysM Rictor LysM
Wt LysM
mTOR LysM Rictor LysM
Wt LysM
mTOR LysM Rictor LysM Wt LysM
mTOR LysM Rictor LysM
P=0.0027 P=0.002
P=0.005 P=0.008
a b c
d e
Figure 6 | mTOR LysM and Rictor LysM mice have a defect in adaptive thermogenesis.(a) Core body temperature of mice during cold challenge at 4°C over 6 h. *indicates statistical significance between Wt LysM and Rictor LysM. **indicates statistical significance between Wt LysM and mTOR LysM. (b,c). Real-time PCR analysis of thermogenic genes in BAT from mice housed at 30°C or subjected to 4°C challenge for 6 h. (d) Noradrenaline content of BAT at 30°C or subjected to 4°C challenge for 6 h. (e) Representative histology (haematoxylin and eosin staining) of BAT at 30°C or subjected to 4°C challenge for 6 h, scale bars represent 50mm. Error bars represent s.d. Experiments were performed three times with eight mice per
not significantly different between Wt LysM, mTOR LysM and Rictor LysM mice. In order to examine lipolysis we exposed Wt LysM, mTOR LysM and Rictor LysM mice to 6-h
4°C challenge, isolated white fat and performed flow cytometry
for tyrosine hydroxylase (Supplementary Fig. 11a). Wt LysM mice had a significant increase in the MFI of tyrosine hydroxylase
when challenged at 4°C for 6 h; however both mTOR LysM and
Rictor LysM mice demonstrated no increase in the MFI of tyrosine hydroxylase when cold challenged. In addition, when we measured serum-free fatty acids after 6-h cold challenge mTOR LysM and Rictor LysM had significantly less serum FFAs when compared to Wt LysM following cold challenge
(Supplementary Fig. 11b). Consistent with this finding,
histology revealed that mTOR LysM and Rictor LysM mice had exhausted their lipid stores in their BAT (Fig. 6e and Supplementary Fig. 12) indicating that the observed defective adaptive thermogenesis was a direct consequence of insufficient free fatty acid mobilization due to reduced catecholamine production by WAT-resident M2 macrophages.
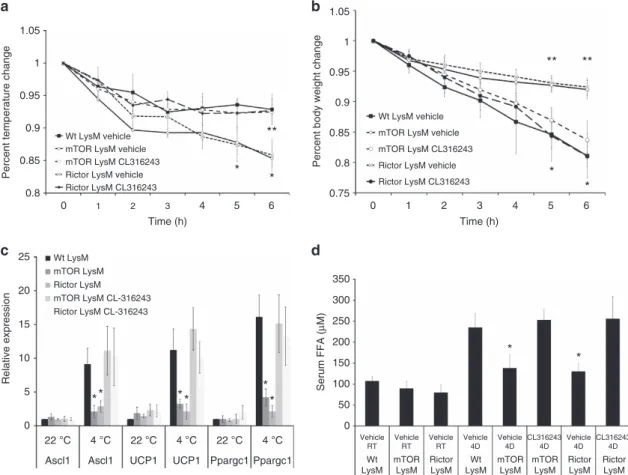
These data led us to investigate whether the b-adrenergic
receptor agonist CL-316243 could rescue the observed defect in thermogenesis in mTOR LysM and Rictor LysM mice. Mice were given a single injection of CL-316243 and 30 min later
challenged at 4°C for 6 h. mTOR LysM and Rictor LysM
mice that received CL-316243 maintained body temperature similar to Wt LysM whereas mice that received vehicle lost significantly more body temperature (Fig. 7a). In addition, mice
that received CL-316243 lost more body weight than mice that received vehicle, indicating that the thermogenic response was functional (Fig. 7b). mTOR LysM and Rictor LysM mice receiving vehicle had significantly abrogated expression of thermogenic genes in WAT; however, mice provided with CL-316243 expressed thermogenic genes to similar levels as Wt LysM mice (Fig. 7c). Treatment with CL-316243 also returned serum FFA levels to those seen in Wt LysM mice (Fig. 7d). These data indicate that the defect in thermogenesis observed in mTOR LysM and Rictor LysM mice is due to defective M2 macrophage generation that in turn abrogates the
b-adrenergic response. Overall, our data support an essential
role for mTORC2 signalling in the in vivo differentiation of
M2 macrophages and indicate that mTOR signalling is necessary for proper adaptive thermogenesis.
Discussion
Macrophages have traditionally been classified as either classically activated (M1) or alternatively activated (M2) depending upon
their stimulatory environment5,52,53. However, the precise
mechanism by which macrophages differentiate into the M1 and M2 phenotypes remains incompletely understood. We have used a novel Rictor LysM mouse model to demonstrate for the first time that mTORC2 regulates the differentiation and key functional abilities of M2 macrophages. Further, we provide evidence that mTORC2 has no demonstrable effect on
1.05
1
0.95
0.9
0.85
0.8
Wt LysM vehicle mTOR LysM vehicle mTOR LysM CL316243
Rictor LysM CL316243 Rictor LysM vehicle
Wt LysM vehicle
mTOR LysM vehicle
mTOR LysM CL316243
Rictor LysM CL316243 Rictor LysM vehicle
Time (h)
Wt LysM
Rictor LysM mTOR
LysM
mTOR LysM
mTOR LysM Wt
LysM
Rictor LysM
Rictor LysM * *
Vehicle RT
Vehicle RT
Vehicle RT
Vehicle 4D
Vehicle 4D
Vehicle 4D CL316243
4D
CL316243 4D
0 1 2 3 4 5 6
Time (h)
0 1 2 3 4 5 6
350 300 250 200 150 100 50 0
Percent temperature change
Percent body weight change
Serum FFA (
μ
M)
Wt LysM mTOR LysM
Rictor LysM mTOR LysM CL-316243 Rictor LysM CL-316243
Ppargc1 Ppargc1 UCP1 UCP1 Ascl1 Ascl1
22 °C 4 °C 22 °C 4 °C 22 °C 4 °C
*
* * *
* *
Relative expression
25
20
15
10
5
0
1.05
1
0.95
0.9
0.85
0.75 0.8
** **
* * **
* *
a b
c d
the course of M1 differentiation. Our data clearly demonstrate a critical role for mTORC2 in regulating M2 macrophage
differentiationin vitro andin vivoin response to both infection
and systemic thermogenic signals. We propose that mTORC2 integrates multiple signals from the immune microenvironment to guide this differentiation. Along these lines we demonstrate that the decrease in IL-4 mediated signalling in Rictor LysM null macrophages is associated with an increase in the inhibitors SOCS1 and SOCS5. While this represents one mechanism by which mTORC2 specifically regulates macrophage differentiation, given the multitude of signalling pathways controlled by mTOR we suspect that other mechanisms are likely involved as well. While the LysM-Cre model has been extensively employed to
examine macrophage function in vivo14,34,38, it is important to
note that LysM is also upregulated in neutrophils and dendritic cells during inflammation and we cannot exclude the possibility that deletion of mTORC2 in these cells could have had some
effect on thein vivophenotypes presented here.
Previous studies have examined the role of TSC1 in regulating macrophage differentiation and function. Deleting TSC1 in macrophages using LysM-Cre leads to hyperactive mTORC1
activity and cells that increase M1-associated cytokine
production and are refractory to IL-4-induced M2 macrophage
differentiation34. Subsequently it was demonstrated that
TSC1 inhibits M1 macrophage polarization in an mTORC1-independent fashion while promoting M2 properties in
an mTOR-dependent CCAAT/enhancer-binding protein-b
pathway38. In addition, mTORC1 signalling has been shown to
influence Ac-CoA synthesis and histone acetylation of several M2
genes54. These reports suggest that, while mTORC2 regulates M2
macrophage differentiation in vitro and in vivo, mTORC1
signalling is not completely dispensable for expression of a number of genes critical for M2 function.
There is evidence that mTOR and its related pathways regulate the production of cytokines such as IL-12 and IL-10 in dendritic
cells27–30,32, cytokine production of macrophages challenged by
Mycobacterium tuberculosis33, and differentiation of T cells26,55. T cells lacking both mTORC1 and MTORC2 activity are unable to develop into Th1, Th2 or Th17 cells; rather, they become
CD4þ T regulatory cells25. CD4þT cells lacking only mTORC1
activity are unable to become Th1 or Th17 cells; however, they
are capable of becoming Th2 cells25. T cells lacking mTORC2
activity are unable to become Th2 cells, while maintaining
their ability to develop into Th1 or Th17 cells26. We
have demonstrated that mTORC2 regulates M2 differentiation and function in a way that is analogous to its role in Th2 differentiation. By providing a gate for both Th2 (ref. 26) and M2 differentiation, mTORC2 is strategically positioned to be the primary regulator of macrophage polarization in settings where Th2-mediated inflammation is dominant such as parasitic helminth infections, allergic responses, and tissue repair
and wound healing56,57.
In addition to their role as primary effectors of the innate immune response, macrophages, and in particular, M2 macro-phages, have been shown to play an integral role in adaptive
thermogenesis14. Nguyenet al.have demonstrated that exposure
to cold results in an upregulation of BAT M2 macrophages, and that these macrophages induce the expression of thermogenic
genes within brown fat14. In their model, mice deficient in
IL-4/IL-13 signalling were unable to upregulate adipose tissue M2 macrophages and demonstrated impaired thermoregulation
during cold exposure14. Similarly, we have found that exposure to
cold induces the expression of BAT M2 macrophages, and that this expression is severely impaired in the Rictor LysM and
mTOR LysM mice and is associated with impaired
thermoregulation. The mice used in our study had no defect in
IL-4/IL-13 signalling, thus supporting the idea that adaptive thermogenesis is specifically dependent upon fully functional M2 macrophages. The observation that selectively deleting mTORC2 activity in macrophages results in such profound defects in the ability of BAT and WAT to defend their core body temperature serves to underscore the critical role of M2 macrophages and mTORC2 signalling in regulating systemic thermogenesis and as a critical component of an evolutionarily conserved environmental sensing system.
Overall our data demonstrate that mTORC2 regulates M2 macrophage differentiation and function, while being dispensable for M1 differentiation. Our data identify mTORC2 as a critical sensor that enables M2 macrophages to respond to helminth infection as well as regulated systemic metabolism. M2 macrophages play a key role in the elimination of various infections, and they have been implicated in diseases involving
the lungs1,7,58,59, heart1,60,61, central nervous system62,63, and in
the formation of atherosclerotic plaques64,65. As such our findings
have broad implications for both infectious and non-infectious disease. Indeed, by integrating environmental cues, mTORC2 signalling connects the diverse role of M2 macrophages in regulating infection and thermogenesis. As a result, various steps in the mTORC2 signalling pathway may ultimately prove to be novel therapeutic targets for altering the course of systemic disease.
Methods
Mice.All experimental procedures were approved by the Animal Care and Use Committee of Johns Hopkins University and mice were maintained in accordance with their guidelines. C57BL/6 Wt LysM mice, Rictor flox mice and mTOR flox mice were obtained from Jackson Laboratory (Bar Harbor, ME). All experiments were conducted using either 8-week-old female or male mice for a given experiment.
Generation of BMDMs.Macrophage precursors were obtained from the bone marrow of each individual mouse line and differentiated on untreated polystyrene Petri dishes (Fisher Scientific, USA) in 10 ml of Roswell Park Memorial Institute media (RPMI) supplemented with 10% FBS, 1% penicillin/streptomycin and 2 mM
L-glutamine (cell media) plus 20% L929-conditioned media containing M-CSF66. The cells were incubated at 37°C with 5% CO2. On day 4, the cell media and any
non-adherent cells were removed; adherent cells were washed with PBS before the addition of 10 ml of fresh cell media plus 20% L929 media. On day 7, macrophages were washed with PBS and then incubated with 10 ml of Cellstripper (Mediatech, Manassas, VA) for 45 min prior to gentle pipette agitation. Cell solutions were spun down and suspended in RPMIþ10% FBS, 1% penicillin/streptomycin and 2 mM
L-glutamine. For skewing, bone marrow macrophages were skewed to M1 with IFNg(500 U ml1) or to M2 with IL-4 (20 ng ml1) for 48 h.
Cell stimulation.BMDMs were plated in 24-well plates at a concentration of 1 million cells per well or in 96-well plates at a concentration of 250 K cells/well and allowed to adhere overnight in cell media. The following day, the cell media was removed and adherent cells were washed with PBS before the addition of cell media lacking FBS. Cells were then stimulated with IL-4 (20 ng ml1) (Peprotech), LPS (50 ng ml1) (Sigma) or IFNg(500 U ml1) (Sigma) for 24 h. Supernatant was collected and stored at 80 degrees for future ELISA, arginase assay and nitrite assay experiments. Cells were processed for RNA extraction as detailed below.
ELISA and arginase assays.Cytokine expression was measured via enzyme-linked immunosorbent assay (ELISA) on a Bio-Rad (Hercules, CA) plate reader and analysed with Microplate Manager III (Bio-Rad) software. ELISA kits for TNF were from eBioscience (San Diego, CA). Arginase activity in culture supernatants was measured using a QuantiChrom arginase assay kit according to the manufacturer’s specifications (DARG-200, BioAssay Systems, Hayward, CA). Serum FFA ELISA kit was purchased from Abcam (Cambridge, UK).
Thermogenesis experiments.For cold challenge experiments mice were individually housed in cages that had been pre-chilled at 4°C. Core body temperature was monitored hourly by rectal temperature probe. For thermo-neutrality experiments, mice were adapted to 30°C for 3 weeks before experi-mentation. Tissues were collected at the end of a 6-h cold challenge, and processed for RNA and norepinephrine analysis.
FACS analysis.Adipose tissues were minced and digested with collagenase I (3 mg ml1, Gibco) for 45 min at 37°C in a shaker. The digested cell suspension was centrifuged at 1,600 r.p.m. for 5 min to separate stromal-vascular fraction from adipocytes. Pelleted cells were re-suspended in FACS buffer (PBS containing 5% FBS and 1% gluatamine) and passed through a 40mm strainer to remove large cellular debris. FACS analysis was performed on a BD FACS Caliber or FACS Celesta. Antibodies used are listed in Supplementary Fig. 13. Lung FACS gating strategy is displayed in Supplementary Fig. 14.
Western blotting.Cells were plated at a concentration of 3 million cells per 6-well plate and incubated overnight in cell media without FBS. The following day, cells were stimulated with LPS or IL-4 as outlined above. Cell pellets were lysed and 20mg of lysate was fractionated by SDS-PAGE and transferred to nitrocellulose. Membranes were then blocked with 5% bovine serum albumin, washed, and incubated with primary antibodies (1:2,000) (Cell Signaling Technology, Danvers, MA) overnight at 4°C. Membranes were then washed and incubated for 1 h with anti-rabbit IgG horseradish peroxidase linked secondary antibody (1:5,000) (ECL, Buckinhamshire, UK) prior to developing with a chemiluminescent system (Amersham, Buckinhamshire, UK). Original immunoblots are shown in Supplementary Fig. 15.
Catecholamine measurement.Catecholamines (LDN Labor Diagnostika Nord GmbH & Co) were quantified in duplicate as per the manufacturer’s protocols. Tissues were homogenized in homogenization buffer (0.01 N HCL, 0.1 mm EDTA, 4 mm NA2S2O5) and cellular debris was pelleted by centrifugation. The cleared
homogenates were collected and stored at 80°C before quantification. All samples were normalized to total tissue protein concentration.
N. brasiliensisinfection.Maintenance and enumeration ofN. brasiliensiswas
performed as previously described67. Briefly, propagation ofN. brasiliensiswas performed by subcutaneous injection of mice with L3 larvae and isolation of faeces on days 7–10. Eggs ofN. brasiliensiswere cultured on granulated charcoal and sphagnum moss in order to isolate larvae. To initiate infection, mice were injected subcutaneously at the nape of the neck with 400 infective L3 stage larvae suspended in 200ml of PBS. Faeces of infected mice were isolated on days 5–11, softened in water and counted.
Diffusion factor for carbon monoxide measurement.To assess overall functional changes in the lungs following helminth-induced injury, measurement of the diffusion factor for carbon monoxide (DFCO) was performed as previously described68. Briefly, mice were anesthetized with a mixture of ketamine
(100 mg kg1)/xylazine (15 mg kg1) via intraperitoneal injection. Once sedated, a tracheostomy was performed, and an 18-gauge cannula was inserted. Lungs were quickly inflated with a 0.8 ml gas mixture (0.5% neon, 1% CO and balance air), and after a 9-s breath hold, the gas was quickly withdrawn from the lungs and diluted to 2 ml with room air. The neon and CO concentrations in the diluted air were measured by gas chromatography (INFICON, Model 3000A; Inficon Inc., East Syracuse, NY) to calculate the DFCO.
Pulmonary mechanics measurements.After DFCO assessment, mice were connected to a flexi-VentTM ventilator (Scireq, Montreal, QC, Canada) and ventilated with a tidal volume of 0.2 ml of 100% oxygen at a rate of 150 Hz with a positive end-expiratory pressure of 3 cm H2O. Mice were paralyzed with an i.p.
injection of succinylcholine (75 mg kg-1), subjected to deep inspiration at 30 cm H2O for 5 s and returned to normal ventilation for 1 min. Baseline measurements
of respiratory system resistance (Rrs), compliance (Crs) and elastance (Ers) were measured during a 2-s breath hold with a 2.5-Hz sinusoidal oscillation using the single compartment69. The impedance of the respiratory system was also obtained
using a constant phase model to provide measurements of airway resistance (Raw), tissue damping (G) and tissue elastance (H)70.
Statistical analysis.All experiments were performed in biological triplicate and results represent the mean±s.d. All experiments were replicated at least three times. Statistical analysis was performed using either 1-way ANOVA followed by Tukey’s test or a paired Student’st-test;Po0.05 was considered statistically significant.
Data availability.The data that support the findings of this study are available from the corresponding author upon request.
References
1. Fairweather, D. & Cihakova, D. Alternatively activated macrophages in infection and autoimmunity.J. Autoimmun.33,222–230 (2009). 2. Martinez, F. O., Helming, L. & Gordon, S. Alternative activation of
macrophages: an immunologic functional perspective.Annu. Rev. Immunol.
27,451–483 (2009).
3. Byers, D. E. & Holtzman, M. J. Alternatively activated macrophages as cause or effect in airway disease.Am. J. Respir. Cell. Mol. Biol.43,1–4 (2010). 4. Nair, M. G., Cochrane, D. W. & Allen, J. E. Macrophages in chronic type 2
inflammation have a novel phenotype characterized by the abundant expression ofYm1andFizz1that can be partly replicatedin vitro.Immunol. Lett.85,173–180 (2003).
5. Stein, M., Keshav, S., Harris, N. & Gordon, S. Interleukin 4 potently enhances murine macrophage mannose receptor activity: a marker of alternative immunologic macrophage activation.J. Exp. Med.176,287–292 (1992). 6. Doyle, A. G.et al.Interleukin-13 alters the activation state of murine
macrophagesin vitro: comparison with interleukin-4 and interferon-gamma.
Eur. J. Immunol.24,1441–1445 (1994).
7. Gordon, S. & Martinez, F. O. Alternative activation of macrophages: mechanism and functions.Immunity32,593–604 (2010).
8. Brombacher, F., Arendse, B., Peterson, R., Holscher, A. & Holscher, C. Analyzing classical and alternative macrophage activation in macrophage/ neutrophil-specific IL-4 receptor-alpha-deficient mice.Methods. Mol. Biol.531, 225–252 (2009).
9. Siracusa, M. C., Reece, J. J., Urban, J. F. Jr & Scott, A. L. Dynamics of lung macrophage activation in response to helminth infection.J. Leukoc. Biol.84, 1422–1433 (2008).
10. Yasui, M.et al.The prostaglandin E2 receptor EP4 regulates obesity-related inflammation and insulin sensitivity.PLoS One10,e0136304 (2015). 11. Okada, H.et al.Effect of nematodeTrichinellainfection on glucose tolerance
and status of macrophage in obese mice.Endocr. J.60,1241–1249 (2013). 12. Lumeng, C. N., Bodzin, J. L. & Saltiel, A. R. Obesity induces a phenotypic
switch in adipose tissue macrophage polarization.J. Clin. Invest.117,175–184 (2007).
13. Fujisaka, S.et al.Regulatory mechanisms for adipose tissue M1 and M2 macrophages in diet-induced obese mice.Diabetes58,2574–2582 (2009). 14. Nguyen, K. D.et al.Alternatively activated macrophages produce
catecholamines to sustain adaptive thermogenesis.Nature480,104–108 (2011). 15. Murray, P. J.et al.Macrophage activation and polarization: nomenclature and
experimental guidelines.Immunity41,14–20 (2014).
16. El Chartouni, C. & Rehli, M. Comprehensive analysis of TLR4-induced transcriptional responses in interleukin 4-primed mouse macrophages.
Immunobiology215,780–787 (2010).
17. O’Neill, L. A. & Pearce, E. J. Immunometabolism governs dendritic cell and macrophage function.J. Exp. Med.213,15–23 (2016).
18. Brown, E. J.et al.A mammalian protein targeted by G1-arresting rapamycin-receptor complex.Nature369,756–758 (1994).
19. Hay, N. & Sonenberg, N. Upstream and downstream of mTOR.Genes Dev.18, 1926–1945 (2004).
20. Kim, D. H.et al.mTOR interacts with raptor to form a nutrient-sensitive complex that signals to the cell growth machinery.Cell110,163–175 (2002). 21. Ben-Sahra, I., Hoxhaj, G., Ricoult, S. J., Asara, J. M. & Manning, B. D. mTORC1
induces purine synthesis through control of the mitochondrial tetrahydrofolate cycle.Science351,728–733 (2016).
22. Shum, M., Bellmann, K., St-Pierre, P. & Marette, A. Pharmacological inhibition of S6K1 increases glucose metabolism and Akt signallingin vitroand in diet-induced obese mice.Diabetologia59,592–603 (2016).
23. Chen, J., Holguin, N., Shi, Y., Silva, M. J. & Long, F. mTORC2 signaling promotes skeletal growth and bone formation in mice.J. Bone. Miner. Res.30, 369–378 (2015).
24. Kleinert, M.et al.Acute mTOR inhibition induces insulin resistance and alters substrate utilizationin vivo.Mol. Metab.3,630–641 (2014).
25. Delgoffe, G. M., Kole, T. P., Cotter, R. J. & Powell, J. D. Enhanced interaction between Hsp90 and raptor regulates mTOR signaling upon T cell activation.
Mol. Immunol.46,2694–2698 (2009).
26. Delgoffe, G. M.et al.The kinase mTOR regulates the differentiation of helper T cells through the selective activation of signaling by mTORC1 and mTORC2.
27. Fukao, T.et al.PI3K-mediated negative feedback regulation of IL-12 production in DCs.Nat. Immunol.3,875–881 (2002).
28. Kellersch, B. & Brocker, T. Langerhans cell homeostasis in mice is dependent on mTORC1 but not mTORC2 function.Blood121,298–307 (2013). 29. Ohtani, M.et al.Cutting edge: mTORC1 in intestinal CD11cþ CD11bþ
dendritic cells regulates intestinal homeostasis by promoting IL-10 production.
J. Immunol.188,4736–4740 (2012).
30. Ohtani, M.et al.Mammalian target of rapamycin and glycogen synthase kinase 3 differentially regulate lipopolysaccharide-induced interleukin-12 production in dendritic cells.Blood112,635–643 (2008).
31. Urbanska, M., Gozdz, A., Swiech, L. J. & Jaworski, J. Mammalian target of rapamycin complex 1 (mTORC1) and 2 (mTORC2) control the dendritic arbor morphology of hippocampal neurons.J. Biol. Chem.287,30240–30256 (2012). 32. Weichhart, T.et al.The TSC-mTOR signaling pathway regulates the innate
inflammatory response.Immunity29,565–577 (2008).
33. Yang, C. S.et al.Intracellular network of phosphatidylinositol 3-kinase, mammalian target of the rapamycin/70 kDa ribosomal S6 kinase 1, and mitogen-activated protein kinases pathways for regulating mycobacteria-induced IL-23 expression in human macrophages.Cell. Microbiol.8,1158–1171 (2006). 34. Byles, V.et al.The TSC-mTOR pathway regulates macrophage polarization.
Nat. Commun.4,2834 (2013).
35. Weichhart, T. & Saemann, M. D. The multiple facets of mTOR in immunity.
Trends. Immunol.30,218–226 (2009).
36. Mercalli, A.et al.Rapamycin unbalances the polarization of human macrophages to M1.Immunology140,179–190 (2013).
37. Lisi, L., Laudati, E., Navarra, P. & Dello Russo, C. The mTOR kinase inhibitors polarize glioma-activated microglia to express a M1 phenotype.
J. Neuroinflammation11,125 (2014).
38. Zhu, L.et al.TSC1 controls macrophage polarization to prevent inflammatory disease.Nat. Commun.5,4696 (2014).
39. Fang, C.et al.Tsc1 is a critical regulator of macrophage survival and function.
Cell. Physiol. Biochem.36,1406–1418 (2015).
40. Clausen, B. E., Burkhardt, C., Reith, W., Renkawitz, R. & Forster, I. Conditional gene targeting in macrophages and granulocytes using LysMcre mice.
Transgenic Res.8,265–277 (1999).
41. Heller, N. M.et al.Type I IL-4Rs selectively activate IRS-2 to induce target gene expression in macrophages.Sci. Signal.1,ra17 (2008).
42. Obata-Ninomiya, K.et al.The skin is an important bulwark of acquired immunity against intestinal helminths.J. Exp. Med.210,2583–2595 (2013). 43. Chen, F.et al.Neutrophils prime a long-lived effector macrophage phenotype
that mediates accelerated helminth expulsion.Nat. Immunol.15,938–946 (2014). 44. Smith, K. A.et al.Type 2 innate immunity in helminth infection is induced
redundantly and acts autonomously following CD11cþcell depletion.Infect.
Immun.80,3481–3489 (2012).
45. Duffield, J. S., Lupher, M., Thannickal, V. J. & Wynn, T. A. Host responses in tissue repair and fibrosis.Annu. Rev. Pathol.8,241–276 (2013).
46. Weisberg, S. P.et al.Obesity is associated with macrophage accumulation in adipose tissue.J. Clin. Invest.112,1796–1808 (2003).
47. Ortega Martinez de Victoria, E.et al.Macrophage content in subcutaneous adipose tissue: associations with adiposity, age, inflammatory markers, and whole-body insulin action in healthy Pima Indians.Diabetes58,385–393 (2009).
48. Elgazar-Carmon, V., Rudich, A., Hadad, N. & Levy, R. Neutrophils transiently infiltrate intra-abdominal fat early in the course of high-fat feeding.J. Lipid Res.
49,1894–1903 (2008).
49. Bertola, A.et al.Identification of adipose tissue dendritic cells correlated with obesity-associated insulin-resistance and inducing Th17 responses in mice and patients.Diabetes61,2238–2247 (2012).
50. Ellis, J. M.et al.Adipose acyl-CoA synthetase-1 directs fatty acids toward beta-oxidation and is required for cold thermogenesis.Cell Metab.12,53–64 (2010).
51. Huang, J.et al.Sustained activation of PPARalpha by endogenous ligands increases hepatic fatty acid oxidation and prevents obesity in ob/ob mice.
FASEB J.26,628–638 (2012).
52. Mackaness, G. B. Cellular resistance to infection.J. Exp. Med.116,381–406 (1962).
53. Mills, C. D., Kincaid, K., Alt, J. M., Heilman, M. J. & Hill, A. M. M-1/M-2 macrophages and the Th1/Th2 paradigm.J. Immunol.164,6166–6173 (2000). 54. Covarrubias, A. J.et al.Akt-mTORC1 signaling regulates Acly to integrate
metabolic input to control of macrophage activation.eLife5,e11612 (2016). 55. Delgoffe, G. M.et al.The mTOR kinase differentially regulates effector and
regulatory T cell lineage commitment.Immunity30,832–844 (2009). 56. Weichhart, T., Hengstschlager, M. & Linke, M. Regulation of innate immune
cell function by mTOR.Nat. Rev. Immunol.15,599–614 (2015).
57. Allen, J. E. & Wynn, T. A. Evolution of Th2 immunity: a rapid repair response to tissue destructive pathogens.PLoS Pathog.7,e1002003 (2011).
58. Prasse, A.et al.A vicious circle of alveolar macrophages and fibroblasts perpetuates pulmonary fibrosis via CCL18.Am. J. Respir. Crit. Care. Med.173, 781–792 (2006).
59. Wilson, M. S. & Wynn, T. A. Pulmonary fibrosis: pathogenesis, etiology and regulation.Mucosal Immunol.2,103–121 (2009).
60. Fairweather, D.et al.IL-12 protects against coxsackievirus B3-induced myocarditis by increasing IFN-gamma and macrophage and neutrophil populations in the heart.J. Immunol.174,261–269 (2005).
61. Nahrendorf, M.et al.The healing myocardium sequentially mobilizes two monocyte subsets with divergent and complementary functions.J. Exp. Med.
204,3037–3047 (2007).
62. Bauer, J., Ruuls, S. R., Huitinga, I. & Dijkstra, C. D. The role of macrophage subpopulations in autoimmune disease of the central nervous system.
Histochem. J.28,83–97 (1996).
63. Ponomarev, E. D., Maresz, K., Tan, Y. & Dittel, B. N. CNS-derived interleukin-4 is essential for the regulation of autoimmune inflammation and induces a state of alternative activation in microglial cells.J. Neurosci.27,10714–10721 (2007).
64. Hansson, G. K. Inflammation, atherosclerosis, and coronary artery disease.
N. Engl. J. Med.352,1685–1695 (2005).
65. Tedgui, A. & Mallat, Z. Cytokines in atherosclerosis: pathogenic and regulatory pathways.Physiol. Rev.86,515–581 (2006).
66. Davies, J. Q. & Gordon, S. Isolation and culture of murine macrophages.
Methods Mol. Biol.290,91–103 (2005).
67. Camberis, M., Le Gros, G. & Urban, J. Jr Animal model ofNippostrongylus brasiliensisandHeligmosomoides polygyrus.Curr. Protoc. Immunol55, 19.12.1–19.12.27 (2003).
68. Fallica, J., Das, S., Horton, M. & Mitzner, W. Application of carbon monoxide diffusing capacity in the mouse lung.J. Appl. Physiol. (1985)110,1455–1459 (2011).
69. Ewart, S., Levitt, R. & Mitzner, W. Respiratory system mechanics in mice measured by end-inflation occlusion.J. Appl. Physiol. (1985)79,560–566 (1995).
70. Hantos, Z., Daroczy, B., Suki, B., Nagy, S. & Fredberg, J. J. Input impedance and peripheral inhomogeneity of dog lungs.J. Appl. Physiol. (1985)72,168–178 (1992).
Acknowledgements
Funding for this manuscript was provided by NIH PO1 HL010342 (M.R.H.), NIH R21 HL111783 (M.R.H.), NIH F32 HL124823 (J.M.C.), FAMRI (MRH), and the Osborne Family Research Fund (M.R.H.).
Author contributions
The research design was performed by M.R.H., S.C.L., R.W.H., J.D.P., J.M.C., W.M. and A.L.S. The conducting of experiments were performed by S.L.C., R.W.H., Y.C.-L., Y.Z., C.L.V., M.O. and J.M.C. All data acquisition was performed by S.L.C., R.W.H., Y.C.-L., Y.Z., C.L.V., M.O., P.B.I. and J.M.C. Manuscript preparations were performed by M.R.H., S.L.C., A.L.S. and J.D.P.
Additional information
Supplementary Informationaccompanies this paper at http://www.nature.com/ naturecommunications
Competing financial interests:The authors declare no competing financial interests.
Reprints and permissioninformation is available online at http://npg.nature.com/ reprintsandpermissions/
How to cite this article:Hallowell, R. W.et al.mTORC2 signalling regulates M2 macrophage differentiation in response to helminth infection and adaptive thermogenesis.Nat. Commun.8,14208 doi: 10.1038/ncomms14208 (2017). Publisher’s note:Springer Nature remains neutral with regard to jurisdictional claims in published maps and institutional affiliations.
This work is licensed under a Creative Commons Attribution 4.0 International License. The images or other third party material in this article are included in the article’s Creative Commons license, unless indicated otherwise in the credit line; if the material is not included under the Creative Commons license, users will need to obtain permission from the license holder to reproduce the material. To view a copy of this license, visit http://creativecommons.org/licenses/by/4.0/