TECHNICALUNIVERSITY OF CLUJ-NAPOCA
ACTA TECHNICA NAPOCENSIS
Series: Applied Mathematics, Mechanics, and Engineering Vol. 61, Issue I, March, 2018
HEARING IMPAIRMENT OF HUMAN OPERATOR UNDER THE
ACTION OF NOISE POLLUTION ON THE WORKING SPACE
Mariana ARGHIR, Arabela-Adriana LUPAŞ (married LUNGU)
Abstract: The paper presents aspects of generated sound pollution what influences human operator, at workplace. It is believed that hearing damage is not dependent on age, but only professional exposure to noise. It will take into account the different ages for the industrial workers who are exposed to pollution soundtrack. Key words: noise pollution, hearing impairment, human operator, working space.
1. INTRODUCTION
The study done in this paper, is the resulting of a need for estimation the human damage to the operator's hearing, which operates in the industrial environment with is exposured to noise in the workplace professional.
Hearing damage estimation is applied through the use of international standardization in the field, who bring some improvements, because this study is looking at the effects of low frequencies, which are strongly felt in hearing for the human operator.
This paper brings their contribution to predicting hearing damage subjected to noise, for low frequencies, dangerous enough, they have not been sufficiently analyzed so far.
2. THEORETICAL CONSIDERATIONS
The level of the threshold of audibility of a population exposed to the sound pollution are considered that has two distinct components.
It notes with "H" level of audibility threshold associated with age, measured in dB, and it is the abbreviate from international standardization labeled "HTLA". This threshold represents the lower limit of the acoustic pressure level A, from which the subject can receive sounds or noises. This damage to hearing is considered as is determined only by the human
operator age and not by the least exposure to sound pollution.
Another component of hearing damage is designated with "N" (short notation for NIPTS) and represents the diplacement of the noise level produced bysound pollution, actual or potential, which is expressed in dB.
Thus, the level of the threshold of audibility [dB] associated with age and with noise, denoted "H’ - noted in a short form of HTLAN", for a population exposed to noise is calculated with a relationship regarded as empirical, but that has been proven experimentally in many circumstances. Relationhas a formand content:
(1)
The relationship can be applied only to the corresponding quantils of variables: H', H and N, in accordance with international standardization.
Observations:
1. The term "HN/120" begins to alter significantly the result if the „H + N "is greater than 40dB;
3. Approximation at the point two is considered quite accurate, although it is empirically established;
4. The last part of the relation (1) through N-HN/120 is called NIPTS, because it brings the corrections over the first two sizes.
3. AUDIBILITY THRESHOLD VARIATION PREDICTION
In order to predict the effects of noise on the hearing threshold, it is necessary to establish two databases:
A database, which is noted A from healthy persons (otologic normal), who shows no signs or symptoms of disease of the inner ear and who were not exposed to noise;
A database labeled B, from Romania, and which represents the control population, which was not exposed to noise.
3.1. Database noted A
Hearing depending on the age of a populationunexposed to noise depends on some adventitious selected factors which can be identified, but they have not professionally noise as the origin.
The database is completely provided and expressing themselves through the empirical formula (2), where a is a coefficient, which is identified according to the frequency and is differentiated by gender.
, ( 18) , ; (2)
Hearing threshold level N according to age Y (years) to quantill 0.50 as it deems the two sexes divided equally on the job, depends on the audibility of a person with 18 years of age. For practical purposes H0,50;18 the median value of the threshold of audibility for normal otologic persons same sex, aged 18 years, shall be treated as
zero.
The actual values of the threshold of audibility [dB] in the A database are reproduced in table 1.
Table 1. The threshold of audibility in the A database
Frequency [Hz] Men
Audibility level [dB] Age [years]
20 25 30 35
Quantill
0.5 0.5 0.5 0.5
125 0.012 0.147 0.432 0.867 250 0.012 0.147 0.432 0.867 500 0.014 0.172 0.504 1.012 1000 0.016 0.196 0.776 1.156 2000 0.028 0.343 1.008 2.023 3000 0.046 0.564 1.656 3.324 4000 0.064 0.784 2.304 4.624 Women
125 0.012 0.147 0.432 0.867 250 0.012 0.147 0.432 0.867 500 0.014 0.172 0.504 1.012 1000 0.016 0.196 0.576 1.156 2000 0.024 0.294 0.864 1.734 3000 0.030 0.372 1.094 2.168 4000 0.036 0.441 1.296 2.601 3.2. Database named B
The database called B is the characteristic of Romania, and it can be assumed that the component as it shows in table 2.
Table 2. The threshold of audibility in the B database
Frequency [Hz] Men
Audibility level [dB] Age [years]
20 25 30 35
Quantill
0.5 0.5 0.5 0.5
125 2 2 3 4
250 3 5 4 7
500 4 6 7 8
1000 2 5 0 3
2000 0 3 2 4
3000 6 7 9 13
4000 9 7 10 17
Women
125 1 2 3 4
250 3 3 4 6
500 3 5 6 7
1000 0 0 1 2
2000 2 4 0 2
3000 2 3 4 6
In table 2 the values of the threshold of audibility are much higher than those shown in table 1, because they are not a reference for the population.
3.3. Risk of hearing damage with age
The risk of damage to hearing is established after the rule used in the database A
when the population is adults for whom cuantila is 0.50 (meaning that each sex be represented by 50%), and for determining the actual values of the threshold of hearing, is dependent on the age of 50 years.
The results of the risk evaluation of hearing damage are centralized in table 3 for both sexes, noted HTLA.
Table 3. HTLA for 50 years
Age 50 years Quantill 0,50
Frequency [Hz]
125 250 500 1000 2000 3000 4000
Men 3.072 3.072 3.584 4.096 7.168 11.776 16.384
Women 3.072 3.072 3.584 4.096 6.144 7.680 9.216
4. CALCULATION OF THE THRESHOLD OF PERMANENT HEARING
The threshold of permanently audibility associated with the age depends on the period in which the human body is subjected to the industrial pollution, and on the sound pressure limit dependent on frequency.
The estimating formula for the threshold of audibility is empirical and is dependent on some constants obtained through experiments. The estimated values can be found in table 4. Some of these are given by the authors.
The symbol for the permanent displacement of the threshold of hearing due to exposure to street noise is NIPTS.
Table 4. Constants values of the NIPTS determination Frequency
[Hz] u v
L0
[dB]
125 -0.042 0.210 101
250 -0.025 0.160 97
500 -0.033 0.110 93
1000 -0.020 0.070 89
2000 -0.045 0.066 80
3000 +0.012 0.037 77
4000 +0.025 0.025 75
The values of threshold hearing produced by the noise, noted N (short form of his NIPTS)
is based on sound frequency, on exposure time and the level of exposure to noise on a normed work normal 8h mediated on LEX,8h exposure time θ.
For shutter speeds between 10 and 40 years NIPTS potentials median values N0,50 [dB] are given for both sexes by the relation:
, ( log( / )) ∙ , (3)
In this relationship notations are:
L0 – is the limit level of acoustic pressure defined according to the frequency in table 4;
θ – is the exposure time in years; θ0 – is the time of an year;
u and v – are the given coefficients depending of the frequencies, and they are in the tabel 4.
4.1.The permanent displacement of the hearing threshold caused by noise
Table 5. Permanent displacement of threshold caused by noise, N [dB]
Time of Noise Exposure
[Years]
The noise level on a standardised
working day, 8h LEX,8h [dB]
Frequency [Hz]
125 250 500 1000 2000 3000 4000
30 years
82 0. 0. 0. 0. 0.15 1.67 3.03
85 0. 0. 0. 0. 0.94 4.27 6.19
90 0. 0. 0. 0.08 3.77 11.26 13.93
95 0. 0. 0.52 3.00 8.48 21.60 24.77
100 0. 1.90 6.34 10.09 15.09 35.26 38.71
25 years
82 0. 0. 0. 0. 0.13 1.59 2.94
85 0. 0. 0. 0. 0.85 4.08 6.00
90 0. 0. 0. 0.08 3.40 10.77 13.49
95 0. 0. 0.48 2.80 7.65 20.65 23.95
100 0. 1.79 5.92 9.42 13.59 33.70 37.46
20 years
82 0. 0. 0. 0. 0.11 1.50 2.82
85 0. 0. 0. 0. 0.70 3.85 5.76
90 0. 0. 0. 0.07 2.79 10.43 12.95
95 0. 0. 0.44 2.56 6.28 19.50 23.10
100 0. 1.65 5.40 8.60 11.17 31.83 35.97
15 years
82 0. 0. 0. 0. 0.08 1.39 2.67
85 0. 0. 0. 0. 0.52 3.55 5.44
90 0. 0. 0. 0.06 2.09 9.38 12.24
95 0. 0. 0.38 2.24 4.69 17.99 21.76
100 0. 1.47 4.71 7.54 8.10 29.37 33.76
5. HEARING THRESHOLD LEVEL OF A
POPULATION EXPOSED TO NOISE
The threshold of audibility of men is higher than the threshold of audibility of the women, who work under the same conditions of exposure to industrial noise.
This finding is very important, that is why the study will continue to determine the threshold of audibility for men only.
It is considered a 0.5 quantill for a male population subjected to the industrial noise. It is known:
• Level of hearing threshold at the age of 20 years, 25 years, 30 years and 35 years, are presented in table 1;
• Forecast threshold of audibility for 50 years due to the age (tablelul 3);
• Level of the audibility threshold for men undergoing the industrial noise in a time of 30 years, 25 years, 20 years and 15 years, which are centralized in table 5;
• Exposure to professionally noise is done until the age of 50 years, regardless of the starting age;
Table 6. The level of the audibility threshold of a population subject to industrial noise, H’ [dB]
Time of noise exposure
[Years]
Age range
for men
The noise level on a standardised
working day, 8h LEX,8h [dB]
Frequency [Hz]
125 250 500 1000 2000 3000 4000
30 years 20 years
To 50 years
82 3.072 3.072 3.584 4.096 7.318 13.446 19.414
85 3.072 3.072 3.584 4.096 8.108 16.046 22.774
90 3.072 3.072 3.584 4.176 10.938 23.036 30.314 95 3.072 3.072 4.104 7.096 15.648 33.376 37.772 100 3.072 4.972 9.924 14.186 22.258 43.576 49.744
25 years 25 years
To 50 years
82 3.072 3.072 3.584 4.096 7.298 13.366 19.324
85 3.072 3.072 3.584 4.096 8.018 15.856 22.384
90 3.072 3.072 3.584 1.176 10.568 22.546 29.874 95 3.072 3.072 4.064 6.896 14.818 32.426 36.991 100 3.072 4.862 9.504 13.516 20.758 42.169 48.729
20 years 30 years
To 50 years
82 3.072 3.072 3.584 4.096 7.278 13.276 19.234
85 3.072 3.072 3.584 4.096 7.868 15.626 22.144
90 3.072 3.072 3.584 4.166 9.958 22.206 29.334
95 3.072 3.072 4.024 6.656 13.448 31.276 39.684 100 3.072 4.722 8.984 12.696 18.338 40.482 47.443
15 years 35 years
To 50 years
82 3.072 3.072 3.584 4.096 7.248 13.166 19.054
85 3.072 3.072 3.584 4.096 7.688 15.326 21.824
90 3.072 3.072 3.584 4.156 9.258 21.156 28.624
95 3.072 3.072 3.964 6.336 11.858 29.766 38.144 100 3.072 4.542 8.294 11.636 15.268 38.264 45.537
5.1. Interpretation of results
5.1.1. Exposure to noise with 82 dB
Fig. 1. Forecast for audibility threshold exposure to pollution soundtrack of 82 dB
From the summarizing data table will individually analyze the effect of exposure to industrial noise on different age periods.
5.1.2. Exposure to noise with 85 dB
Fig. 2. Forecast for audibility threshold exposure to pollution soundtrack of 85 dB
5.1.3. Exposure to noise with 90 dB
Sound pollution exposure of 90 dB is especially difficult for the human operator, requiring excessive auditory organ.
0 20 40 60
125 250 500 1000 2000 3000 4000
H
ea
ri
n
g
T
h
re
sh
o
ld
L
ev
el
[
d
B
]
Frequency [Hz]
Exposure to sound pollution of 82 dB
30 years 25 years 20 years 15 years
0 20 40 60
125 250 500 1000 2000 3000 4000
H
ea
ri
n
g
T
h
re
sh
o
ld
L
ev
el
[
d
B
]
Frequency [Hz]
Exposure to sound pollution of 85 dB
Fig. 3. Forecast for audibility threshold exposure to pollution soundtrack of 90 dB
5.1.4. Exposure to noise with 95 dB
Fig. 4. Forecast for audibility threshold exposure to pollution soundtrack of 95 dB
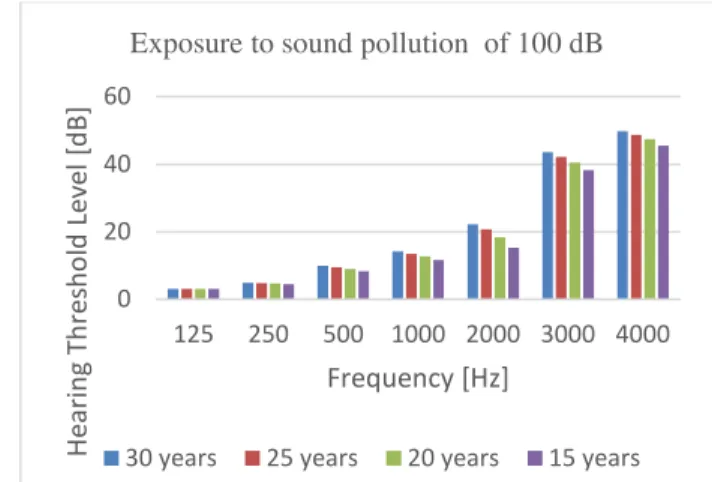
5.1.5. Exposure to noise with 100 dB
Fig. 5. Forecast for audibility threshold exposure to pollution soundtrack of 100 dB
6. CONCLUSIONS
This study estimate of damage to hearing from exposure to professional noise. It is an alarm signal for the industry, to bring out the fact that after 20 years of work hearing organ had an irreversible deteriorates, and the human operator is unrecoverable.
The sound pollution greather that at 71dB produce injury to the human opperator any time. Looking at the figures between 1 and 5 at 30 years exposure to the noise diminish the hear activity with 40 dB, and the operator can identify the sound greater this sound preassure.
7. BIBLIOGRAPHY
[1] SR ISO 1999: 2003, Determinarea expunerii la zgomot professional si estimarea deteriorarii auzului
Deteriorarea auzului operatorului uman supus la polusre sonorǎ la locul de muncǎ
Rezumat: Lucrarea prezinta aspectele generate de poluarea sonora ce actioneaza asupra operatorului uman, la locul de munca. Deteriorarea auzului se considera ca nu este dependenta de varsta, ci numai de expunerea profesionala la zgomot. Se vor lua in considerare diferite varste pentru lucratorii din mediul industrial, care sunt supusi la poluare sonora.
Mariana ARGHIR, Prof. Dr. Eng., Department of Engineering Mechanical Systems, UTCN, E-mail: [email protected], [email protected], Office Phone 0264.401.657, Cluj-Napoca, ROMANIA.
Arabela LUPAŞ (married LUNGU), DrD. Eng., Department of Engineering Mechanical Systems, UTCN, E-mail: [email protected], Mobil 0724.268.078, Cluj-Napoca, ROMANIA.
0 20 40 60
125 250 500 1000 2000 3000 4000
H
e
a
ri
n
g
T
h
re
sh
o
ld
L
e
v
e
l
[d
B
]
Frequency [Hz]
Exposure to sound pollution of 90 dB
30 years 25 years 20 years 15 years
0 20 40 60
125 250 500 1000 2000 3000 4000
H
e
a
ri
n
g
T
h
re
sh
o
ld
L
e
v
e
l
[d
B
]
Frequency [Hz]
Exposure to sound pollution of 95 dB
30 years 25 years 20 years 15 years
0 20 40 60
125 250 500 1000 2000 3000 4000
H
e
a
ri
n
g
T
h
re
sh
o
ld
L
e
v
e
l
[d
B
]
Frequency [Hz]
Exposure to sound pollution of 100 dB


![Table 5. Permanent displacement of threshold caused by noise, N [dB]](https://thumb-us.123doks.com/thumbv2/123dok_us/7998145.2120671/4.892.68.787.169.748/table-permanent-displacement-threshold-caused-noise-n-db.webp)
![Table 6. The level of the audibility threshold of a population subject to industrial noise, H’ [dB] Time of noise exposure [Years] Age range for men The noise level on a standardised working day, 8h L EX,8h [dB] Frequency [Hz] 125 250 500 1000](https://thumb-us.123doks.com/thumbv2/123dok_us/7998145.2120671/5.892.115.828.149.725/audibility-threshold-population-subject-industrial-exposure-standardised-frequency.webp)