National Endowment
for the
Arts
To Read or Not To Read
Research Report #47
November 2007
National Endowment for the Arts
1100 Pennsylvania Avenue, NW Washington, DC 20506-0001 Telephone: 202-682-5400
Produced by the Office of Research & Analysis Sunil Iyengar, Director
Staff contributors: Sarah Sullivan, Bonnie Nichols, Tom Bradshaw, and Kelli Rogowski
Special contributor: Mark Bauerlein
Editorial and publication assistance by Don Ball
Designed by Beth Schlenoff Design
Front Cover Photo: Getty Images
Printed in the United States of America
Library of Congress Cataloging-in-Publication Data
To read or not to read : a question of national consequence. p. cm. — (Research report ; #47)
“Produced by the Office of Research & Analysis, National Endowment for the Arts, Sunil Iyengar, director; editorial and publication assistance by Don Ball.”
1. Books and reading—United States. 2.
Literature—Appreciation—United States. I. Iyengar, Sunil, 1973– II. Ball, Don, 1964– III. National Endowment for the Arts. Z1003.2.T6 2007
028’.9—dc22
2007042469
202-682-5496 Voice/TTY
(a device for individuals who are deaf or hearing-impaired)
Individuals who do not use conventional print materials may contact the Arts Endowment’s Office for AccessAbility at 202-682-5532 to obtain this publication in an alternate format.
This publication is available free of charge atwww.arts.gov, the Web site of the National Endowment for the Arts.
5 Chairman’s Preface 7 Executive Summary 23 Introduction
SECTION ONE
Youth Voluntary Reading Patterns
27 Chapter One 33 Chapter Two 37 Chapter Three 46 Chapter Four
SECTION TWO
What the Declines Mean for Literacy
55 Chapter Five 63 Chapter Six 68 Chapter Seven
SECTION THREE
Why More than Reading is at Risk
77 Chapter Eight 86 Chapter Nine 94 Conclusion
To Read or Not To Read 5
T
o Read or Not To Readgathers and collates the best national data available to provide a reliable and comprehensive overview of American reading today. While it incorporates some statistics from the National Endowment for the Arts’ 2004 report,Reading at Risk,this new study contains vastly more data from numerous sources. Although most of this information is publicly available, it has never been assembled and analyzed as a whole. To our knowledge,To Read or Not To Readis the most complete and up-to-date report of the nation’s reading trends and—perhaps most important—their considerable consequences.To Read or Not To Readrelies on the most accurate data available, which consists of large, national studies conducted on a regular basis by U.S. federal agencies, sup-plemented by academic, foundation, and business surveys. Reliable national statisti-cal research is expensive and time-consuming to conduct, especially when it requires accurate measurements of various subgroups (age or education level, for example) within the overall population. Likewise, such research demands formidable resources and a commitment from an organization to collect the data consistently over many years, which is the only valid way to measure both short and long-term trends. Few organizations outside the federal government can manage such a painstaking task. By comparison, most private-sector or media surveys involve quick and isolated polls conducted with a minimal sample size.
When one assembles data from disparate sources, the results often present con-tradictions. This is not the case withTo Read or Not To Read.Here the results are startling in their consistency. All of the data combine to tell the same story about American reading.
The story the data tell is simple, consistent, and alarming. Although there has been measurable progress in recent years in reading ability at the elementary school level, all progress appears to halt as children enter their teenage years. There is a general decline in reading among teenage and adult Americans. Most alarming, both reading ability and the habit of regular reading have greatly declined among college graduates. These negative trends have more than literary importance. As this report makes clear, the declines have demonstrable social, economic, cultural, and civic implications.
How does one summarize this disturbing story? As Americans, especially younger Americans, read less, they read less well. Because they read less well, they have lower levels of academic achievement. (The shameful fact that nearly one-third of Ameri-can teenagers drop out of school is deeply connected to declining literacy and reading comprehension.) With lower levels of reading and writing ability, people do less well in the job market. Poor reading skills correlate heavily with lack of employment, lower wages, and fewer opportunities for advancement. Significantly worse reading skills are found among prisoners than in the general adult population. And deficient readers are less likely to become active in civic and cultural life, most notably in vol-unteerism and voting.
Strictly understood, the data in this report do not necessarily show cause and effect. The statistics merely indicate correlations. The habit of daily reading, for instance, overwhelmingly correlates with better reading skills and higher academic
P
achievement. On the other hand, poor reading skills correlate with lower levels of financial and job success. At the risk of being criticized by social scientists, I suggest that since all the data demonstrate consistent and mostly linear relationships between reading and these positive results—and between poor reading and negative results— reading has played a decisive factor. Whether or not people read, and indeed how much and how often they read, affects their lives in crucial ways.
All of the data suggest how powerfully reading transforms the lives of individu-als—whatever their social circumstances. Regular reading not only boosts the likeli-hood of an individual’s academic and economic success—facts that are not especially surprising—but it also seems to awaken a person’s social and civic sense. Reading correlates with almost every measurement of positive personal and social behavior surveyed. It is reassuring, though hardly amazing, that readers attend more concerts and theater than non-readers, but it is surprising that they exercise more and play more sports—no matter what their educational level. The cold statistics confirm something that most readers know but have mostly been reluctant to declare as fact— books change lives for the better.
Some people will inevitably criticizeTo Read or Not To Readas a negative report— understating the good works of schools, colleges, libraries, and publishers. Certainly, the trends reported here are negative. There is, alas, no factual case to support general growth in reading or reading comprehension in America. But there is another way of viewing this data that is hardly negative about reading.
To Read or Not To Readconfirms—without any serious qualification—the central importance of reading for a prosperous, free society. The data here demonstrate that reading is an irreplaceable activity in developing productive and active adults as well as healthy communities. Whatever the benefits of newer electronic media, they pro-vide no measurable substitute for the intellectual and personal development initiated and sustained by frequent reading.
To Read or Not To Readis not an elegy for the bygone days of print culture, but instead is a call to action—not only for parents, teachers, librarians, writers, and pub-lishers, but also for politicians, business leaders, economists, and social activists. The general decline in reading is not merely a cultural issue, though it has enormous con-sequences for literature and the other arts. It is a serious national problem. If, at the current pace, America continues to lose the habit of regular reading, the nation will suffer substantial economic, social, and civic setbacks.
As withReading at Risk,we issue this report not to dictate any specific remedial policies, but to initiate a serious discussion. It is no longer reasonable to debate whether the problem exists. It is now time to become more committed to solving it or face the consequences. The nation needs to focus more attention and resources on an activity both fundamental and irreplaceable for democracy.
Dana Gioia
To Read or Not To Read 7
I
n 2004, the National Endowment for the Arts publishedReading at Risk: A Survey of Literary Reading in America.This detailed study showed that Americans in almost every demographic group were reading fiction, poetry, and drama—and books in general—at significantly lower rates than 10 or 20 years earlier. The declines were steepest among young adults.More recent findings attest to the diminished role of voluntary reading in Ameri-can life. These new statistics come from a variety of reliable sources, including large, nationally representative studies conducted by other federal agencies. Brought together here for the first time, the data prompt three unsettling conclusions:
• Americans are spending less time reading. • Reading comprehension skills are eroding.
• These declines have serious civic, social, cultural, and economic implications.
A. A A R L
Teens and young adults read less often and for shorter amounts of time when com-pared with other age groups and with Americans of the past.
1. Young adults are reading fewer books in general.
• Nearly half of all Americans ages 18 to 24 read no books for pleasure.
• The percentage of 18- to 44-year-olds who read a book fell 7 points from 1992 to 2002.
2. Reading is declining as an activity among teenagers. • Less than one-third of 13-year-olds are daily readers.
• The percentage of 17-year-olds who read nothing at all for pleasure has
doubled over a 20-year period. Yet the amount they read for school or home-work (15 or fewer pages daily for 62% of students) has stayed the same.
E S
Percentage of Young Americans Who Read a Book Not Required for Work or School
Age group 1992 2002 Change Rate of decline
18–24 59% 52% -7 pp -12%
25–34 64% 59% -5 pp -8%
35–44 66% 59% -7 pp -11%
All adults (18 and over) 61% 57% -4 pp -7%
pp = percentage points
• Voluntary reading rates diminish from childhood to late adolescence.
3. College attendance no longer guarantees active reading habits.
• Although reading tracks closely with education level, the percentage of college graduates who read literature has declined.
• 65% of college freshmen read for pleasure for less than an hour per week or not at all.
• The percentage of non-readers among these students has nearly doubled— climbing 18 points since they graduated from high school.
Percentage of Students Reading for Fun
Age 13 Age 17
Reading frequency 1984 2004 Change 1984 2004 Change
Never or hardly ever read 8% 13% +5 pp 9% 19% +10 pp
Read almost every day 35% 30% -5 pp 31% 22% -9 pp
pp = percentage points
Source: U.S. Department of Education, National Center for Education Statistics
Percentage Who Read Almost Every Day for Fun
1984 1999 2004
9-year-olds 53% 54% 54%
13-year-olds 35% 28% 30%
17-year-olds 31% 25% 22%
Source: U.S. Department of Education, National Center for Education Statistics
Percentage Who Read a Book the Previous Day (Outside School or Work) In 2004
For at least 5 minutes For at least 30 minutes
8- to 10-year-olds 63% 40%
11- to 14-year-olds 44% 27%
15- to 18-year-olds 34% 26%
Source: The Henry J. Kaiser Family Foundation,Generation M: Media in the Lives of 8-18 Year-Olds(#7251), 2005
Percentage of Literary Readers Among College Graduates
Change Rate of decline
1982 1992 2002 1982–2002 1982–2002
82% 75% 67% -15 pp -18%
pp = percentage points
To Read or Not To Read 9
• By the time they become college seniors, one in three students read nothing at all for pleasure in a given week.
4. Teens and young adults spend less time reading than people of other age groups. • Americans between 15 and 34 years of age devote less leisure time than older
age groups to reading anything at all.
• 15- to 24-year-olds spend only 7–10 minutes per day on voluntary reading— about 60% less time than the average American.
10% 20% 30% 40% 50% 60% 70%
21%
39%
26% 26%
To
ta
l
None
Less than 1 hour
As high school seniors in 2004
As college freshmen in 2005
Reading per week: Percentage of U.S. College Freshmen Who Read Little or Nothing for Pleasure
10% 20% 30% 40% 50% 60% 70%
21%
35%
28% 28%
To
ta
l
None
Less than 1 hour
As high school seniors (mainly pre-2002)
As college seniors in 2005
Reading per week:
Percentage of U.S. College Seniors Who Read Little or Nothing for Pleasure Source: University of California, Los Angeles, Higher Education Research Institute
• By contrast, 15- to 24-year-olds spend 2 to 2½ hours per day watching TV. This activity consumes the most leisure time for men and women of all ages.
• Literary reading declined significantly in a period of rising Internet use. From 1997–2003, home Internet use soared 53 percentage points among 18- to 24-year-olds. By another estimate, the percentage of 18- to 29-year-olds with a home broadband connection climbed 25 points from 2005 to 2007.i
5. Even when reading does occur, it competes with other media. This multi-tasking suggests less focused engagement with a text.
• 58% of middle and high school students use other media while reading. • Students report using media during 35% of their weekly reading time. • 20% of their reading time is shared by TV-watching, video/computer
game-playing, instant messaging, e-mailing or Web surfing.
iU.S. Census Bureau,Computer and Internet Use in the United States,1997 and 2003, and Pew/Internet & American Life Project,Home Broadband Adoption 2007.
Percentage Using Other Media While Reading 7th-12th Graders in 2003–2004
% who use other media while reading
Most of the time 28%
Some of the time 30%
Most/some 58%
Little of the time 26%
Never 16%
Little/never 42%
Source: The Henry J. Kaiser Family Foundation,Media Multitasking Among Youth: Prevalence, Predictors and Pairings(# 7592), 2006
Average Time Spent Reading in 2006
Hours/minutes spent reading
Weekdays Weekends
and holidays
Total, 15 years and over :20 :26
15 to 24 years :07 :10
25 to 34 years :09 :11
35 to 44 years :12 :16
45 to 54 years :17 :24
55 to 64 years :30 :39
65 years and over :50 1:07
Source: U.S. Department of Labor, Bureau of Labor Statistics
Percentage of 18- to 24-Year-Olds Reading Literature
1982 1992 2002
Percentage reading literature 60% 53% 43%
Change from 1982 # -7 pp -17 pp
Rate of decline from 1982 # -12% -28%
pp = percentage points
To Read or Not To Read 11
6. American families are spending less on books than at almost any other time in the past two decades.
• Although nominal spending on books grew from 1985 to 2005, average annual household spending on books dropped 14% when adjusted for inflation.ii
• Over the same period, spending on reading materials dipped 7 percentage points as a share of average household entertainment spending.
• Amid year-to-year fluctuations, consumer book sales peaked at 1.6 billion units sold in 2000. From 2000 to 2006, however, they declined by 6%, or 100 million units.iii
• The number of books in a home is a significant predictor of academic achievement.
iiFor the purpose of this analysis, “family” or “household” is used instead of the Bureau of Labor Statistics’ technical term “con-sumer unit.” In addition to families and households, a consumer unit may describe “a person living alone or sharing a household with others or living as a roomer in a private home or lodging house or in permanent living quarters in a hotel or motel, but who is finan-cially independent.”
iiiAlbert N. Greco and Robert M. Wharton,Book Industry TRENDS 2007(New York, N.Y.: Book Industry Study Group, 2007), various pages.
$26 $28 $30 $32 $34 $36
1985 1989 1993 1997 2001 2005
Average Annual Spending on Books, by Consumer Unit Adjusted for Inflation
The Consumer Price Index, 1982–1984 (less food and energy), was used to adjust for inflation. Source: U.S. Department of Labor, Bureau of Labor Statistics
Percentage of Time Spent Reading While Using Other Media 7th- to 12th-Graders in 2003–2004
Percentage of reading time Reading while:
Watching TV 11%
Listening to music 10%
Doing homework on the computer 3%
Playing videogames 3%
Playing computer games 2%
Using the computer (other) 2%
Instant messaging 2%
E-mailing 1%
Surfing websites 1%
Using any of the above media 35%
Source: The Henry J. Kaiser Family Foundation,Media Multitasking Among Youth: Prevalence, Predictors and Pairings(# 7592), 2006
B. A A R L W
As Americans read less, their reading skills worsen, especially among teenagers and young males. By contrast, the average reading score of 9-year-olds has improved. 1. Reading scores for 17-year-olds are down.
• 17-year-old average reading scores began a slow downward trend in 1992. • For more than 30 years, this age group has failed to sustain improvements in
reading scores.
• Reading test scores for 9-year-olds—who show no declines in voluntary reading—are at an all-time high.
• The disparity in reading skills improvement between 9-year-olds and 17-year-olds may reflect broader differences in the academic and social climate of those age groups.
Average Test Scores by Number of Household Books, Grade 12 (2005–2006)
Average Average Average
science score civics score history score* Reported number of
books at home
More than 100 161 167 305
26–100 147 150 289
11–25 132 134 275
0–10 122 123 265
* Science and civics scores range from 0 to 300. History scores range from 0 to 500. Source: U.S. Department of Education, National Center for Education Statistics
10
-6 -4 -2 0 2 4 6 8
1988 1990 1992 1994 1996 1999 2004
Reported as differences from 1984 reading scores. Age 17
Age 9
Trend in Average Reading Scores for Students Ages 17 and 9
Test years occurred at irregular intervals.
To Read or Not To Read 13
2. Among high school seniors, the average score has declined for virtually all levels of reading.
• Little more than one-third of high school seniors now read proficiently.iv
• From 1992 to 2005, the average score declined for the bottom 90% of readers. Only for the very best readers of 2005, the score held steady.
• The reading gap is widening between males and females.
ivFor 12th-graders, “Proficient” corresponds with a reading score of 302 or greater (out of 500).
Average 12th-Grade Reading Scores by Gender
1992 2005
Female 297 292
Male 287 279
Male-female gap -10 -13
Source: U.S. Department of Education, National Center for Education Statistics
Change in 12th-Grade Reading Scores, by Percentile: 1992 and 2005
Percentile 1992 2005 Change
90th 333 333 0
75th 315 313 -2
50th 294 288 -6
25th 271 262 -9
10th 249 235 -14
All score changes from 1992 are statistically significant.
Source: U.S. Department of Education, National Center for Education Statistics
Percentage of 12th-Graders Reading at or Above the Proficient Level
1992 2005 Change Rate of decline
40% 35% -5 pp -13%
pp = percentage points
3. Reading proficiency rates are stagnant or declining in adults of both genders and all education levels.
• The percentage of men who read at a Proficient level has declined. For women, the share of Proficient readers has stayed the same.v
• Average reading scores have declined in adults of virtually all education levels.vi
• Even among college graduates, reading proficiency has declined at a 20%–23% rate.
4. Reading for pleasure correlates strongly with academic achievement. • Voluntary readers are better readers and writers than non-readers.
• Children and teenagers who read for pleasure on a daily or weekly basis score better on reading tests than infrequent readers.
• Frequent readers also score better on writing tests than non-readers or infrequent readers.
vFor adults, “Proficient” corre-sponds with a prose literacy score of 340 or greater (out of 500). viExceptions are adults still in high school and those with a GED or high school equivalency. In both cases, score changes from 1992 to 2003 were not statistically significant.
Percentage of Adults Proficient in Reading Prose, by Gender
1992 2003 Change Rate of decline
Female 14% 14% 0 pp 0%
Male 16% 13% -3 pp -19%
Both genders 15% 13% -2 pp -13%
pp = percentage points
Source: U.S. Department of Education, National Center for Education Statistics
Average Prose Literacy Scores of Adults, by Highest Level of Educational Attainment: 1992 and 2003
Education level: 1992 2003 Change
Less than/some high school 216 207 -9
High school graduate 268 262 -6
Vocational/trade/business school 278 268 -10
Some college 292 287 -5
Associate’s/2-year degree 306 298 -8
Bachelor’s degree 325 314 -11
Graduate study/degree 340 327 -13
Source: U.S. Department of Education, National Center for Education Statistics
Percentage of College Graduates Proficient in Reading Prose
1992 2003 Change Rate of decline
Bachelor’s degree 40% 31% -9 pp -23%
Graduate study/degree 51% 41% -10 pp -20%
pp = percentage points
To Read or Not To Read 15
Almost every day
Once or twice a week
Once or twice a month
Never or hardly ever
302
292
285
274
Almost every day
Once or twice a week
Once or twice a month
Never or hardly ever
165
154
149
136 Average Reading Scores by Frequency of Reading for Fun Grade 12 in 2005
Average Writing Scores by Frequency of Reading for Fun Grade 12 in 2002
Reading scores range from 0 to 500.
Source: U.S. Department of Education, National Center for Education Statistics
Writing scores range from 0 to 300.
C. T D R H C, S, E
I
Advanced readers accrue personal, professional, and social advantages. Deficient readers run higher risks of failure in all three areas.
1. Employers now rank reading and writing as top deficiencies in new hires. • 38% of employers find high school graduates “deficient” in reading
comprehen-sion, while 63% rate this basic skill “very important.”
• “Written communications” tops the list of applied skills found lacking in high school and college graduates alike.
• One in five U.S. workers read at a lower skill level than their job requires.vii
• Remedial writing courses are estimated to cost more than $3.1 billion for large corporate employers and $221 million for state employers.viii
viiStatistics Canada and OECD, Learning a Living: First Results of the Adult Literacy and Life Skills Survey,2005, 145.
viiiThe National Commission on Writing,Writing: A Ticket to Work…or a Ticket Out: A Survey of Business Leaders,2004, 29, and
Writing: A Powerful Message from State Government,2005, 32.
Percentage of Employers Who Rate High School Graduates as Deficient in Basic Skills
Writing in English 72%
Foreign languages 62%
Mathematics 54%
History/geography 46%
Government/economics 46%
Science 45%
Reading comprehension 38%
Humanities/arts 31%
English language 21%
Source: The Conference Board,Are They Really Ready to Work?,2006
Percentage of Employers Who Rate Job Entrants as Deficient in Applied Skills High school graduates deficient in: College graduates deficient in:
Written communication 81% Written communication 28%
Leadership 73% Leadership 24%
Professionalism/work ethic 70% Professionalism/work ethic 19% Critical thinking/problem solving 70% Creativity/innovation 17% Lifelong learning/self direction 58% Lifelong learning/self-direction 14% Source: The Conference Board,Are They Really Ready to Work?,2006
Rated Very Important by Employers
Percentage of employers who rate the following basic skills as “very important” for high school graduates:
Reading comprehension 63%
English language 62%
Writing in English 49%
Mathematics 30%
Foreign languages 11%
To Read or Not To Read 17
2. Good readers generally have more financially rewarding jobs.
• More than 60% of employed Proficient readers have jobs in management, or in the business, financial, professional, and related sectors.
• Only 18% of Basic readers are employed in those fields.
• Proficient readers are 2.5 times as likely as Basic readers to be earning $850 or more a week.
3. Less advanced readers report fewer opportunities for career growth. • 38% of Basic readers said their reading level limited their job prospects. • The percentage of Below-Basic readers who reported this experience was 1.8
times greater.
• Only 4% of Proficient readers reported this experience.
Percentage of Full-Time Workers by Weekly Earnings and Reading Level in 2003
$850–$1,149 $1,150–$1,449 $1,450–$1,949 $1,950 or more Total earning $850 or more
Proficient 20% 13% 13% 12% 58%
Basic 12% 5% 2% 4% 23%
Below Basic 7% 3% 1% 2% 13%
Source: U.S. Department of Education, National Center for Education Statistics
Percentage Employed in Management and Professional Occupations, by Reading Level in 2003
Management, business Professional Total in either job and financial and related category
Proficient 19% 42% 61%
Basic 8% 10% 18%
Below Basic 3% 4% 7%
Source: U.S. Department of Education, National Center for Education Statistics
Percentage of Adults Who Said Their Reading Skills Limited Their Job Opportunities, by Reading Level in 2003
A little Some A lot Total
Proficient 2% 1% 1% 4%
Basic 14% 15% 9% 38%
Below Basic 13% 22% 35% 70%
4. Good readers play a crucial role in enriching our cultural and civic life. • Literary readers are more than 3 times as likely as non-readers to visit
museums, attend plays or concerts, and create artworks of their own. • They are also more likely to play sports, attend sporting events, or do outdoor
activities.
• 18- to 34-year-olds, whose reading rates are the lowest for any adult age group under 65, show declines in cultural and civic participation.ix
5. Good readers make good citizens.
• Literary readers are more than twice as likely as non-readers to volunteer or do charity work.x
• Adults who read well are more likely to volunteer than Basic and Below-Basic readers.
ixNational Endowment for the Arts,The Arts and Civic Engage-ment: Involved in Arts, Involved in Life,2006.
xIbid.
Percentage of Adults Who Volunteered, by Reading Level in 2003
Less than Once a week Total who
once a week or more volunteered
Proficient 32% 25% 57%
Basic 16% 15% 31%
Below Basic 8% 10% 18%
Source: U.S. Department of Education, National Center for Education Statistics Percentage of Literary Readers Who Volunteered in 2002
Literary readers Non-readers Gap between groups
43% 16% -27 pp
pp = percentage points
Source: National Endowment for the Arts
Participation Rates for Literary Readers in 2002
Literary readers Non-readers Gap between groups
Visit art museums 43% 12% -31 pp
Attend plays or musicals 36% 10% -26 pp
Attend jazz or classical concerts 29% 9% -20 pp
Create photographs, paintings, or writings 32% 10% -22 pp
Attend sporting events 44% 27% -17 pp
Play sports 38% 24% -14 pp
Exercise 72% 40% -32 pp
Do outdoor activities 41% 22% -19 pp
pp = percentage points
To Read or Not To Read 19
• 84% of Proficient readers voted in the 2000 presidential election, compared with 53% of Below-Basic readers.
6. Deficient readers are far more likely than skilled readers to be high school dropouts.
• Half of America’s Below-Basic readers failed to complete high school—a percentage gain of 5 points since 1992.
• One-third of readers at the Basic level dropped out of high school.
• For high school dropouts, the average reading score is 55 points lower than for high school graduates—and the gap has grown since 1992.
• This fact is especially troubling in light of recent estimates that only 70% of high school students earn a diploma on time.xi
xiEditorial Projects in Education, Diplomas Count 2007: Ready for What? Preparing Students for College, Careers, and Life after High School,Executive Summary.
Percentage of Adults Who Voted in the 2000 Presidential Election, by 2003 Reading Level
Proficient 84%
Basic 62%
Below Basic 53%
Source: U.S. Department of Education, National Center for Education Statistics
Percentage of Adults at or Below “Basic” Prose Reading Level Who Did Not Complete High School: 1992, 2003
Prose reading level
Below Basic Basic
1992 2003 Change 1992 2003 Change
45% 50% +5 pp 38% 33% -5 pp
pp = percentage points
Source: U.S. Department of Education, National Center for Education Statistics
Average Prose Reading Scores for Adult High School Graduates and Those Who Did Not Complete High School: 1992, 2003
Prose reading score
Highest level of education 1992 2003 Change
Less than/some high school 216 207 -9
High school graduate 268 262 -6
Gap between groups -52 -55
7. Deficient readers are more likely than skilled readers to be out of the workforce. • More than half of Below-Basic readers are not in the workforce.
• 44% of Basic readers lack a full-time or part-time job—twice the percentage of Proficient readers in that category.
8. Poor reading skills are endemic in the prison population. • 56% of adult prisoners read at or below the Basic level.
• Adult prisoners have an average prose reading score of 257—18 points lower than non-prisoners.
• Only 3% of adult prisoners read at a Proficient level.
• Low reading scores persist in prisoners nearing the end of their term, when they are expected to return to family, society, and a more productive life.xii
xiiU.S. Department of Education, National Center for Education Statistics,Literacy Behind Bars: Results from the 2003 National Assessment of Adult Literacy Prison Survey,2007, 77.
Percentage of Adult Prisoners and Household Populations by 2003 Reading Level
Prose reading level Household Prison Gap
Below Basic 14% 16% *+2 pp
Basic 29% 40% +11 pp
Intermediate 44% 41% *-3 pp
Proficient 13% 3% -10 pp
* = not statistically significant pp = percentage points
Source: U.S. Department of Education, National Center for Education Statistics
Percentage of Adults Employed Full-Time or Part-Time, by 2003 Reading Level
Proficient 78%
Basic 56%
Below Basic 45%
To Read or Not To Read 21 Conclusion
Self-reported data on individual behavioral patterns, combined with national test scores from the Department of Education and other sources, suggest three distinct trends: a historical decline in voluntary reading rates among teenagers and young adults; a gradual worsening of reading skills among older teens; and declining profi-ciency in adult readers.
The Department of Education’s extensive data on voluntary reading patterns and prose reading scores yield a fourth observation: frequency of reading for pleasure correlates strongly with better test scores in reading and writing. Frequent readers are thus more likely than infrequent or non-readers to demonstrate academic achievement in those subjects.
From the diversity of data sources in this report, other themes emerge. Analyses of voluntary reading and reading ability, and the social characteristics of advanced and deficient readers, identify several discrepancies at a national level:
• Less reading for pleasure in late adolescence than in younger age groups • Declines in reading test scores among 17-year-olds and high school seniors in
contrast to younger age groups and lower grade levels
• Among high school seniors, a wider rift in the reading scores of advanced and deficient readers
• A male-female gap in reading proclivity and achievement levels
• A sharp divide in the reading skills of incarcerated adults versus non-prisoners • Greater academic, professional, and civic benefits associated with high levels of
leisure reading and reading comprehension
Longitudinal studies are needed to confirm and monitor the effects of these differ-ences over time. Future research also could explore factors such as income, ethnicity, region, and race, and how they might alter the relationship between voluntary read-ing, reading test scores, and other outcomes. Critically, further studies should weigh the relative effectiveness and costs and benefits of programs to foster lifelong reading and skills development. For instance, such research could trace the effects of elec-tronic media and “screen reading” on the development of readers in early childhood. Recent studies of American time-use and consumer expenditure patterns high-light a series of choices lurking in the question “To read or not to read?” The future of reading rests on the daily decisions Americans will continue to make when con-fronted with an expanding menu of leisure goods and activities. The import of these national findings, however, is that reading frequently is a behavior to be cultivated with the same zeal as academic achievement, financial or job performance, and global competitiveness.
Technical Note
This report presents some of the most reliable and currently available statistics on American reading rates, literacy, and reader characteristics. No attempt has been made to explore methods for reading instruction, or to delve into racial, ethnic, or income traits of voluntary readers, though age, gender, and education are discussed at various points in the analyses. The majority of the data stem from large, nationally representative studies completed after the 2004 publication of the NEA’sReading at Riskreport. Unless a footnote is provided, sources for all data in this Executive
Sum-mary are given with each accompanying chart or table. All adult reading scores and proficiency rates refer to the Department of Education’s prose literacy category.
Caution should be used in comparing results from the several studies cited in this publication, as the studies use different methodologies, survey populations, response rates, and standard errors associated with the estimates, and the studies often were designed to serve different research aims. No definite causal relationship can be made between voluntary reading and reading proficiency, or between voluntary reading, reading proficiency, and the reader characteristics noted in the report. Finally, except where book reading or literary reading rates are specifically mentioned, all references to voluntary reading are intended to cover all types of reading materials.
Office of Research & Analysis National Endowment for the Arts
To Read or Not To Read 23
I
T
he National Endowment for the Arts’ landmark report,Reading at Risk: A Survey of Literary Reading in America,grew out of a periodic survey the agency has been conducting since 1982. Co-developed with an expert team of statisticians, sociologists, and economists, the survey collected data from more than 17,000 adults, reported on every demographic group in the country, and relied on the U.S. Census Bureau for its administration. Key findings of the report occasioned considerable commentary from policy-makers, educators, librarians, journalists, scholars, and arts and cultural organizations. Those statistics included:• Only 47% of adults read a work of literature (defined as a novel, short story, play or poem) within the past year.
• That figure represented a 7-point decline in the percentage of literary readers over a 10-year period.
• Literary reading declined in both genders, across all education levels, and in virtually all age groups.
• The declines were steepest in young adults, accelerating at a greater rate than in the general population.
• Americans were not only reading literature at a reduced rate—they were read-ing fewer books generally.
The NEA had begun to outline the nation’s reading habits as early as 1989, with the publication of Research Report #22,Who Reads Literature?Based on the 1985 Survey of Public Participation in the Arts, that report found 56% of Americans reading liter-ature, a percentage that dropped 10 points by 2002. ButReading at Riskwas qualita-tively different from prior NEA reports for the public concern it raised. With its distressing snapshot of literary reading in America, the study provoked a national conversation in news media and classrooms, and among local, state, and federal agen-cies, on how to respond to the problem.
The Arts Endowment responded by partnering with another federal agency, the Institute of Museum and Library Services, and the regional arts organization Arts Midwest, to initiate the Big Read, a grassroots literary program of unprecedented scale, designed to bring together American communities in the reading and celebra-tion of great imaginative literature. By the end of 2007, nearly 200 towns and cities will have adopted the Big Read, and a national evaluation will identify the extent to which the program is helping to improve the reading rates of participants.
For a more extensive survey of American reading trends sinceReading at Risk,the Arts Endowment will collect new data on reading as part of the agency’s 2008 Survey of Public Participation in the Arts. Although findings from that study will not appear until late 2008, the agency has wanted to address several urgent questions raised by
Reading at Risk—at least those questions for which dataareavailable. For example, how does leisure reading fare in the lives of young Americans? (Only Americans 18 years of age or older were included in theReading at Riskstudy.) Also, what is the relationship between reading for pleasure and reading proficiency? Finally, why does reading matter to our nation and communities?
sources—federal, academic, nonprofit, and commercial—to draw a picture of volun-tary reading rates and literacy in American life. The vast majority of these findings arose only after the 2004 publication ofReading at Risk,and never have been col-lected in a single narrative about reading in our culture and our times.
The report consists of three parts, subdivided into a total of 9 chapters. Each chap-ter begins with its conclusion: a statement whose truth is borne by subsequent data. Each chapter also includes a background section providing context for the analysis and listing all sources.
Of all the variables that can be examined in conjunction with leisure reading and reading skills, this report is concerned chiefly with age and education level. The potential roles of race, ethnicity, income level, or learning-related and other disabil-ities have not been considered, in part because reporting of those variables is incon-sistent from study to study. Also absent is a discussion of U.S. public libraries and their part in promoting reading of all kinds. The lack of reliable national data on library circulation rates for reading materials—as separate from CDs and videotapes, for example—has informed this decision.
For the most part, footnotes have been avoided for sources already cited in a chap-ter’s background section. Unless “book-reading” is specifically mentioned, study results on voluntary reading should be taken as referencingallvarieties of leisure reading (e.g., magazines, newspapers, online reading), and not books alone. Unlike
Reading at Risk,this report is not limited to the reading primarily of literature, except where that earlier report is cited.
An all-important word of caution:None of the data on reading proficiency and the personal or social attributes of readers should be regarded as drawing a causal relationship between voluntary reading, reading skills, and other vari-ables.As we note elsewhere, the longitudinal study or randomized, controlled trial that would define those relationships is conspicuously absent. Yet the recurring asso-ciations between voluntary reading and advanced reading skills and other benefits are compelling in their own right.
The Survey of Public Participation in the Arts, with its up-to-date reporting of adult reading rates, will commence in May 2008. By then, many of the teenage groups discussed in this report, those showing the greatest declines in voluntary readingand
in proficiency, will have aged into the population eligible for the survey. One hopes their engagement with books and other reading materials will have improved by that point. Until then, like stock analysts who must watch and record every fluctuation in the market, though they cannot predict outcomes with certainty, we offer this report capturing some of the most current and reliable statistical information on reading.
Sunil Iyengar
Director, Research & Analysis National Endowment for the Arts
To Read or Not To Read 27
CHAPTER ONE
1. Young adults are reading fewer books in general. 2. Reading is declining as an activity among teenagers.
BACKGROUND
W
hen the National Endowment for the Arts released itsReading at Riskreport in 2004, one of the more widely discussed findings was that declines in literary reading were sharpest in young American adults. Twenty years earlier, 18- to 34-year-olds had been the age group most likely to read literature. The 2002 Survey of Public Participation in the Arts revealed they were now the least likely (with the exception of Americans aged 65 and older, a group whose average reading rates may have been stifled by health issues).
Each year of the survey since 1992, the Arts Endowment has asked not only about participation in literary reading, but also about the reading of books in general. Among young adults in 2002, these data show trends similar to those for literary reading rates. The book-reading rate of 18- to 24-year-olds was only 52%, significantly below the percentage of all Americans who read a book in 2002 (57%). Here, as with literary reading, 18- to 24-year-olds showed one of the steepest percentage point declines for all age groups—a 7-point drop from 1992 to 2002, representing a loss of 2.1 million potential readers.
By contrast, the group with the greatest percentage of book readers within it (61%) was 45–54 years old. Perhaps not surprisingly, this age group was the one most likely to read novels, short stories, poetry, and plays. Indeed, a central finding ofReading at Riskwas that literary reading rates declined substantially for all adult age groups
S O
Youth Voluntary Reading Patterns
Table 1A. Percentage of Adults Who Read a Book Not Required for Work or School, by Age Group
Age 1992 2002 Change
18–24 59% 52% -7 pp
25–34 64% 59% -5 pp
35–44 66% 59% -7 pp
45–54 64% 61% *-3 pp
55–64 59% 58% *-1 pp
65–74 55% 54% *-1 pp
75+ 42% 44% *+2 pp
pp = percentage points
* no statistically significant change from 1992
under 45.1This phenomenon extended to book reading of all types. See Table 1A.
Given this pattern of diminished reading in the U.S.—and the concentration of the trend in 18- to 44-year-olds’ literary and book-reading rates—it is reasonable to ask whether such declines also appear in children and teenagers. Because the Survey of Public Participation in the Arts (SPPA) is limited to U.S. adults, it cannot answer this question. Fortunately, other large-scale studies have investigated reading habits in Americans under 18. This chapter considers data from three primary sources:
• U.S. Department of Education:NAEP 2004 Trends in Academic Progress: Three Decades of Student Performance in Reading and Mathematics,2005.
• The Henry J. Kaiser Family Foundation:Generation M: Media in the Lives of 8-18 Year-Olds,(#7251), 2005.
• Higher Education Research Institute, University of California, Los Angeles:
American Freshmen: Forty-Year Trends 1966–2006,2007.
Like most of the data in this report, the results of all three studies became available afterReading at Riskwas published. Although none identify the rates specifically for literary reading among children and adolescents, the studies do report percentages of voluntary (or leisure) readers among this population.
What Education Research Tells Us About Leisure Reading
The Department of Education’s NAEP, known as “the Nation’s Report Card,” has tracked achievement test scores of elementary, middle, and high school students for a range of subjects since 1969. In addition to this “main” assessment, conducted nationally and at the state level, the NAEP provides a long-term trend assessment of 9-, 13-, and 17-year-olds in reading and mathematics. The trend assessment is based on a nationally representative sample and is conducted roughly every four years. In 2004, the most recent year of the trend assessment, 38,000 students participated in the reading component.
A discussion of reading achievement trends, as charted by NAEP, follows in Chap-ter Five of this report. For our immediate purpose, however, the NAEP long-Chap-term assessment offers valuable information about childhood and teenage reading rates. These data are made available because apart from testing students’ progress in read-ing, the assessment asked students to report contextual variables such as time spent on homework, the number of pages read for school and homework, and the amount of time spent reading for fun.2
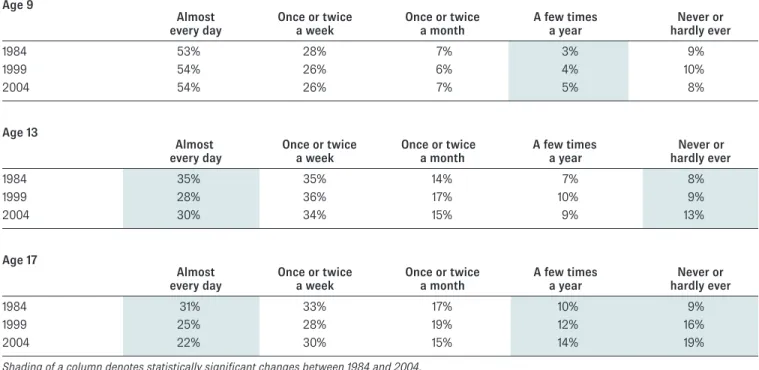
Table 1B shows the frequency of leisure reading by 9-, 13-, and 17-year-olds in three years: 1984, 1999, and 2004. Students on the lowest end of the age scale evinced not only the highest leisure reading rate for all three years—more than half of 9-year-olds reported reading “almost every day,” compared with 28%–35% of 13-year-9-year-olds and 22%–31% of 17-year-olds—but one that did not alter significantly with each test period. By 2004, 9-year-olds had the smallest percentage of non-readers (students in the “never or hardly ever” read category), and for all three years they had the smallest percentage of infrequent readers (“a few times a year”) relative to the two other age groups.
Chapter Seven describes how the consistently higher leisure reading rates in 9-year-olds correspond with improvements in their reading achievement scores. For now, 13- and 17-year-old leisure reading rates invite a closer comparison with those of the younger age group.
1NEA,Reading at Risk: A Survey of Literary Reading in America,
2004, 26–28.
2Nine-, 13- and 17-year-olds were asked “How often do you…read for fun on your own time?”
To Read or Not To Read 29
Among 1984–2004 trend data for 9-year-old reading rates, the one statistically sig-nificant finding was a growth in infrequent readers by two percentage points (from 3% in 1984 to 5% in 2004). For Americans at the early and late stages of adolescence, how-ever, statistically significant changes appeared at each extreme of the frequency band. The percentage of avid readers (“almost every day”) slumped for 13- and 17-year-olds, from 35% to 30% and from 31% to 22%, respectively. Conversely, both age groups expe-rienced a jump in the percentage of non-readers, from 8% to 13% of 13-year-olds and from 9% to 19% of 17-year-olds. The latter growth rate representsa doubling of the percentage of 17-year-olds who never or hardly ever read for fun.
The changes in leisure reading rates are disconcerting. In the two adolescent age groups, the rates have declined to such an extent that by 2004 less than one-third of 13-year-olds read for fun “almost every day.” The corresponding figure for 17-year-olds, combined with a growing percentage of non-readers in both teen groups, leads us to ask: What factors account for the relatively stable leisure reading rates among 9-year-olds?
More to the point, why are voluntary reading rates consistently higher in 9-year-olds than in 13- and 17-year-9-year-olds? It may be unwise to discount biological and social developmental factors in a child’s transition to adolescence: the teen’s growing need for peer approval; his or her bid for greater independence; the likelihood of less parental supervision; puberty itself. Still, none of these factors necessarily conflict with a voluntary reading lifestyle. Nor are they sufficient to explain the extent of the difference in reading rates.
If the low reading rates for 13- and 17-year-olds were constant over time, one might be tempted to call them characteristic of those age groups. Yet not only have teenager reading rates remained well below those of 9-year-olds; teen reading rates have diminished in the past two decades.
Table 1B. Percentage of Students Ages 9, 13, and 17, by Frequency of Reading for Fun: 1984, 1999, and 2004 Age 9
Almost Once or twice Once or twice A few times Never or
every day a week a month a year hardly ever
1984 53% 28% 7% 3% 9%
1999 54% 26% 6% 4% 10%
2004 54% 26% 7% 5% 8%
Age 13
Almost Once or twice Once or twice A few times Never or
every day a week a month a year hardly ever
1984 35% 35% 14% 7% 8%
1999 28% 36% 17% 10% 9%
2004 30% 34% 15% 9% 13%
Age 17
Almost Once or twice Once or twice A few times Never or
every day a week a month a year hardly ever
1984 31% 33% 17% 10% 9%
1999 25% 28% 19% 12% 16%
2004 22% 30% 15% 14% 19%
Shading of a column denotes statistically significant changes between 1984 and 2004. Source: U.S. Department of Education, National Center for Education Statistics
Voluntary Versus Compulsory Reading
There is another frequently voiced explanation for declines in reading from childhood to adolescence. It is sometimes argued that as children enter and progress through high school, they toil under more rigorous coursework, which, along with extracur-ricular activities, tend to sap time from leisure reading.3(As shown later in this
report, a similar view must be faced when characterizing reading trends in college students.)
The NAEP long-term trend assessment is a handy resource to consult when inves-tigating this claim. Table 1C shows the number of pages read daily by 9-, 13-, and 17-year-olds—in school or for homework—for the years 1984, 1999, and 2004. The percentages suggest that compulsory reading has increased for both 9- and 13-year-olds. From 1984 to 2004, a statistically significant drop in the percentage of 9-year-olds reading 0–10 pages a day is accompanied by a proportionate increase in the percentage reading 16 or more pages a day.
Thirteen-year-olds also experienced a 20-year decline in the percentage of students reading 0–10 pages a day for school, with corresponding increases in the 16–20 and “more than 20” pages-daily categories. This latter percentage is nearly twice as great as the 1984 level.
By comparing Table 1C with 1B, we conclude that a growth in school-related read-ing for 9-year-olds does not appear to hinder their voluntary readread-ing rate, but that for 13-year-olds, the relationship between compulsory and voluntary reading is alto-gether different. Thirteen-year-olds read more for school than in previous years, and they also read less for pleasure.
Yet this conflict is not apparent in older teens. In 17-year-olds—the group whose voluntary reading rates fared the worst—the percentage of students at all five levels of compulsory reading has remained largely constantfor the three test periods. 3The Henry J. Kaiser Family
Foundation,Generation M: Media in the Lives of 8–18-Year-Olds
(#7251), 2005, 26.
Table 1C. Percentage of Students Ages 9, 13, and 17, by Pages Read Per Day in School and for Homework: 1984, 1999, and 2004
Age 9
5 or fewer 6 to 10 11 to 15 16 to 20 More than 20
1984 36% 25% 14% 13% 13%
1999 28% 24% 15% 14% 19%
2004 25% 21% 13% 15% 25%
Age 13
5 or fewer 6 to 10 11 to 15 16 to 20 More than 20
1984 27% 34% 18% 11% 11%
1999 23% 31% 18% 13% 16%
2004 21% 26% 18% 14% 21%
Age 17
5 or fewer 6 to 10 11 to 15 16 to 20 More than 20
1984 21% 26% 18% 14% 21%
1999 23% 24% 17% 14% 22%
2004 21% 24% 17% 15% 23%
Shading of a column denotes statistically significant changes between 1984 and 2004. Source: U.S. Department of Education, National Center for Education Statistics
To Read or Not To Read 31 4Ibid.However, the percentage of 11- to 14-year-olds who read a book for at least 30 minutes the previous day does not differ signif-icantly from the percentage of 15-to 18-year-olds who did, as that sentence would appear to indicate. 5This table does not display the reported time spent reading other materials, including magazines and newspapers. For both of these media, the percentage of readers among the 11- to 14-year-old and 15- to 18-year-old groups isgreaterthan for the 8- to 10-year-old group—but only in the 5-minutes-or-more category. Forty-seven percent of 15- to 18-year-olds read a magazine for at least 5 minutes, compared with 35% and 54% of the 8–10 and 11–14 age groups, respectively. Forty-three percent of 15- to 18-year-olds read a newspaper for at least 5 minutes, compared with 21% and 35% of the 8–10 and 11–14 age groups, respectively.
For both media, there was no statistically significant difference in the percentage of 11- to 14-year-old and 15- to 18-14-year-old children who read for at least 5 minutes. Indeed, the percentage of 8- to 10-year-olds who readanyof the three media—books, maga-zines, or newspapers—for at least 5 minutes (73%) did not differ in comparison with the 11- to 14-and 15- to 18-year-old groups.
Regarding newspaper and magazine reading for at least 30 minutes the previous day, there wereno statistically significant differencesin the percentages of any of the age groups. Thus, for 8- to 10-year-olds, the percent-age who read any of the three media—books, magazines, or newspapers—for at least 30 min-utes (51%) was roughly the same as for the two older age groups. 6From trend data provided by UCLA’s Higher Education Research Institute. Indeed, by 2004, the percentage of 17-year-olds in the “more than 20 pages-a-day”
category has failed to surpass that of 9-year-olds.
This observation does not preclude the possibility that expanded school-related activities among teens are displacing time spent on leisure activities such as reading— but it does complicate that view considerably. In this study, 17-year-olds are the only age group that a) lacked growth in the percentage reading more than 15 pages daily for school or homework and b) saw no attrition of the percentage reading fewer than 11 pages daily for school or homework. At the same time, they were the only age group to experience a doubling of the percentage that never or hardly ever reads for pleasure. Without attempting to quantify reading for school or homework, another study shows a progressively lower rate of book reading for pleasure across age groups from 8 to 18 years old.
Generation M: Media in the Lives of 8–18 Year-Oldsresulted from a nationally rep-resentative survey of 2,032 third- through twelfth-grade students, supplemented by 694 seven-day media-use diaries. Although the study aimed primarily to examine students’ access to a host of traditional and electronic media, and their related use patterns, it also shed light on the reading habits of teenagers.
Generation Mreported that less than half of 8- to 18-year-olds spent at least 5 min-utes of the previous day on the leisure reading of books. Yet within that group, 63% of 8- to 10-year-olds read books for 5 minutes or more, while only 44% of 11- to 14-year-olds did so. At the later stages of adolescence, that percentage dwindled to 34%. “Indeed, with each successive increase in age, both the proportion of kids who engage in leisure book reading and the proportion who read books for at least 30 minutes decreases significantly,” the study authors conclude before tentatively ascribing those discrepancies to increased reading for school.4See Table 1D.5
If heavier course requirements were eroding the leisure reading time of high school students, one might expect the factor to be documented by large population surveys of teen experiences at home and school.
As it happens, a long-term trend analysis of high school seniors found that in 2006 only 33% of them reported spending 6 or more hours a week on homework, com-pared with 47% in 1987.6The same analysis revealed, however, thathigh school
sen-iors’ leisure reading rates have failed to improve in the last 13 yearsfor which the survey has tracked this activity. In 1994, less than 20% of seniors reported they spent no time reading for pleasure on a typical week. In 1997, that figure jumped to 25% and has lingered there ever since.
Meanwhile, the percentage reading 6 or more hours a week for pleasure has dropped by two points, representing a 17% rate of decline. Table 1E shows the per-centage of high school seniors engaged in leisure reading in 1994 and 2006 for the time amounts measured by the survey. For each year of the survey, students who read 0–2 hours a week made up a majority.
Table 1D. Percentage Who Read Books for Fun the Previous Day: 2004
8- to 18- 8- to 10- 11- to 14- 15- to 18-year-olds year-olds year-olds year-olds
Read for at least 5 minutes 46% 63% 44% 34%
Read for at least 30 minutes 30% 40% 27% *26%
* No statistically significant change from the percentage directly to the left
Chart 1F tracks year-over-year changes in the percentage of students who read 6 or more hours a week for pleasure. For the sake of comparison, a line is also given for the percentage of high school seniors who did homework for 6 or more hours a week. As illustrated by two vertical axes, both activities display a downward trend from 1994 through 2001.
Comparisons such as these do not solve the puzzle of why leisure reading rates are declining among teenagers, yet they do suggest that compulsory reading trends lack a clear and obvious relationship with voluntary reading patterns. As Chapter Two explains, relatively low reading rates persist throughout the teen’s entry into college and adulthood.
Table 1E. Percentage of High School Seniors Who Read for Pleasure, by Hours Per Week
1994 2006 Change Rate of change
None 20% 25% +5 pp +25%
Less than one hour 25% 25% 0 pp 0
1 to 2 hours 26% 25% -1 pp -4%
3 to 5 hours 17% 16% -1 pp -6%
6 or more 12% 10% -2 pp -17%
Numbers do not total 100% due to rounding. pp = percentage points
Source: University of California, Los Angeles, Higher Education Research Institute
2.0% 3.0% 4.0% 5.0%
1994 1996 1998 2000 2002 2004 2006
45% 40% 35% 30% 25% % R e a d in g fo r P le a s u re 6 o r M o re H o u rs a W e e k % W h o D id H o m e w o rk 6 o r M o re H o u rs a W e e k 5% 42% 4% 33% Chart 1F. Percentage of High School Seniors Who Read for Pleasure and/or Did Homework 6 or More Hours Per Week: 1994–2006
To Read or Not To Read 33 7U.S. Census Bureau’s 2004 Cur-rent Population Survey; Depart-ment of Education’s 2006Digest of Education Statistics(National Postsecondary Aid Study), Table 180.
CHAPTER TWO
3. College attendance no longer guarantees active reading habits.
BACKGROUND
I
n 2005, approximately 8.5 million students were enrolled as undergraduates in U.S.-based four-year colleges and universities. By partaking of higher education, those individuals were on track to join the nation’s 52 million college graduates, who account for 28% of Americans ages 25 years or older.7College attendance, although far from universal, is often depicted as a rite of pas-sage into independent adulthood. (The word “Commencement,” and the ceremonies it describes, marks the beginning of that transition.) Throughout the histories of modern universities, college learning has been portrayed as a series of classroom and out-of-classroom experiences and responses that equip the student for participation in adult life.
In “The Idea of a University” (1854), John Henry (Cardinal) Newman distinguishes between didactic learning and the behavioral framework that must be cultivated if education and not “mere extrinsic or accidental advantage” is to prevail:
[Knowledge] is an acquired illumination, it is a habit, a personal possession, and an inward endowment. And this is the reason why it is more correct, as well as more usual, to speak of a University as a place of education, than of instruction, though, when knowledge is concerned, instruction would at first sight have seemed the more appropriate word….But education is a higher word; it implies an action upon our mental nature, and the formation of character; it is some-thing individual and permanent….
Newman’s distinction between “instruction” and “education” proves helpful when we consider voluntary reading as a strategy to reinforce the skills and habits needed for lifelong learning. Three large population studies gauge the intensity of that engagement—of reading beyond the curriculum—during this formative period. They are:
• Higher Education Research Institute, University of California, Los Angeles:
Findings from the 2005 Administration of Your First College Year (YFCY) Sur-vey: National Aggregates,2007.
• Higher Education Research Institute, UCLA:Findings from the 2005 College Senior Survey (CSS): National Aggregates,2007.
• Indiana University Bloomington:National Survey of Student Engagement 2006 Institutional Report,2006.
UCLA Freshman and Senior Surveys
The first two reports stem from annual surveys conducted by UCLA’s Higher Edu-cation Research Institute (HERI), which also produced the trend analysis discussed in Chapter One(see pp. 31–32).As part of the Cooperative Institutional Research Program, a longitudinal study billed as “the nation’s oldest and largest empirical study
8See HERI website (http://www. gseis.ucla.edu/heri/heri.html). In 2006, the baseline survey obtained responses from 271,441 first-year college students at 393 U.S. col-leges and universities. 9HERI,Findings from the 2005 Your First College Year (YFCY) Survey: National Aggregates,2007, 20. Other “notable declines” arose in students’ reported time spent playing sports, exercising, partici-pating in student clubs or groups, or watching television.
of higher education,” UCLA collects baseline data each year from incoming college students.8
The baseline data can be analyzed separately or in tandem with two other annual surveys: UCLA’sYour First College Yearsurvey and theCollege Senior Survey,which poll college students approaching the end of their freshman and senior years, respec-tively. Because the three surveys yield a wealth of statistics on student life experiences from twelfth grade to college—and from the undergraduate’s first through final year—they allow us to assess reading habits at key points along the continuum.
In the annual report for the 2005Your First College Yearsurvey, researchers iden-tified “reading for pleasure” as one of several leisure activities that have sustained “notable declines” as high school students enter college and progress throughout their first year.9In the fall of 2004, 27% of incoming college freshmen reported having
read for pleasure for three or more hours per week during their senior year in high school. By the spring of 2005—when those students were set to finish their first year of college—only 15% reported that level of reading intensity. See Table 2A.
The situation does not improve as students advance through college. Although the percentage of college seniors in 2005 who did no reading for pleasure was 4 points less than that of college freshmen in the same year (35% versus 39%), a longitudinal perspective prompts a more sobering view.
Table 2B shows that the college seniors of 2005 had a greater likelihood of reading less on any given week than when they were high school seniors. Twenty-one percent of incoming college freshmen reported reading nothing for pleasure during their sen-ior year in high school, which, for the majority of students, was pre-2002. By the time that population reached senior year in college,the percentage of nonreaders had climbed by 14 points, to 35%.Moreover, only 14% of 2005 college seniors reported reading weekly for 3 hours or more. That figure marks a 10-point drop from the per-centage who read for the same amount of time as high school seniors.
Table 2A. First-Year College Students: Time Spent Reading for Pleasure Reading Percentage as high school Percentage as college
per week: seniors in 2004 freshmen in 2005 Change
None 21% 39% +18 pp
Less than 1 hour 26% 26% 0 pp
1 to 2 hours 27% 20% -7 pp
3 or more hours 27% 15% -12 pp
pp = percentage points
Source: University of California, Los Angeles, Higher Education Research Institute
Table 2B. College Seniors: Time Spent Reading for Pleasure Reading Percentage as high school Percentage as college
per week: seniors seniors in 2005 Change
None 21% 35% +14 pp
Less than 1 hour 28% 28% 0 pp
1 to 2 hours 27% 23% -4 pp
3 or more hours 24% 14% -10 pp
pp = percentage points
To Read or Not To Read 35 10See NSSE Web site: “Our Ori-gins and Potential” (http://nsse. iub.edu/html/origins.cfm). 11The corresponding item on the questionnaire is “Number of books read on your own (not assigned) for personal enjoyment or academic enrichment” during the current school year. National Survey of Student Engagement
Results from another large-scale, institutional survey tell a different story. Indiana University has polled random samples of first-year and senior college students every year since 1999, focusing its questions on “items that are known to be related to important college outcomes.”10Unlike the UCLA surveys, the National Survey of
Stu-dent Engagement (NSSE) asks about leisure reading in terms of volume of books read, not hours spent reading.
NSSE is not designed as a longitudinal study—and therefore does not track the same cohort of students as they pass through college—but the researcher can com-pare first-year and senior book-reading rates for a given year. Toward the end of their freshman year, 27% of college students reported reading zero books for pleasure or enrichment in 2007.11For outgoing college seniors, the corresponding figure is 21%.
Similarly, while only 18% of first-year college students had read five or more books during the school year, college seniors reported doing so at a rate of 25%. See Table 2C.
Despite the apparently significant gains in college senior reading rates when com-pared with students roughly four years their junior, this analysis does not report whether the same seniors read fewer or greater numbers of books than in their first year of college. Similarly, the study does not reveal whether college students experi-enced a change from their reading levels in high school. Still, if we accept that volun-tary reading habits are central to a liberal arts education, then surely it is troubling to find that the majority of freshmen and seniors alike read only 1–4 books for pleas-ure throughout the entire school year or they read no unassigned books at all.
As when reviewing reading rates of high school students, we might ask whether incrementally more challenging course requirements are stunting the growth of vol-untary reading in undergraduates. The question cannot be answered with the NSSE data alone. Still, the 2007 data show that seniors are not assigned more college texts, on average, than freshmen of the same year—see Table 2D—and that seniors, on average, do not spend more time on class preparation. Table 2E clarifies the latter point.
From these data, it still is plausible that college seniors, in aggregate, are assigned more rigorous coursework in general than first-year students, though not reflected in the amount of assigned texts. Yet this is by no means the only way to interpret the data. The NSSE results do not explain, after all, whether the students completely read every assigned text, whether the texts ranged in complexity from freshman to senior year, or whether the prescribed reading materials grew progressively more complex during the same college year.
Similarly, we lack a number for other, non-reading assignments and activities. At
Table 2C. Comparison of First-Year and Senior College Student Reading Rates in 2007 Percentage of Percentage of Gap between first-year students seniors groups
Number of unassigned None 27% 21% -6 pp
books read 1–4 55% 54% -1 pp
5 or more 18% 25% +7 pp
pp = percentage points
12See Table 2C, p. 35.
the end of this exercise, we are left with a cheerless statistic:74%–80% of college freshmen and seniors read 0–4 books on their ownduring the school year.12
We are also left with a further question: if we cannot credit school and homework assignments entirely with displacing early reading habits, then what other factors are responsible? To explore these issues, we must turn to a federal study of how Ameri-cans spend their leisure time.
Table 2E. Comparison of Time Spent on College Preparation in 2007
Percentage of Percentage of Gap between first-year students seniors groups
Preparing for class 0 hours/wk 0% 0% 0 pp
(studying, reading, 1–5 hours/wk 17% 18% +1 pp
writing, doing 6–10 hours/wk 27% 26% -1 pp
homework, etc.) 11–15 hours/wk 22% 19% -3 pp
16 hours or more/wk 34% 35% +1 pp
Numbers do not total 100% due to rounding. pp = percentage points
Source: Indiana University Bloomington, National Survey of Student Engagement Table 2D. Comparison of College-Prescribed Reading Levels in 2007
Percentage of Percentage of Gap between first-year students seniors groups
Number of assigned None 1% 1% 0 pp
textbooks, books, or Between 1–4 22% 28% +6 pp
book-length packs of Between 5–10 44% 39% -5 pp
course readings Between 11–20 24% 20% -4 pp
More than 20 10% 12% +2 pp
pp = percentage points