Sharif University of Technology
Scientia IranicaTransactions B: Mechanical Engineering www.scientiairanica.com
Evaluation of video detection system as a trac data
collection method
W. Suh
a;, J. Anderson
b, A. Guin
band M. Hunter
ba. Department of Transportation and Logistics Engineering, Hanyang University ERICA Campus, 55 Hanyangdaehak-Ro, Sangnok-Gu, Ansan, South Korea, 426-791.
b. School of Civil and Environmental Engineering, Georgia Institute of Technology, 790 Atlantic Drive, N.W. Atlanta, Georgia, 30332.
Received 22 May 2014; accepted 18 May 2015
KEYWORDS Trac data collection; Video detection system;
Trac count.
Abstract. Trac counts are one of the fundamental data sources for a variety of transportation applications ranging from assessment of current transportation system conditions to future transportation planning and forecasting. A variety of trac data collection methods have been used to provide continuous trac count coverage at selected locations to estimate annual average daily trac. This paper evaluates the performance of a Video Detection System. A video detection system was investigated under various conditions, including mounting style, height, and roadway osets. This paper conducts a lane-by-lane analysis and the results indicate that video detection system data presents reasonably accurate data, although these data exhibit more variability compared to Automatic Trac Recorder data. The paper provides an analysis of the strengths and weaknesses of the video detection system technology based data compared to the Automatic Trac Recorder data and helps in the decision process of whether to use the data for specic transportation planning and strategic decision applications.
© 2015 Sharif University of Technology. All rights reserved.
1. Introduction
Obtaining accurate continuous trac count data is essential for transportation agencies for various trans-portation operation and planning purposes. Trans-portation agencies collect continuous trac data uti-lizing permanently installed in-pavement sensors and related telemetry trac data collection equipment, commonly referred to as Automatic Trac Recorders (ATR). These ATR trac data provide continuous trac count coverage at selected locations. In addition to providing direct measurement of Average Annual Daily Trac (AADT) counts at these locations, the data from ATRs are also used to develop seasonal or
*. Corresponding author. Tel.: +82-31-400-5154; Fax: +82-31-436-8147
E-mail address: [email protected] (W. Suh)
monthly, day-of-the-week, and growth factors, which are then used to adjust short coverage counts to generate estimated AADT counts at other sites. These continuous trac counts are also essential for planning purposes, since the 30th highest hour factors are typically determined based on permanent ATR station counts.
ATR data have been used on many occasions to generate appropriate factors to apply to short term counts for obtaining estimates of AADT [1]. However, continuous ATR count data can become unavailable, due to several factors, including pavement rehabilitation, construction and maintenance. In those cases, transportation agencies are encouraged to use alternative methods to generate AADT. As an alter-native, this paper explores the potential of using other non-invasive technologies, including a Video Detection System (VDS), on a short term basis to supplement
ATR trac count data when ATR data is not avail-able.
2. Literature review
Trac counts are one of the fundamental data sources for a variety of transportation applications ranging from assessment of current transportation system con-ditions to future transportation planning and fore-casting [2-8]. Currently, automated trac counts are collected mostly by ATR (using Inductive Loop Detectors), RTMS, and VDS based systems. While the abundance of trac count data oers new oppor-tunities for better transportation planning and fore-casting, the quality of the data is not uniform across technologies and deployments. Thus, an assessment of the suitability of data for a given use is critical.
Trac count quality is a critical part of trans-portation monitoring and planning. However, ob-taining accurate trac count data in high volume urban areas using intrusive technologies is often chal-lenging from an equipment setup and maintenance standpoint [8]. Nonintrusive technologies have evolved over the years and have been deployed to provide trac data [8-12]. The overall accuracy of those data collection technologies has been well documented [13-17]. However, the variability of each technology and its sensitivity under dierent deployment conditions has not been studied in detail. The Federal Highway Administration [12] established general principles to ensure that trac data is analyzed and summarized in a consistent manner. Understanding and identify-ing variability in the accuracy of the data collection technologies will assist transportation practitioners in making decisions using trac count data.
Numerous studies have investigated the accuracy of VDS detection technologies. The Federal Highway Administration [12] lists the accuracy of VDS as fair. It is noted that video image detectors have poor performance in high density locations or bad weather conditions. Also, occlusion and light conditions are listed as possible reasons for reduced accuracy of video image detectors. Additionally, knowing there are errors in the data collection technologies, the Federal Highway Administration [12] recommended a general rule-of-thumb to follow in order to check if the data collection equipment is working properly. According to these recommendations, the VDS data collection equipment is considered to be working properly when a comparison manual count is within 10% of the VDS counts.
While numerous studies have investigated the accuracy of trac count data collection technologies, most studies provide overall average percentage errors and have not specically explored the variability of the data generated by these technologies, especially with
dierent operating and deployment conditions, includ-ing mountinclud-ing styles and osets. This is of particular interest in urban freeway environments where deploy-ments are intensive but equipment setups are often suboptimal due to capital and maintenance resource constraints. Understanding the variability of VDS data collection technology will assist transportation practi-tioners in understanding the limitations and strengths of the data for measuring performance, and, thereby, for making decisions based on analysis using trac count data from VDS technology.
The following section describes the data collection approach for this study. Afterwards, three separate analyses are presented to demonstrate the accuracy and variability of VDS data under various deployment conditions, including mounting styles and osets. This paper also provides a discussion of potential problems and areas of future improvement.
3. Data collection
This study adopted a strategy for obtaining manual counts that would allow for count verication, thereby, reducing the potential for inaccuracies in collecting the baseline comparative counts. Over 1400 lane hours of video from Pan-Tilt-Zoom (PTZ) freeway surveillance cameras were recorded near selected VDS locations (study sites) around the Metro Atlanta area, from 6AM-10AM and 3PM-7PM, in 2011 and 2012. The video was manually processed using a Tablet-based trac counting application [18] to generate manual counts. The manual counts were then compared with the VDS data to evaluate its accuracy. Table 1 and Figure 1 show the data collection locations with their site-specic characteristics.
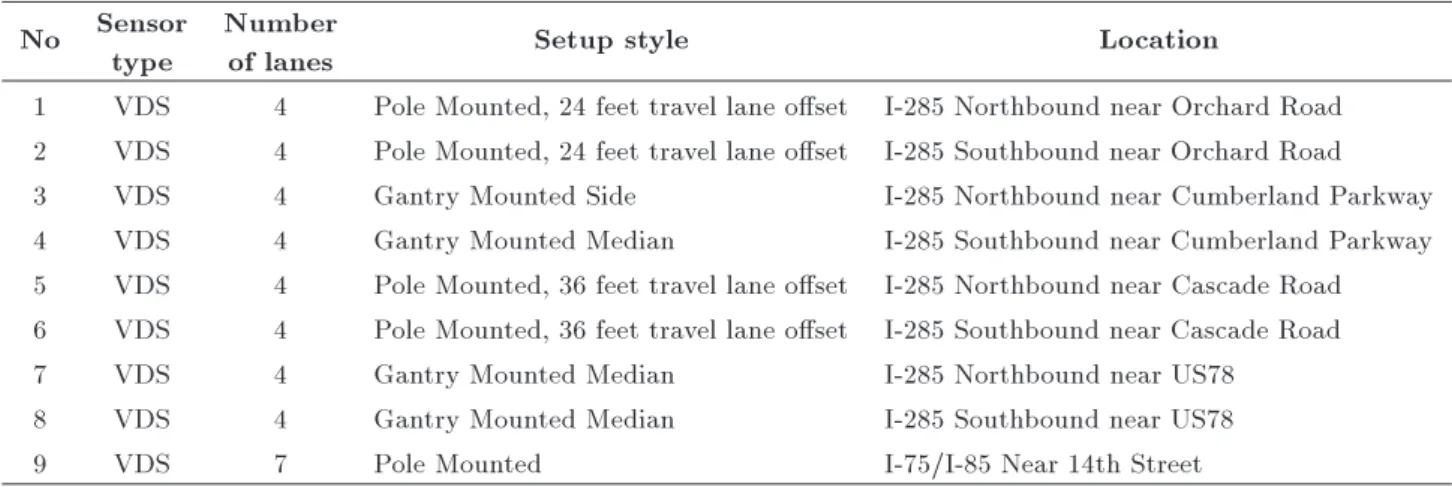
Table 1. Data collection location summary. No Sensor
type
Number
of lanes Setup style Location
1 VDS 4 Pole Mounted, 24 feet travel lane oset I-285 Northbound near Orchard Road 2 VDS 4 Pole Mounted, 24 feet travel lane oset I-285 Southbound near Orchard Road 3 VDS 4 Gantry Mounted Side I-285 Northbound near Cumberland Parkway 4 VDS 4 Gantry Mounted Median I-285 Southbound near Cumberland Parkway 5 VDS 4 Pole Mounted, 36 feet travel lane oset I-285 Northbound near Cascade Road 6 VDS 4 Pole Mounted, 36 feet travel lane oset I-285 Southbound near Cascade Road 7 VDS 4 Gantry Mounted Median I-285 Northbound near US78
8 VDS 4 Gantry Mounted Median I-285 Southbound near US78
9 VDS 7 Pole Mounted I-75/I-85 Near 14th Street
To ensure the accuracy of the manual counts and reduce human processing error, a tablet-based trac counting application has been developed at the Georgia Institute of Technology. This application allows the data collectors to manually count vehicles on a tablet from videos recorded from trac-monitoring cameras. Counts are recorded on the tablet by the data collector tapping on the screen when the vehicle crosses the designated count location (lane specic), set as part of the program initialization for that site. The data collectors can stop and play the videos at the collectors' convenience. This application also allows the data collectors to replay and toggle through the video to review and correct counts. The detector location will highlight whenever tapped and the highlight is recalled when the video is reviewed. This allows dierent data collectors to review and correct other users' counts while replaying the video. Figure 2 shows a snapshot of the application.
4. Results
For this study, the various VDS sites with dierent mounting styles were compared to the manual counts.
Figure 2. Tablet counting application screenshot [18].
4.1. Pole mounted VDS with 24 feet travel lane oset
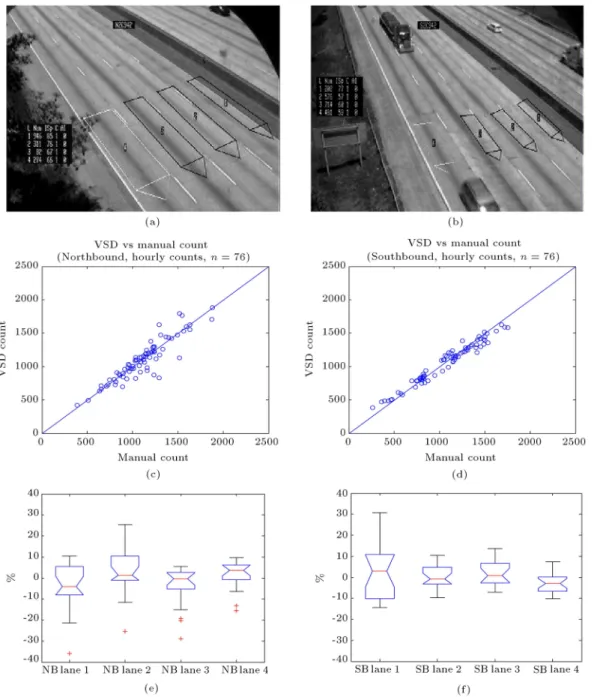
Two pole mounted VDS sites with a 24 feet travel lane oset near the ATR site were selected as study sites. Figure 3(a) through (d) show the VDS camera views and the corresponding y-y plots of the VDS counts versus the manual counts. Lane 4 of the northbound trac was not included, since accurate manual counts were not available due to an obstruction in the PTZ camera view used for manual counting. The y-y plots show a general trend of agreement between the VDS and the manual counts. It can be seen from the northbound VDS camera that at higher trac volumes, the VDS camera slightly under counted compared to the manual counts. Figure 3(e) and (f) show the box plots for the percent dierence between the VDS counts and manual counts by lane. It can be seen that the VDS median dierences are generally within 5%, the box boundaries (25th to 75th percentile dierences) are within 10%, and the box whiskers are generally within 15% (with one exception) of the manual count. It was found that the lane-by-lane mean absolute percent dierences were within 7%. When considering the sum of all lane counts, the mean percent dierences were within 2%, and the average absolute percent dierences were within 6%. It is also interesting to note that the southbound VDS unit shows a wider distribution of the dierences in the lanes farther away from the camera. This observation matches expectations that the lanes farther away from the camera would experience more occlusion and splash-over issues. However, similar evidence was not found in the northbound VDS data. 4.2. Gantry mounted VDS (median & side) The VDS cameras at the two study sites near Cum-berland Parkway and the two study sites near US-78 are gantry mounted. While the VDS camera in the northbound direction near Cumberland Parkway is located over the right edge of the rightmost lane, the other three cameras are located over the left edge
Figure 3. Pole mounted VDS with 24 feet travel lane oset trac count comparison (left: Southbound, right: Northbound).
of the leftmost lane. Figure 4(a) through (d) present the VDS camera views and the corresponding y-y plots of VDS counts versus manual counts for the VDS detectors near Cumberland Parkway. The y-y plots show a positive relation between the manual counts and VDS counts. However, at lower trac volumes, there are some data points that show the VDS unit is under counting. It was found that the four data points (Lane 1 through Lane 4 southbound) showing signicant undercounting, between 35% and 52%, were from November 16th, 6AM-7AM. The signicant un-dercounting disappeared after 7:30 AM. It is believed that the undercounting was related to moisture on the
camera lens. Also, these VDS units show a trend of slightly under counting at high volumes.
Figure 4(e) and (f) show the box plots for the dierences of the VDS counts from the manual counts by lane. It can be seen that the VDS median dierences are generally within a few percent, the box boundaries are within 10%, and the box whiskers are within 15% of the manual count. This is similar to that seen in the previously discussed pole mounted camera data. While not included in this paper, the y-y plots and box plots for the VDS sites near US78 show patterns very similar to those seen in Figure 4. When considering the sum of all lane counts, the mean percent dierences
Figure 4. Gantry mounted VDS trac count comparison (left: Southbound, right: Northbound).
were within 5%, and the average absolute percent dierences were within 9%. The lane-by-lane mean percent dierences were within 8%, and the lane-by-lane mean absolute percent dierences were within 10%.
4.3. Pole mounted VDS with 36 feet travel lane oset
The Cascade road study sites (Sites 5 and 6 in Figure 1) with VDS cameras mounted on a pole with a 36 foot oset from the edge of the travel lanes were chosen to explore the potential eects of an increase in oset distances on the accuracy of VDS counts. The VDS sites also have 4 lanes of trac in the northbound
and northbound directions. When considering the sum of all lane counts, the mean percent dierences were within 2%, and the average absolute percent dierences were within 8%. Furthermore, when considering the lane by lane counts, the mean percent dierences were within 5%, and the mean absolute percent dierences were within 11%. Figure 5(a) through (d) show the camera views of the VDS cameras and the correspond-ing y-y plots of the VDS data versus the manual counts. The southbound location appears to be slightly under counting during higher volume trac conditions. Figure 5(e) and (f) show the box plots for the percent dierences of the VDS counts from the manual counts by lane. It is seen that the overall variability (as
Figure 5. Pole mounted VDS with 36 feet oset trac count comparison (left: Southbound, right: Northbound).
represented by the box plots) is higher than that seen at the other VDS locations.
4.4. VDS on I-75/85
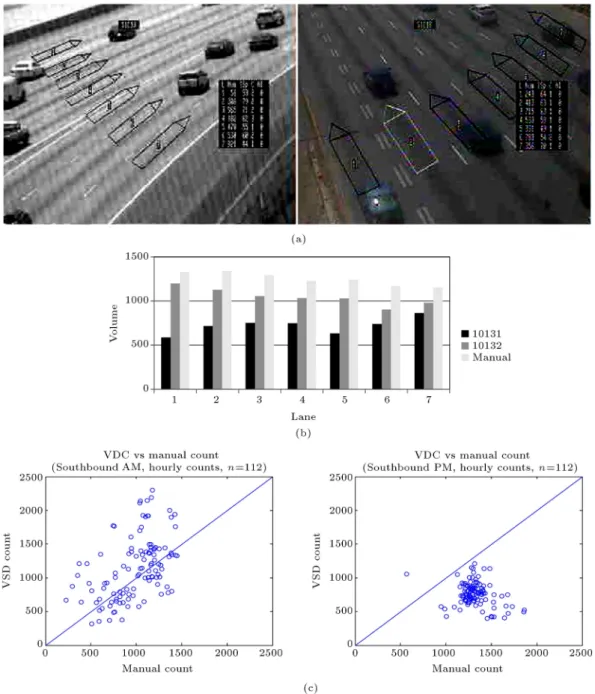
A study site with a VDS covering seven lanes (No. 10131) is located in Midtown Atlanta. After initial comparison of the manual counts from the recorded PTZ camera video and the VDS collected counts, it was found that the VDS camera was signicantly over counting during the morning peak and under counting during the afternoon peak. Given the high level of dierence, AM trac count data and PM trac count data were compared separately to trac counts of the next downstream VDS site (No. 10132) to explore if a potential systemic error occurred. The two manual
count sets matched better with the downstream VDS counts, implying that the selected site had severe accuracy issues and was possibly malfunctioning. Fig-ure 6(a) shows the camera views of VDS cameras at Sites 10131 and 10132. It can be seen that Site 10131 is located on the outside of the highway with a large shoulder and Site 10132 is located in the median with no shoulder. This large oset combined with the large width of the highway may be causing severe detection issues at this site. Also, there are higher possibilities of occlusion, due to the low angle to the detection zone, since this VDS camera covers 7 lanes, compared to 4 lanes in other study locations.
Figure 6(b) shows the count comparison between the VDS cameras at Site 10131 and 10132 and the
Figure 6. VDS on I-75/85: (a) VDS Camera views (left: Site 10131, right: Site 10132); (b) trac count comparison between VDS site 10131 and 10132, and Manual Counts; and (c) Y-Y plots for VDS counts vs. Manual Counts (left: AM, right: PM).
manual counts by lane from July 7th, 2012, from 4 PM to 5 PM. This comparison shows better agreement between Site 10132 and the manual counts than Site 10131 and the manual counts. It is also interesting to note that Figure 6(b) shows that at Site 10131, the lanes farther from the camera (inside lanes), in general, report a larger dierence than the closer lanes. Figure 6(c) shows y-y plots for Site 10131's VDS counts versus the manual counts for the AM and PM peak periods. This gure shows strong evidence of inaccu-rate data reported from Site 10131. The AM peak plot shows the VDS unit's tendency to over count, while the PM peak plot shows that the VDS unit has a consistent
under counting over all lanes. This signicant dier-ence may be caused by a number of factors, including low angle to the detection zone, more occlusion due to the increased oset resulting from the presence of seven lanes, and the inability of the VDS unit to process vehicle detection over seven lanes simultaneously.
5. Discussion
More than 1000 lane-hours of video were processed to evaluate the performance of the VDS detectors under various conditions including mounting style, height, and osets. It was seen that:
Pole Mounted VDS with 24 feet oset: Lane-by-lane median, box boundary, and whisker dierences are generally within 5%, 10%, and 15% of the manual count data;
Pole Mounted VDS with 36 feet oset: Lane-by-lane median, box boundary, and whisker dierences are generally within 5%, 10%, and 25% of the manual count data, respectively;
Gantry mounted VDS: Lane-by-lane median, box boundary, and whisker dierences are generally within 3%, 10%, and 15% of the manual count data, respectively;
When aggregating an overall lanes gantry, 24 feet oset pole mounted and 36 feet oset pole mounted VDS have median dierences of 1%, 1%, and 2%, with the manual counts, respectively;
The VDS unit covering seven lanes showed severe deviation from the manual counts, in excess of 40% dierence from the manual counts.
A portion of these dierence may be attributable to the VDS sensor locations. These range from approximately 50 to 300 feet from the area covered by the PTZ camera. Some of the dierence between the detector and the manual counts could perhaps be attributed to weaves occurring between the VDS detection zone and the manual count detection zone. However, observations at the sites indicate that this impact was likely to be low.
In addition to the above ndings, Table 2 shows the MPE and MAPE for each sensor type aggregated over all lanes with 95% condence intervals, as well as lane-by-lane MPE and MAPE. It is readily seen that the accuracy of VDS counts varied from site to site with mean dierences as well as condence intervals varying by location. A signicant implication of this behavior is that a uniform correction factor may not be developed for application to all VDS data. Instead, correction factors must be developed on a site-by-site basis.
Based on observations in this study, the inac-curacies in VDS data appear to typically arise from 1) vertical occlusion (multiple vehicles counted as one) leading to under-counting; 2) horizontal occlusion (trucks in a closer lane counted over two lanes) leading to over-counting under low volume conditions and under-counting in high volume conditions (where one truck occludes multiple cars); 3) unfavorable lighting conditions, e.g. dew accumulation on lens/dome, fog, refraction of light on dust particles during dusk and dawn, etc.; and 4) VDS detection area selection at-tempting to minimize horizontal occlusion from trucks, resulting in small detection zones more likely missing detections, particularly in the farther lane.
Additional observations include:
Gantry Mounted VDS. Accuracy of VDS with gantry mounted cameras was not signicantly better than that of pole mounted VDS sites. Gantry mounted cameras are typically lower (about 45 feet above the pavement) than pole mounted cameras (about 65 feet above the pavement) in the Metro Atlanta area. Therefore, it is likely that the advantage of a smaller horizontal oset is diluted by the loss in vertical height, leading to similar viewing angles and similar vertical and horizontal occlusion;
VDS on 36 feet Oset Poles. Accuracy of VDS detection sites with cameras mounted on 36 feet oset poles was marginally lower than units with cameras mounted on 24 feet oset poles. It was found that neither the 24 feet oset nor the 36 feet oset allows the camera to be pointed vertically downwards at an angle sucient to eliminate both occlusions in the camera view. The count quality degrades slightly with the increased oset;
VDS Single Camera Covering Seven Lanes. VDS covering seven lanes in one camera was found to suer signicant accuracy problems. While it was not possible to determine the exact cause of the accuracy degradation without additional study, pos-sible causes include:
1. The view is too at leading to severe vertical occlusion;
2. The vehicles are occupying too few pixels for accurate detection by the video processing al-gorithm;
3. The performance of the video processing unit in a VDS unit degrades as the number of lane detectors congured in a single unit exceeds a given threshold.
6. Conclusion and recommendation
Although the selected sites may not be taken as representative of all possible sites, the results in this paper on the accuracy of VDS are similar to the results reported by FHWA [11,12]. While the VDS data was found to provide less precise data, they were capable of providing reasonably accurate trac counts. The acceptability of the data for a given application is dependent on the accuracy demands of that application. For example, as the data aggregated over all lanes had low dierences from the manual counts, it is likely this data is sucient for obtaining AADT values. If the intent is to nd evidence of a small change, say in the range of 0-5%, in a before-and-after study, the data has to be used with caution. Additionally, collected over short time periods, the variability will be higher. The following are a summary of the lessons learned:
Table 2. MPE and MAPE results summary all lanes and lane-by-lane (unit: %).
No Typ
e No of lanes
Setup style/ location
All lanes Lane by lane
MPE Lower 95% Upper 95% MAPE Lower 95% Upper 95% Lane
number MPE MAPE
1 VDS 4
Pole Mounted I-285 Northbound near Orchard Road
0.46 -1.22 2.45 5.49 4.58 6.41
1 -4.34 4.79 2 0.44 5.56 3 5.61 6.17
2 VDS 4
Pole Mounted I-285 Southbound near Orchard Road
0.56 -0.79 1.90 4.36 3.55 5.37
1 -5.86 6.38 2 3.14 4.43 3 4.83 4.98 4 0.61 1.81
3 VDS 4
Gantry Mounted Side I-285 Northbound near
Cumberland Parkway
0.43 -0.95 1.80 4.81 3.85 5.77
1 -3.05 5.68 2 0.05 5.50 3 2.94 3.60 4 1.65 4.44
4 VDS 4
Gantry Mounted Median I-285 Southbound near
Cumberland Parkway
-0.68 -2.60 1.23 6.09 4.63 7.54
1 -4.36 5.27 2 -3.28 5.00 3 3.10 9.19 4 2.26 5.46
5 VDS 4
36 Feet Oset Pole Mounted I-285 Northbound near Cascade Road
-1.11 -3.63 1.41 7.24 5.31 9.17
1 -4.98 8.82 2 2.87 7.69 3 -4.19 6.64 4 1.16 5.53
6 VDS 4
36 Feet Oset Pole Mounted I-285 Southbound near
Cascade Road
-1.34 -2.93 0.26 5.86 4.92 6.79
1 -2.96 10.18 2 -0.59 4.76 3 0.98 4.67 4 -3.58 4.62
7 VDS 4
Gantry Mounted Median Median I-285 Northbound near US78
-3.84 -5.69 -1.99 6.97 5.74 8.19
1 -6.84 7.26 2 -4.43 7.14 3 -0.56 6.52
8 VDS 4
Gantry Mounted Median I-285 Southbound
near US78
-4.13 -5.78 -2.48 6.67 5.43 7.90
1 -7.20 7.59 2 -6.67 7.41 3 -2.98 4.25 4 1.08 7.04
9 VDS 7
Pole Mounted I-75/I-85 Near 14th Street
-17.32 -22.96 -11.67 38.92 35.62 42.23
1 13.16 64.33 2 -13.99 40.63 3 -17.92 34.19 4 -23.12 32.56 5 -26.58 34.26 6 -24.95 32.52 7 -24.76 37.60
Accuracy of VDS counts varied from site to site and lane to lane. Condence intervals for trac counts also varied by location. Therefore, a uniform correction factor cannot be applied to all VDS counts. If there is a need to apply a correction
factor to remove a consistent bias in the data, the correction factor needs to be determined for each detector (lane-by-lane);
specic deployment characteristics. Thus, it is recommended to perform eld validation of the data at any site before choosing it as a data source;
To improve VDS count accuracy camera angles and location may need to be adjusted. However, in practice it may be less resource intensive to choose an alternative site rather than attempting to re-focus the camera and re-evaluate the detectors for accuracy, particularly where multiple VDS cameras exist along a corridor;
Counts aggregated over all lanes provide the highest accuracy. Trac counts aggregated over all lanes are expected to have less variation than lane-by-lane counts, because the over/under-counting in one lane due to splash-over/occlusion is, in many cases, compensated for by under/over-counting in the adjacent lane;
There is a likely limit to the number of lanes that may be accurately counted by a single VDS unit. For VDS detection, it is recommended to use multiple units to detect vehicles over sections with a large number of lanes. Use of multiple cameras will allow for better viewing angles and less occlusion or pixilation issues.
Finally, assessing and monitoring a reliability/ con-dence coecient for each detection site might be useful to help pick sites with good data for future studies or to serve as potential data collection sites, and could facilitate better and more frequent use of the trac monitoring data instead of expending resources on short term counts.
Acknowledgments
This work was sponsored by the Georgia Department of Transportation research project 11-13 Feasibility Study for Video Detection System Data to Supple-ment Automatic Trac Recorder. Dr. Suh's work was sponsored by a grant NRF-2014R1A1A2054793 and Transportation & Logistics Research Program 15CTAP-C097344 of Korean government. The ndings and conclusions presented herein represent the opinion of the authors and not necessarily that of the Georgia Department of Transportation.
References
1. Oce of Highway Policy Information, Highway Per-formance Monitoring System Field Manual, Federal Highway Administration, Washington, D.C. (2012). Available at: https://www.fhwa.dot.gov/policy information/presentations/2012/
hpms eld manual 2012.pdf.
2. Mergel, J. An Overview of Trac Monitoring
Pro-grams in Large Urban Areas, Center for Transportation Information of Volpe National Transportation Systems Center (1997).
3. UNECE - Handbook on Statistics on Road Trac, Methodology and Experience, United Nations Eco-nomic Commission for Europe (UNECE) - Transport Division (2007).
4. Leduc, G. \Road trac data: Collection methods and applications", European Commission Joint Research Centre. Institute for Prospective Technological Studies (2008).
5. Ahn, K., Rakha, H. and Hill, D., Data Quality White Paper, Federal Highway Administration (2008). 6. Federal Highway Administration, Trac Detector
Handbook, 3rd Edn., Federal Highway Administration (2006).
7. Federal Highway Administration, Trac Monitoring Guide, Federal Highway Administration (2001). 8. Transportation Research Board \Trac monitoring
data successful strategies in collection and analysis", Transportation Research Circular E-C120 (2007). 9. Fekpe, E., Gopalakrishna, D. and Middleton, D.,
High-way Performance Monitoring System Trac Data for High-Volume Routes: Best Practices and Guidelines, Federal Highway Administration (2004).
10. Minge, E., Kotzenmacher, J. and Peterson, S., Evalu-ation of Non- Intrusive Technologies for Trac Detec-tion, Minnesota Department of Transportation (2010). 11. Turner, S., Carson, J., Wilkinson, L., Travis, K. and Zimmerman, C., Trac Monitoring a Guidebook, Federal Highway Administration (2010).
12. Oce of Highway Policy Information, Trac Data Quality Measurement, Federal Highway Adminis-tration, Washington, D.C. (2004). Available at: http://isddc.dot.gov/OLPFiles/FHWA/013402.pdf 13. Rhodes, A., Smaglik, E. and Bullock, D., Vendor
Comparison of Video Detection Systems, Purdue Uni-versity, West Lafayette, IN (2006).
14. Medina, J., Benekohal, R. and Chitturi, C., Evaluation of Video Detection Systems, Illinois Department of Transportation (2009).
15. Middleton, D. and Parker, R., Evaluation of Promis-ing Vehicle Detection Systems, Texas Transportation Institute (2002).
16. Bircheld, S., Sarasua, W. and Kanhere, N., Com-puter Vision Trac Sensor for Fixed and Pan-Tilt-Zoom Cameras, Transportation Research Board IDEA Award NCHRP-140 (2010).
17. Hidas, P. and Milthorpe, F. \Trac counts for strate-gic transport model validation: What counts?", Pro-ceedings of the 32rd Australasian Transport Research Forum (2009).
A., Hunter, M. and Guensler, R. \Tablet-based traf-c traf-counting applitraf-cation designed to minimize human error", Transportation Research Record: Journal of the Transportation Research Board, No. 2339, Trans-portation Research Board of the National Academies, Washington, D.C., pp. 39-46 (2013).
19. Google Maps. Google, Inc. http://www.maps.google. com.Accessed (April 12, 2015).
Biographies
Wonho Suh obtained his BS degree in Civil En-gineering from Seoul National University, Korea, in 1998, his MS degree from Seoul National University, in 2000, and Georgia Institute of Technology, USA, in 2008, and his PhD degree from Georgia Institute of Technology, USA, in 2012. After obtaining his MS degree, he worked as a transportation engineer for more than ve years at the Yooshin Corporation in Seoul, Korea, and in the research faculty at Georgia Institute of Technology, USA, from 2011 to 2013. He is currently Assistant Professor in the Department of Transportation and Logistics Engineering at Hanyang University, Korea. His primary teaching and research
interests include trac operations and design, spe-cializing in trac simulation and highway geometric design.
James Anderson is a graduate research assistant pursuing an MS degree in the School of Civil and Environmental Engineering at Georgia Institute of Technology, USA. His research interests include trac simulation and trac operation.
Angshuman Guin is Senior Research Engineer in the School of Civil and Environmental Engineering at Georgia Institute of Technology, USA. His research interests include intelligent transportation systems, freeway trac operations, transportation safety, and trac simulation.
Michael Hunter earned his PhD degree at the Uni-versity of Texas at Austin, USA, in August 2003, and is currently Associate Professor in the School of Civil and Environmental Engineering at Georgia Institute of Technology, USA. His primary areas of interest are trac safety, operational performance and control, and simulation.
![Figure 1. Data collection locations [19].](https://thumb-us.123doks.com/thumbv2/123dok_us/8384122.2227633/2.892.477.828.791.1127/figure-data-collection-locations.webp)