Cloud Orchestration
Analytics
User Guide
March 2015
CIUG-14
Version 1.65Contents
Preface... 4
About this Guide ... 4
Audience ... 4
The structure of the Guide... 4
Documentation References ... 5
1 Cloud Analytics – General Information ... 6
2 Analytics Tools ... 7
Project Tree ... 7
Views and Data Representation ... 8
2.2.1 Summary View ... 8 2.2.2 Detailed View ... 9 2.2.3 Deep Dive... 10 Dynamic Dashboard... 11 3 VM-Level Analytics ... 13 VM-Level Analytics... 13 Chef monitoring ... 15
3.2.1 Changing Chef Mode ... 15
3.2.2 Chef Analytics ... 16
Zabbix monitoring ... 17
3.3.1 Starting the Service ... 17
3.3.2 Adding Instances to the Monitoring List ... 17
3.3.3 Customizing Zabbix Monitoring Metrics Set ... 18
AWS CloudWatch ... 19
4 Project-Level Analytics ... 21
Agility KPI ... 22
Compute Service Cost KPI ... 22
Storage Service Cost KPI ... 22
Network Performance KPI ... 23
Linux Disk I/O Performance KPI ... 23
Windows Disk I/O Performance KPI ... 23
5 Region and Cloud-Level Analytics ... 24
General KPI ... 24
Infrastructure Utilization ... 24
Financial KPI ... 25
EPAM Cloud Services Environment Monitoring ... 25
Annex A. Dynamic Dashboard Permissions ... 26
Table of Figures ... 27
EPAM CONFIDENTIAL 4
Preface
About this Guide
EPAM Cloud Analytics is a tool that implements one of the five essential characteristics defined by the NIST Definition of Cloud Computing - measured service. It provides transparent reports on Cloud infrastructure costs and state, which allows users to control and optimize resource utilization. Cloud Analytics also provides Cloud support and maintenance teams with a set of useful and effective tools for EPC operation monitoring.
This guide is dedicated to EPC Analytics, which is a four-level decision that allows the user to keep track of the Cloud infrastructure on every structural level, from a single Virtual Machine to the whole Cloud.
Here, you can find the descriptions of the available analytic tools, their performance and explains their indicators meaning.
Audience
The guide is oriented on EPAM Cloud users of different levels and roles
The General Information and Analytics Tools sections are intended to make the
reader familiar with the main idea and tools used in EPC Analytics.
The VM Level section will be interesting for maintenance engineers responsible for
the performance of a specific application.
The Project Level section is recommended for Account Managers and Project
Coordinators who are responsible for project finances.
The Regions and Cloud section will be useful for IT Operations group and Cloud Support team engaged in Cloud capacities planning, general monitoring and optimization.
The structure of the Guide
The Guide consists of four chapters:1. Cloud Analytics – General Information. This chapter gives the brief description of Cloud analytics solution, lists the analytics levels and the metrics covered on each level. 2. VM-Level Analytics. This chapter gives the details on the statistics gathered on the
VM-level, and on the two monitoring services (Chef monitoring and Zabbix monitoring) involved into the process.
3. Project-Level Analytics. This chapter describes which project data can be retrieved by Cloud analytics system.
4. Region and Cloud-Level Analytics. This data describes the information that can be retrieved to describe the overall and by-region Cloud performance.
NB: The services are still under development, with new features and details appearing. Therefore, the document will be extended and amplified, so keep track of the updates!
EPAM CONFIDENTIAL 5
Documentation References
The answers to most of your questions can be found in our Knowledge Base You might also want to check the following EPAM Cloud Orchestrator documents:
Document Title
Contains Information on
Project Management Guide
Hints and guidelines on customization of EPAM Orchestrator for the specific project needsResource Utilization Quotas
Guide
Resource Utilization Quotas and respective guidelinesEPAM Cloud Billing Guide
Current billing model implemented for EPAM CloudGraphical User Interface
Guide
EPAM Cloud Orchestration graphical user interfacePlease email your comments and feedback to EPAM Cloud Consulting at
[email protected] to help us provide you with documentation that is as clear, correct and readable as possible
EPAM CONFIDENTIAL 6
1
Cloud Analytics – General Information
EPAM Cloud Orchestration includes a comprehensive built-in analytics solution that allows
you to monitor the Cloud infrastructure performance and cost alteration at all the structural levels.
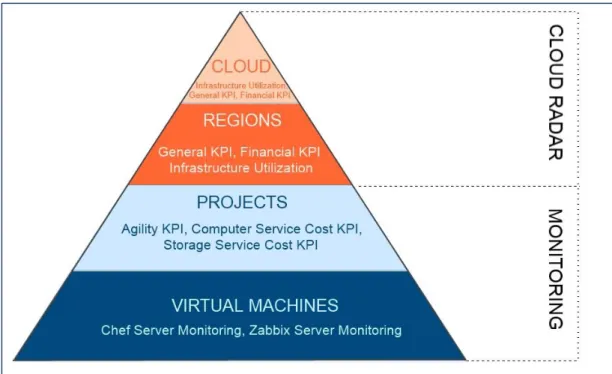
On each level, the analytics data is represented as a set of graphs and their descriptions, each illustrating the dynamic changes and the general trend of the available Key Performance Indicators (KPI) for the last 7 days.
On the picture below, you can see all the four analytics levels and the data they cover:
Figure 1 - Cloud Analytics Levels
VM and Project level statistics is available for all EPAM Cloud users and can be reached on
Monitoring page of Orchestration UI. The Region and Cloud level statistics is available on
the Radar and is available only for users assigned to CSUP project.
DASHBOARD (cloud.epam.com) Monitoring Radar Project Project by regions VMs
Cloud (All Projects)
Regions
EPAM CONFIDENTIAL 7
2
Analytics Tools
EPAM Cloud Analytics provides a set of tools that give access to different functionality and types of data.
The main Cloud analytics tools are:
Graphs on different views: there are three views, or detailing levels, Dynamic Dashboard
Dynamic Help
The navigation between the levels is mostly performed with the help of the Project Tree.
The detailed information on each of these tools is given below in this section.
Project Tree
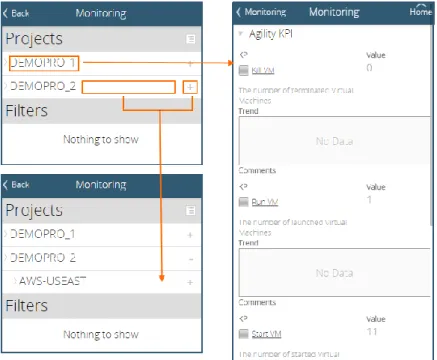
Project Tree. Project tree allows you to switch between the analytics levels. Typically, the
levels go as follows: Project -> Region -> Element. To see the analytics for a level, click on the element name (for example, on a project or a region name).
Clicking on different parts of an item in the Project tree has different effect. When you click directly the name of an item, you get the item details in the List section. When you click on
the free space in the item line, you get the item branch unfolded or collapsed:
Figure 2 - Navigating in Project Tree
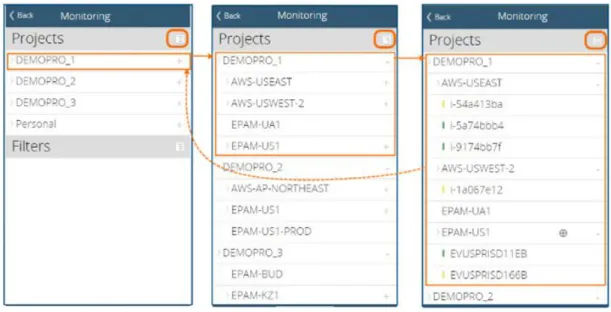
You can also use the List button ( ) to scroll automatically through different levels of Project Tree expansion:
EPAM CONFIDENTIAL 8
Figure 3 - Using the Collapse button
Views and Data Representation
On each level (apart from VM level), data can be represented in a Summary, Detailed and Deep Dive view, with each next level being a more detailed and informative representation of the previous one:
Summary Detailed Deep Dive
2.2.1 Summary View
The processed KPI are grouped by KPI purpose. The Summary view displays a summarized information on a KPI group in one line:
Figure 4 - Project-level summary view
The values in the Summary view can be displayed in different colors that give the user the idea of the changes in the KPI values:
Grey: the value didn’t change during the last seven days
Red: the current value is the maximum one for the last seven days
Yellow: the current value is the minimum one for the last seven days
NB: VM-Level analytics data representation slightly differs from that of the other levels. Please, see the VM-Level Analytics section for the details.
EPAM CONFIDENTIAL 9
Green: the current value is in a “normal” scope, i.e., it does not reach neither maximum, nor minimum point
On VM level, metrics are not combined into groups, and Summary is represented as a name of a metrics gathered by Chef, Zabbix or Amazon CloudWatch servers.
2.2.2 Detailed View
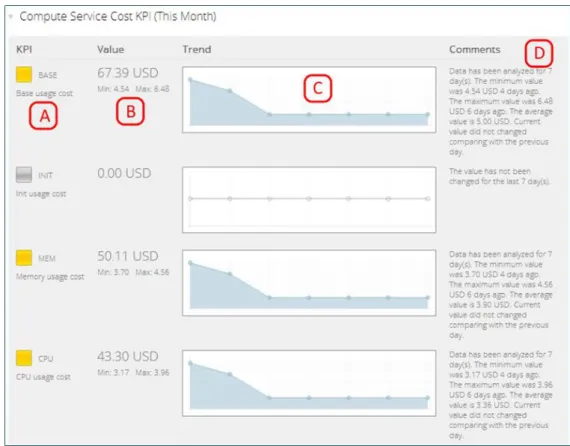
The Detailed view gives the user the details on each KPI of the selected group and opens
after a mouse click on a corresponding summary line:
Figure 5 - The detailed view for Compute Service Cost KPI
Each KPI description includes the following information:
A: KPI name and description. This includes the KPI name abbreviation used in the
Summary view, KPI description and a colored mark indicating the KPI value changes. Clicking on the KPI name will call a pop-up window with the detailed KPI description.
B: KPI value. On Project level, the KPI Value represents the monthly total value for
the selected KPI. On Region and Cloud levels, the Value gives the data for the current day.
C: Trend. The graph, representing the KPI trend. In most cases (except for the VM
level) the Trend graph does not give the exact numbers. It has an exponential Y-axis to provide clearer visualization in case there is a wide scattering of the values. The main purpose of this graph is to show whether there is a stable growing trend, or a fluctuation around an average value, etc. If the KPI value didn’t change during the investigated time period, the trend will be shown as a smooth line.
EPAM CONFIDENTIAL 10
D: Comments. The analysis of the KPI trend. This includes the minimum and the
maximum value during the reviewed period, the average value and the info on the value changes comparing to the previous day.
2.2.3 Deep Dive
You can access the Deep Dive mode by clicking a graph in a KPI details. Here, you can see the details on the KPI on the selected level, compare the KPI values and see the exact KPI values at specified points of time (unlike the Trend Graph that gives only the general thend visualization).
There is some differences in Project and Region/Cloud-level Deep Dive data set:
Project-level Deep Dive provides the detailed information on the values of the KPI
included to the same group with the KPI you selected in the Detailed view. The lines of the graph represent the data for different KPI within the group and allow to compare their influence on the overall group value.
Region and Cloud-level Deep Dive allows you to get the detailed information on the
values of a selected KPI in different regions. The lines of the graph represent the specified KPI data for the available regions.
You can switch off/on the lines on the graph by clicking on the corresponding Legend items.
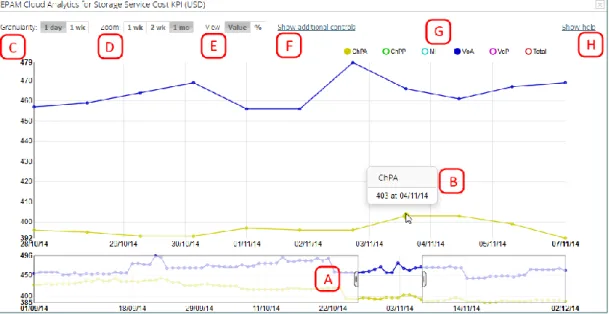
Figure 6 - Deep Dive for the Storage Service Cost KPI
A: The Scale field placed under the main Graph area covers the whole information
on the reviewed time specified by the Zoom option (one week, two weeks, one month). To see the details on a smaller time gap, click on the target place on the Scale and drag the mouse cursor right or left, thus specifying the scope to be viewed. B: Move the mouse cursor over the graph to see the exact values at the different
points of time. You can switch the graph granularity between one day and one week. You can also use the Zoom parameter to change the period under review.
C: Granularity allows to change the level of detail of the graph. D: Zoom allows to select the maximum period covered by the graph.
EPAM CONFIDENTIAL 11
E: The View tool allows to switch Deep Dive graphs representation between Value and Percentage. The Value-based graphs are the standard ones, they represent the values of the selected KPI at different points of time. The Percentage-based graphs show the relative difference in percent between a “starting” point and the other points on the graph.
By default, the “starting” point is the first point on the graph (but you can move it by dragging in the graph area). It is marked as 0%. The other points show the percentage difference between them and the “starting” point.
F: Click Show Additional controls to change the time zone and the displayed value types (average, min, max, total). Please, note that the value type changes are applicable only for graphs with one-week granularity type.
G: The Legend shows the full list of metrics available on the graph. Click the buttons to add or remove lines.
H: Show Help button unfolds the brief Deep Dive help that will be displayed over the graph.
Dynamic Dashboard
EPAM Orchestration Web Management Console allows you to put the most necessary metrics to the Dashboard so that they appear to be right at hand whenever you need them.
You can add new metrics by means of the Manage Metrics button at the end of the Dashboard, or using the Watch button next to the VM-level metrics:
To add a metric Dashboard:Add Metric VM-Level: Watch Button Find on dashboard
. Each new metric will appear as a new tile on the Dashboard:
EPAM CONFIDENTIAL 12
In most cases, the new metric is added with the help of a wizard that guides you starting from selecting the monitoring level up to the metrics name and data representation mode.
The maximum available number of metrics that can be added to Dashboard is 20.
Metrics data can be represented as a Pie Chart, or as a Current value. The Pie chart typically shows the relational values of the metric in different regions. The Current Value shows the total value of the metrics in all regions/projects.
The metrics that the user can add to the dashboard depend on their Cloud role.
You can see Annex A. Dynamic Dashboard Permissions to see the details on the Cloud roles and Metrics Levels permissions mapping, and the availability of Pie Chart graphs and Current Value metrics representation on different levels.
The following facilities are available for the metrics on the Dynamic Dashboard:
The Pie Chart Legend: To see the legend, hover the mouse cursor (or click a section
on Mobile Console) over one of the chart sections.
Update interval: When you select the little clock icon at the top left corner of each
metrics, you can see its update interval.
Metric Help: You click the metric name to see its brief description
Deep Dive: Current Value to see the detailed Deep Dive graph on the selected
metrics. For Pie Charts, the Deep Dive is available on More Info button at the top right corner of the metric.
Metrics Help and Deep Dive for Mobile Console are under Development.
Manage Metrics wizard allows to add metrics that are available only on the Dashboard (you
cannot access them on Monitoring or Radar page):
Quota Usage - A project level KPI, giving the information on the project quota usage,
in % of the project quota;
Total Chargeback - A project level KPI, giving the information on the project current
price
Total Chargeback for Previous Month - A project level KPI, giving the information
on the project total cost for the previous month.
VM Lifetime - an average lifetime of the VMs existing on all the projects on which
the user has zCloudAdmin role. If the user has no zCloudAdmin role, they cannot add this metrics.
VM Utilization - an average utilization rate (the time the VM spent in RUNNING state,
in % of the overall VM lifetime) of the VMs existing on all the projects on which the user has zCloudAdmin role. If the user has no zCloudAdmin role, they cannot add this metrics.
You can not only add new metrics to the dashboard and delete them, but also change their order by using the Manage Current Metrics option in the wizard.
As it was mentioned before, you can also add VM-level metrics to the Dashboard when you are looking through the Monitoring section. In the metric details, click the Watch button, and the Current Value metric type will be automatically added to your Dashboard:
EPAM CONFIDENTIAL 13
Figure 8 - Adding a Metric from Monitoring Section
3
VM-Level Analytics
To get analytics data on a specific VM, follow the scheme below:
Monitoring Page Selecct Project Select Region Select VM
VM-level analytics allows you to get Zabbix and Chef Server performance statistics that provides you with the information on corresponding processes on any machine within the Cloud. Due to AWS Cloud Watch integration, you can also get the statistics from the VMs located in AWS-* regions
VM-Level Analytics
There are three types of statistics provided by the VM-Level analytics:
Chef monitoring (default);
Zabbix monitoring (customizable); Amazon CloudWatch.
Chef and Zabbix statistics is available for the VMs running in EPAM regions, CloudWatch data is provided for AWS-based VMs.
The graphs for different types of statistics are unified, and they provide a set of information blocks and controls:
Chef and Zabbix monitoring services are currently not available for EPAM-KZ1 and AWS-* regions and are currently not supported for Win XP instances.
EPAM CONFIDENTIAL 14
Figure 9 - Zabbix Graph
A: The Legend. Here, the list of the metrics covered in Graph is displayed together with
the details on the key values on these metrics. Each metrics is marked with a specific color.
B: Graph. Here, the changes of the metrics values within the specified time period are
given. For Zabbix monitoring, the time period and granularity are specified in the control panel (D). For Chef monitoring, the data for the last 30 minutes is given with 5 minutes granularity. If a graph displays the data for only one metrics, the highest value will be marked with a round dot
C: Peak values. Here, the Last, Average, Maximum and Minimum values of the
represented metrics are given. The LAST, AVG and MAX values are the maximum values of the respective type among all the metrics in the graph. The MIN value gives the minimum value of all the metrics. The color of the marker indicates the metrics to which the displayed value belongs.
D: Control panel. This panel is available for Zabbix graphs only. It allows you to select
the graphs granularity (the frequency of the control points) and time period for which the statistics is given. The possible Granularity levels are 1 minute, 5 minutes, 1 hour. The available periods are 1, 2, 3, 4, 12 hours and 1 day.
E: Email reporting. The functionality is available for Zabbix graphs only. The “Email”
button makes Orchestrator mail you the detailed Zabbix info. The received E-mail can be used for detailed review or forwarded to the Consulting and Support teams in case any problems occur. This is a very informative and easy way to investigate the issues. On the Radar page, it is possible to see Zabbix statistics for the region related hosts. Here, on some periods and levels of granularity, you can see the “shades” around the metrics line.
The metrics line itself represents an average value, while the upper limit of the shade gives the maximum value, and the lower limit illustrates the minimum value:
EPAM CONFIDENTIAL 15
Figure 10 - Zabbix graph Shading
Chef monitoring
Chef Server monitoring is a default service that covers all instances created in EPAM Cloud via Maestro CLI tools. This service is available on the UI Monitoring page and does not need to be set up manually. It is a passive service that does not load the system and uses standard tools of the operating system.
However, if, due to some reasons, the default Chef server does
not fit your needs, you can change the Chef Server used at your project by switching the Chef mode. To do it, you need to activate the Chef Server Service that is based on EPAM Cloud auto-configuration service, and can be deployed in few Maestro CLI commands.
3.2.1 Changing Chef Mode
To set up the Chef Server Service, run the or2-manage-service (or2ms) command with the following flags:
or2-manage-service -p project -r region -s chef --activate When the service is run, you can use the or2-chef-mode (or2cm) command to switch between the following ACS modes:
Default mode (-m default) - the default mode for all projects in the EPAM Cloud. In this case, a common Chef server is used for all production environment machines. EPC mode (-m epc) - use project-specific Chef server, created by EPAM Orchestrator
for the specified project.
User mode (-m user) - use project-specific Chef server, created and properly configured by the user. When switching to this mode, the user should provide Chef server's instance ID (or instance IP) and manually upload validation.pem file to the Orchestrator’s file storage. The user should also provide the path to validation.pem file during the command invocation.
In order to check whether an instance has Chef monitoring opportunity, the user can submit a request to Cloud Consulting team.
EPAM CONFIDENTIAL 16
3.2.2 Chef Analytics
Chef analytics is available on the VM level. The following KPI (Key Performance Indicators) are covered by Chef Server monitoring service:
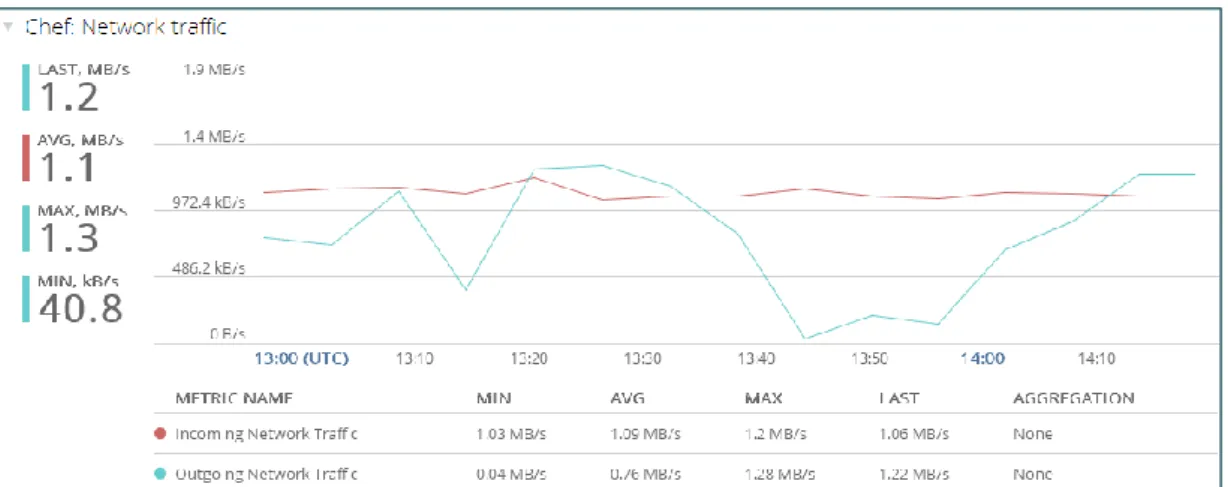
Chef: Disk read/write operations Chef: Network traffic
Figure 11 - Chef Server graph for network traffic
The table below gives the information on the metrics methods involved into the default monitoring service:
Name Description Command used to retrieve the data:
Traffic_in (Linux)
Data from iptables counters.
iptables -L -n -v -x | grep INPUT | awk '{print $7}'
Traffic_out (Linux)
Data from iptables counters.
iptables -L -n -v -x | grep OUTPUT | awk '{print $7}
Iops (Linux)
Data from ‘iostat’ utility.
iostat -d -x 1 1 | awk '{print $1" "$6" "$7}' | grep -v Linux | grep -v dm
Traffic_in (Windows)
Data from system counters.
Get-Counter -Counter "\\$vmname\network
interface($adapter)\bytes received/sec" | Select-Object ExpandProperty CounterSamples | SelectObject -ExpandProperty CookedValue
Traffic_out (Windows)
Data from system counters.
Get-Counter -Counter "\\$vmname\network
interface($adapter)\bytes sent/sec" | SelectObject ExpandProperty CounterSamples | SelectObject -ExpandProperty CookedValue
Iops (Windows)
Data from system counters.
Get-Counter '\Process(_total)\IO Data Operations/sec' | Select-Object -ExpandProperty CounterSamples | Select-Object -ExpandProperty CookedValue
EPAM CONFIDENTIAL 17
Zabbix monitoring
Zabbix Monitoring service allows the user to set up Zabbix server monitoring for instances used within EPAM Cloud. Based on EPAM Cloud auto-configuration service, Zabbix Monitoring Service gives the possibility to deploy the monitoring service for the project in few Maestro CLI commands.
When the Monitoring Service is set up, you can see the details about the server performance on the UI Monitoring page.
3.3.1 Starting the Service
The monitoring service can be started with the or2-manage-service (or2ms) command with the following flags:
or2-manage-service -p project -r region -s monitoring --activate
Here, -s parameter specifies the name of the service to manage (monitoring), and
--activate parameter indicates that the service should be activated (to stop the service, use
the --deactivate parameter).
Each project can have only one Zabbix service activated for it. If the service is already activated, you will get the respective command response:
Execution error. code=20054, message='monitoring service already activated.
If there is no Zabbix server activated for your project, a special stack will be run to launch a VM with all the corresponding Zabbix Server settings.
The command response will give the ID of the executed stack.
3.3.2 Adding Instances to the Monitoring List
When the monitoring service is activated on the project, you can add instances to the monitoring list. This is done via the or2-start-monitoring command giving the ID of the instance to be monitored:
or2-start-monitoring –p project –r region –i instanceID
After that, on the UI Monitoring page, Zabbix information on the specified instance will be available. Please, be informed that it can take up to 20 minutes between the
or2-start-monitoring command execution and the instance appearing on UI.
The metrics covered by Zabbix monitoring service are specified within Zabbix server configuration files, or templates. Below are given the default templates and the metrics they cover.
EPAM CONFIDENTIAL 18
For Windows systems (Template_EPAM_Cloud_VM_Win_passive template):
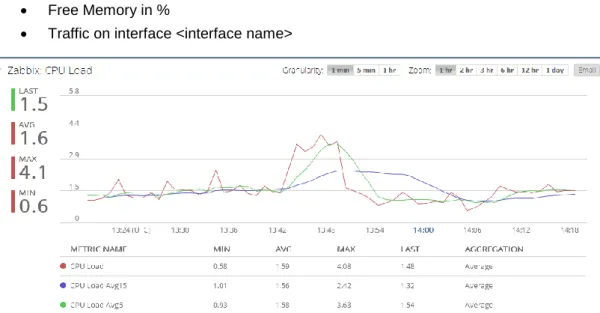
CPU Load Free Memory Free Memory in %
For Linux systems (Template_EPAM_Cloud_VM_Linux_passive template):
CPU Load
Disk Read/Write Operations Free Memory
Free Memory in %
Traffic on interface <interface name>
Figure 12 - Zabbix graph for CPU Load
3.3.3 Customizing Zabbix Monitoring Metrics Set
You can customize the set of monitored metrics by adding a custom template to Zabbix server. This should be done manually: you need to upload the template file to the server using the admin credentials.
After that, specify a custom Zabbix template when adding the instance to the monitoring list. The detailed steps are:
1. Create a Zabbix template file (or download an existing one). The file should fit Zabbix structure and other requirements.
2. Download the Zabbix template file to the Orchestration server (or2-upload-file command)
NB: For the correct Zabbix Monitoring service performance, it is recommended to add the custom image based instances to the monitoring list (or2-start-monitoring command) only after they come to the running state.
Otherwise, the custom image can be indicated incorrectly and will be monitored as a Linux image (regardless of its real type).
EPAM CONFIDENTIAL 19
3. Specify the template name with the --template option of the or2-start-monitoring command when adding the instance to Zabbix monitoring list.
AWS CloudWatch
EPAM projects more and more often use Amazon Web services via linked account mechanism (see more at http://aws.amazon.com/billing/faqs/#consolidated_1 ).
Still, there are situations when it would be convenient for users to monitor the AWS instances from EPAM Orchestration. We integrated Amazon CloudWatch and EPAM Orchestrator, so that you can see all the metrics monitored by Amazon on the Monitoring page of Orchestration UI.
As soon as you run an instance in AWS, you automatically get CloudWatch monitoring for five metrics:
CPU Utilization
Disk Read/Write (bytes) Disk Read/Write (operations) Network Traffic
Status check
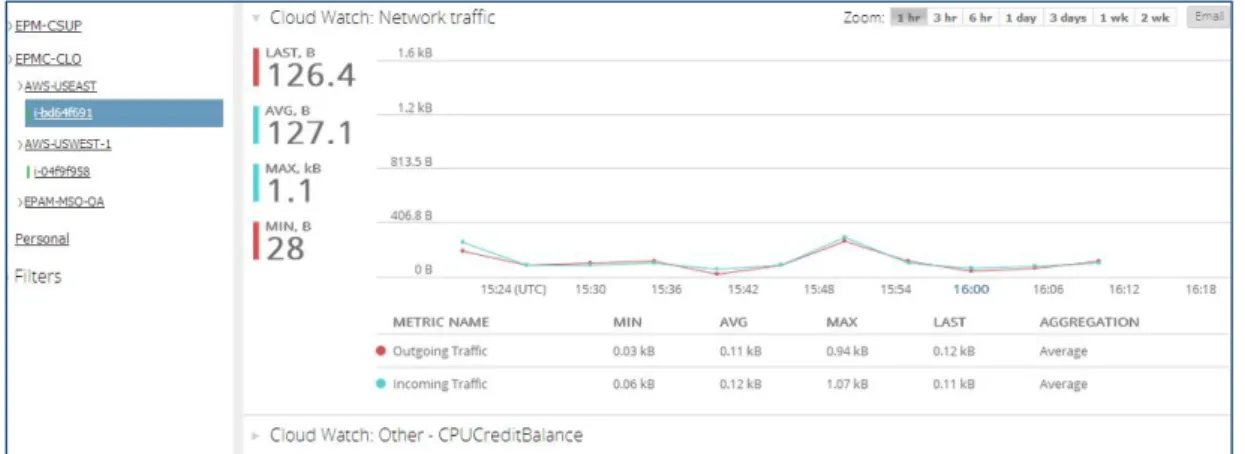
In EPAM Orchestration, the Cloud Watch data are gathered, interpreted and represented on the Monitoring page under the AWS regions the same way as Chef and Zabbix VM KPI:
Figure 13 - Cloud Watch in EO UI
AWS monitoring data representation has a number of convenient features that are absent in Cloud Watch:
The “Email” button at the top of the graph details makes the graph and the metrics details be mailed to your EPAM address.
The metrics that deal with pair data (for example, network in/outcoming data) are grouped in one graph so that you can easily compare the dynamics of both.
EPAM CONFIDENTIAL 20
If the default metrics are not enough, you can add custom ones. For more details on this, please, see the Amazon CloudWatch page.
EPAM CONFIDENTIAL 21
4
Project-Level Analytics
As a project can be activated in several regions, and pricing in these regions can vary, we provide you with the separate statistics for each of the regions in which the selected project is activated.
You can get general analytics data for project, or project details by region according to the following scheme:
Monitoring Page Selecct Project Select Region
The only KPI group available for the overall project statistics is Agility KPI that gives you the number of the used VMs with different states.
On Project level, there are two types of KPI:
Infrastructure composition and cost (Compute Service Cost, Storage Service
Cost, Agility). Here, the KPI Value represents the actual total sum for the current month, whereas the Trend graph illustrates the relative changes during the last seven days only.
Auto Configuration Service KPI - the KPI available only in cases when the project
uses Auto Configuration Service (Network Performance, Windows and Linux disc I/O performance, ACS). The graphs in these groups provide the information for the last hour.
The generalized project cost information given in Monitoring section is also represented in the Reporting page, where it is given in a comprised form. The KPI names are given in the Usage Type column:
EPAM CONFIDENTIAL 22
Agility KPI
The Agility KPI group gives the statistics on the project machines utilization. Starting from the beginning of the month and up till the current day. The following KPI are available here:
Run VM – the number of the machines with RUNNING state
Start VM – the number of started Virtual Machines
Stop VM – the number of stopped Virtual Machines
Kill VM – the number of terminated Virtual Machines
Compute Service Cost KPI
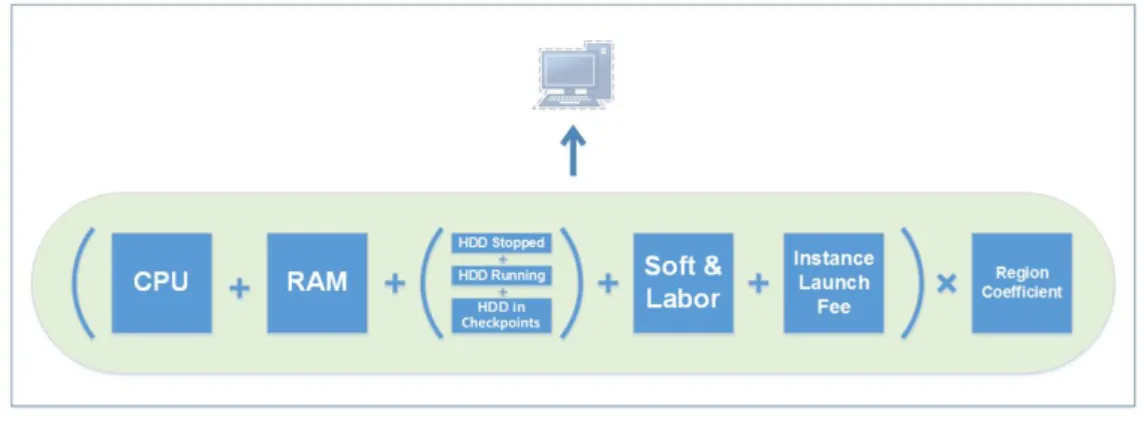
The Compute Service Cost group gives the information on the basic project cost factors. The costs are based on EPAM Cloud billing policy. The scheme below gives the main idea of the components that comprise the price of a VM (please, see our Billing Guide for details).
Figure 15 - Price Breakdown
The following KPI are covered within this group:
BASE – gives the base usage cost for the project infrastructure; this includes Soft
and Labor and a nonrecurrent instance launch fee.
INIT – Creating a new instance is charged for a one-time fee, the sum for the instances run during the current month is given here.
MEM – the overall memory usage cost.
CPU – the overall CPU usage cost
Storage Service Cost KPI
This group includes the KPI of costs for the storage used within the project:
MI – machine image usage cost
VoA – storage volume active usage: gives the cost for the storage of the active images (all but those in STOPPED state)
VoP – storage volume passive usage: gives the cost for the storage of the images in
STOPPED state.
ChPA – checkpoint volume active usage: gives the cost for the active checkpoints
EPAM CONFIDENTIAL 23
Network Performance KPI
Network performance group includes the following KPI:
IT - income traffic for the last hour, in kB/s OT - outcome traffic for the last hour, in kB/s
Linux Disk I/O Performance KPI
Linux disk I/O performance KPI group provides the information on the speed of read and write disc operations on Linux instances during the last hour. There are two KPI in this group:
LinROps - Linux Read Operations, in kB/s
LinWOps - Linux Write Operations, in kB/s
Windows Disk I/O Performance KPI
Windows disk I/O performance KPI group provides the information on the speed of disc operations on Windows instances during the last hour. There is only one KPI in this group:
WinOps - Windows Operations in ops/s
ACS KPI
The ACS KPI group gives the information on the number of VMs monitored by Chef server during the last hour. There are two KPI here:
LinuxVmCount - The number of Linux instances monitored by Chef server
EPAM CONFIDENTIAL 24
5
Region and Cloud-Level Analytics
The Region-Level analytics allows to monitor the performance and cost statistics for the regions. To see the statistics for a region, select the corresponding region on the Radar page.
Radar Page All Regions Region Name Host Name
To see the Overall Cloud statistics, select “For All Regions” in the Tree view. To see the information on a specific region, click the region name. For both Cloud and Region levels, the set of KPI groups is the same:
General (The number of active projects and VM count) Infrastructure Utilization (CPU, Memory and Storage usage) Financial (Total Chargeback).
General KPI
This group includes the region projects and VMs count and includes the following indicators:
Active Projects – the number of the active projects in the selected region
VM Count – the overall number of Virtual Machines existing in all the projects within
the selected region
Personal VM Count – the overall number of Virtual Machines existing in personal
projects within the region
Infrastructure Utilization
This group includes the statistics on the infrastructure resources utilization on the project. Here, the following KPI are covered:
CPU usage – the total number of used CPU-hours
Memory – the amount of memory used within the region
Storage – the storage volumes used within the region
Memory and Storage KPI are measured in memory-hours (MB-hour, GB-hour, etc). NB: Region and Cloud-level analytics is accessible only for users associated with the CSUP project.
EPAM CONFIDENTIAL 25
Financial KPI
The Financial KPI gives the statistics on the overall cost for the resources used within the selected region. The group includes only one indicator: Total Chargeback, given in USD.
EPAM Cloud Services Environment Monitoring
Each virtualization region is based on a number of hardware hosts, each supporting some EPAM Cloud service. Project-level analytics allows to get the information about the hosts that support the selected project.
For each region, there is a list of available hosts:
Figure 16 - Hosts list for a region
You can get Zabbix statistics for a host by selecting it from the list. The metrics covered by Zabbix depend on the Zabbix template used. You can customize the set of monitored metrics by adding a custom template to Zabbix server. This should be done manually: you need to upload the template file to the server using the admin credentials.
EPAM CONFIDENTIAL 26
Annex A. Dynamic Dashboard Permissions
There is a difference in metrics availability for users with different Cloud roles. The table below describes these permissions:Metric level zCloudAdmin zCloudUser Guest * Comment
Cloud level/All
regions **
Data from Radar page (for all regions)
Cloud level/Single region
Data from Radar page (per region)
Project level/All projects **
Custom metrics (e.g. VM lifetime)
Project level/Single project
Data from Monitoring page (Project/Region)
VM level Data from Monitoring page
(Instance)
* - Guest has neither zCloudAdmin nor zCloudUser role
** - Users without zCloudAdmin role will not be able to select the metrics of these levels in the wizard
The following table gives the availability of view types on different analytics levels:
Metric level Current
value
Pie
chart Comment
Cloud level/All
regions Data from Radar page (for all regions) Cloud level/Single
region * Data from Radar page (per region) Project level/All
projects * Custom metrics (VM lifetime, VM utilization) Project
level/Single project *
Data from Monitoring page (Project/Region) - Agility, ACS and other KPIs, and also EPCA Project
level/Single project *
Data from Orchestrator systems
(Billing/Quotas) - Total changeback and Project quota
VM level * Data from Monitoring page (Instance)
EPAM CONFIDENTIAL 27
Table of Figures
Figure 1 - Cloud Analytics Levels ... 6Figure 2 - Navigating in Project Tree ... 7
Figure 3 - Using the Collapse button ... 8
Figure 4 - Project-level summary view ... 8
Figure 5 - The detailed view for Compute Service Cost KPI ... 9
Figure 6 - Deep Dive for the Storage Service Cost KPI ... 10
Figure 7 - Dynamic Dashboard ... 11
Figure 8 - Adding a Metric from Monitoring Section ... 13
Figure 9 - Zabbix Graph ... 14
Figure 10 - Zabbix graph Shading ... 15
Figure 11 - Chef Server graph for network traffic ... 16
Figure 12 - Zabbix graph for CPU Load ... 18
Figure 13 - Cloud Watch in EO UI ... 19
Figure 14 - KPI data on the Reporting page ... 21
Figure 15 - Price Breakdown ... 22
EPAM CONFIDENTIAL 28
Version History
Version Date Summary
1.0 March 15, 2014 First published
1.1 August, 2014 Updated the VM-level analytics description 1.11 September, 2014 Changed Total Cost KPI for Total Chargeback 1.2 November 1, 2014 Updated documentation references
Added the Dynamic Dashboard section 1.5 December 6, 2014 Restructured
Added EPC Services Environment Monitoring Added Deep Dive Zoom and Graphs Type info 1.6 January 31, 2015 Added the manage Metrics Wizard
permissions.
Global
41 University Drive Suite 202, Newtown (PA), 18940, USA Phone: +1-267-759-9000 Fax: +1-267-759-8989
EU
Corvin Offices I. Futó st 47-53 Budapest, H-1082, Hungary Phone: +36-1-327-7400 Fax: +36-1-577-2384