Implementation of Graphic Based Network Intrusion Detection
System for Server Operation
Jun-Ho Huh*, Donghoon Lee* and Kyungryong Seo*
* Dept. of Computer Engineering, Pukyong National University
[email protected], [email protected]
Abstract
Most of small startup companies are exposed to various dangers like hackings or
DDoS
attacks due to their poor knowledge in server operation and its security. In this project, we have implemented the Graphic Based Network Intrusion Detection System to assist users to operate the server more easily by offering them an intuitive interface for the purpose of stable server operation.When one runs individual or small sized startup business in Republic of Korea, they often overlook the possibility of security accidents or forgo security arrangements because of the costs. Consequently such companies suffer heavy damages in their businesses when they defenselessly exposed to the hackers, leading to serious security accidents. We expect that many companies could be relieved from such difficulties, and proposing our program to encourage the use. Moreover, since all of the network based attacks go through interface cards, it is possible to prepare for the diverse attacks with consistent updating. While network analysis tools are difficult to use and need professional skills, the system suggested in this paper has made it easier to be utilized by non-professional users showing the analysis results graphically and just checking them with mouse clicks.
The system can be utilized in detection of intrusions and malignant Botnets, and enabling the use of network analysis tools which are easily adopted by the ordinary users. That is, by checking the information related to the Network Intrusion Detection with a graphic Based method, which does not require expert knowledge, the system can contribute to overall network security.
Keywords: Network Security, DDoS, IDS, NIDS, Network Intrusion Detection System
1. Introduction
Recently, as scenario attacks are spreading widely, to improve server stability government level efforts have been put into effect. However, since such efforts are excessively weighted toward government organizations, individuals are still vulnerable to the scenario attacks [1-4]. In March of 2013, Korea Communications Commission (KCC) and Korea Internet Security Agency (KISA) conducted consulting work associated with security vulnerability intended for small ICT service enterprises. As a result, they determined that most of them were exposed to the security threats claiming that the vulnerability was larger for those smaller ones, and special actions must be taken urgently in that regard. Meanwhile, many individual companies were utilize internet as a basis of their startups helped by government's "Go It Alone" business support. However, the majority of them were lack expert knowledge in server operation and its security, they were exposed to many risks such as hackings or DDoS attacks. Most of small startup companies are exposed to various dangers like hackings or DDoS attacks due to their poor knowledge in server operation and its security.
Therefore, in this paper, we attempt to implement the Graphic based Network Intrusion Detection System to assist such users to operate the server more easily by offering them an intuitive interface for the purpose of stable server operation.
Normally, the network analysis tool like Wireshark is hard to use and requires specialized skills. But the system we are proposing in this paper provides easy usage for both non-professional users showing the analysis results with graphics and allowing them to check information with just a few clicks.
This paper is organized as follows: "Graphic Based Network Intrusion Detection System" is examined in chapter 2, the explanatory sections for the "Design model" in chapter 3, and finally, chapter 4 outlines "Test evaluation and results" followed by the conclusion.
2. Graphic Based Network Intrusion Detection System
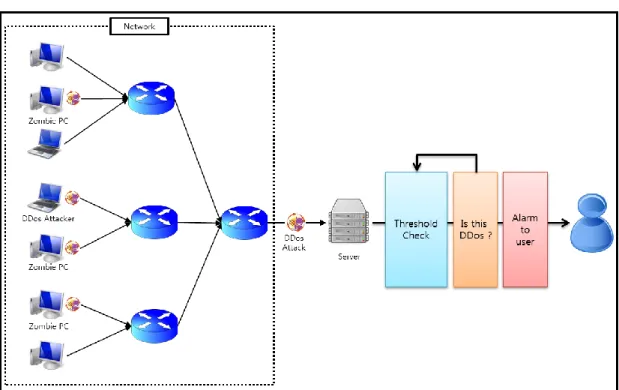
Figure 1. Graphic Based Network Intrusion Detection System
Figure 1 shows a Graphic Based Network Intrusion Detection System that we have proposed in this paper and at first, the attacker (or a zombie PC) sends a large amount of traffic towards targeted server through nearby router. The transmitted traffic paralyzes the web server and in such a case, this solution makes a judgement about the possibility of DDoS attack by calculating traffic threshold every 5 seconds to warn the user.
This program is to notify the attack events to the user when they are being initiated; real-time packet send/receive volumes are indicated with graphs; actual packet volumes are shown numerically; IPs and related information of attackers are to be outputted at the bottom of main display; and the sources of packets are described using the Google map. The DDoS attack event is determined by comparing the packet volume with threshold value every 5 seconds and should it be determined as a DDoS attack, the user is notified with the tray icon. The level of attacks are classified as "suspicious", "warning" and "dangerous", depending upon the differences when compared with the threshold value.
We have implemented a Graphic Based Network Intrusion Detection System in order to help users to manage servers more easily, and with better stability by providing intuitive interface that secures stability in server management or homepages to the entry-level operators who lack the knowledge of server management and security.
While network analysis tools are difficult to use and need professional skills, the system suggested in this paper made it easier for non-professional users to untilized by showing the analysis results graphically and just checking them with mouse clicks. On the other hand, one of the characteristics of the program is that it has a function which warns the traffics reaching set threshold value (possible DDoS attack packets).
3. Design Model
The idea was implemented using Jpcap library based on Java in window 7 development environment. Since it is possible to capture and analyze the packets that come in and out of one's own network, through Jpcap library, the system which intended for network intrusion detection was possible. For those DDoS attacks (e.g. SYN, UDP and ICMP Flooding, etc.), we have implemented an attack detection mechanism by analyzing captured packet header's information and its pattern. Analyzed patterns were used to update packet's thresholds periodically. And in order to determine if the packets are originated from the suspicious regions, message IP is checked from the packet header information obtained. Informations regarding Send/Receive packet volume and abnormal packet are handled with Java classes and can be output to user's monitor. These information (e.g. Send/Receive IP, protocol, the number of communications made and all sorts of flags) will be able to stored as logfiles.
In adaption stage, an analysis for the network installed earlier is needed. The analysis can be approached with statistical method and let's suppose that we are collecting 3 kinds(A, B, and C) of incoming/outgoing sockets for a period of s seconds and for n times, where Cs is the
number of A packets collected for the period of s seconds, then the number of packets of A is
calculate as .
Accordingly, the mean of the number of A packets entering for s seconds will be . Therefore, the variance for each packet type can be calculate as
(1)
(2)
(3) The standard deviation VA is drawn with square root of the variance VA. By using drawn
variance VA. and the standard deviation SA of A packets, it is possible to learn average number
of the normal packets, the range of abnormal packets and probabilities, for s seconds. However, even if the network systems are the same, the results may vary depending upon the access patterns and network conditions. Thus, the accuracy will be increased when detection periods (n times for s seconds) are organized irregularly across a variety of time zones. The
current threshold of traffic can be found using the mean and standard deviation of already calculated A packets and by using this threshold [1].
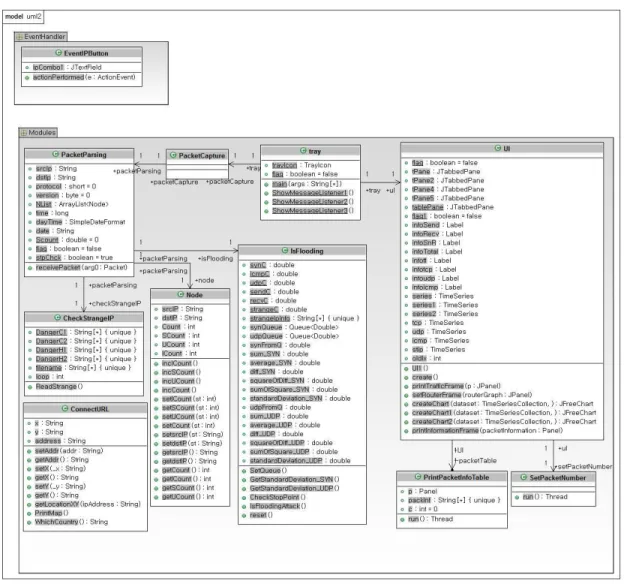
Figure 2. The UML of the Graphic Based NIDS
Above Figure 2 shows the describtion of UML of our Graphic Based Network Intrusion Detection System proposed in this paper and Tray Class is executed first in Background once the program is started. At this moment, PacketCapture Class and UI Class are called internally. For PacketCapture Class, packet is captured and ReceivePacket function is called up to analyze the packet. By analyzing IP header, ReceivePacket function reads and stores informations such as version, protocol, source and destination of the packet and after determining the Flag type, redundancy check is performed, after which Node Class is generated to store the informations. Subsequently, in CheckStrangeIP, if it becomes suspicious that the packet originating from People's Republic of China or North Korea is harmful, it's displayed on the display and in order to determine the possibility of DDoS attack - the core function of this program - threshold value is calculated in realtime basis by analyzing all the received packets every 5 seconds using IsFlooding Class. Should the incoming packet is judged to have exceeded the value, the program is implemented to show the user Warning Window with ShowMessageListener() function of Tray Class.
For UI Class, total packet send/receive volume of the computer in use, protocol packets mainly used (e.g. TCP, UDP and ICMP) for DDoS attacks and received volume of the packets judged to be the harmful ones are generated/output with the graphs. In ConnectURL Class, based on the IPs inputted by the user on the program's UI window, locations of suspicious IPs are displayed on Google map using IP location tracking service provided by the Korea Internet Security Agency (KISA).
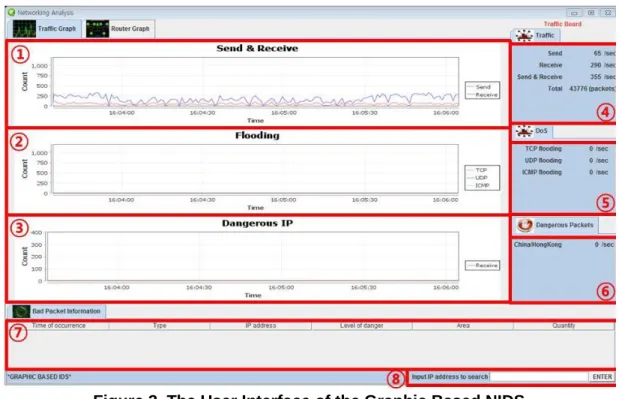
Figure 3. The User Interface of the Graphic Based NIDS
Figure 3 is a user interface of the Graphic Based Network Intrusion Detection System we have proposed in this paper. This user interface is coded with Java language to carry light resources so that when it interworks with other programs in real-time the system's operation will not be effected. Additionally, the interface is divided into
○
8 domains to assist the users with less background knowledge in computer networks.Domain
○
1 , the interface shows the Send & Receive packet traffic volumes in graphic mode. To be more specific, Domain○
1 generates the volume of all incoming/outgoing packets through servers.In Domain
○
2 , graphic chart of the Strange IP packet traffic volumes are being indicated. It detects TCP, UDP or ICMP Flooding attack packets during the DDoS attack (in the patterns) and outputs their extents with graphs. By analyzing each packet pattern and considering the volume of the packets collected in real-time basis, it updates the threshold values periodically. After setting the calculated threshold value as 100%, the server notifies the administrator about the possibility of DDoS attack if the number of collected packets exceeds set value, regarding them as the abnormal traffics.Domain
○
3 outputs the warnings to the user when there are packets transmitted from the suspicious and dangerous countries like People's Republic of China or North Korea. As seen in the current DDoS attack events against Republic of Korea mentioned above, there have been some cases of attacks made by North Korean through China, or from a certain country. Our program is constructed to block those malicious accesses.On the other hand, Domain
○
4 and○
5 denote traffic volumes numerically and the former shows the packet volumes of TCP, UDP and ICMP and the latter, the traffics in Domain○
3 .As for Domain
○
6 , the interface is designed graphically for easy recognition by the server operator to check the detailed information related to abnormal packets; time of incident, packet type, IP address, risk level, origin and packet numbers.An interface is designed in Domain
○
7 to enable the server administrator to check abnormal traffics specifically.Lastly, in Domain
○
8 , it is possible to produce and output a Google map by tracking down initial source router of received packet using IP address location search button.4. Test Evaluation and Results
4.1. Research Contents and MethodsThe proposed program is able to run on various platforms and implemented with Java language which offers strong network communications. Since the system aims at realtime base operation, the program is designed with a adequate structural logic which is to offer speedy response time and execution time. The purpose of the program is to show total network traffic volume in realtime and notify the user in the event of various DDoS attacks (e.g. SYN, UDP and ICMP flooding).
The Wireshark, which could be regarded as a similar product, shows packet structure that is being captured on the network interface card. It's not easy to analyze and access the situation unless the user is an expert and warning function is not provided. Thus, we have constructed the Graphic-based Intrusion Detection System that shows general structure graphically in order for the non-professionals to use it easily in case of risky situations.
According to the scenario, it seems possible to solve emergency situations using remote function. Once an attack attempt is made, and sense it with realtime surveillance program to notify the programmer standing by, he/she will be able to help initiating the defensive actions and minimize the damages.
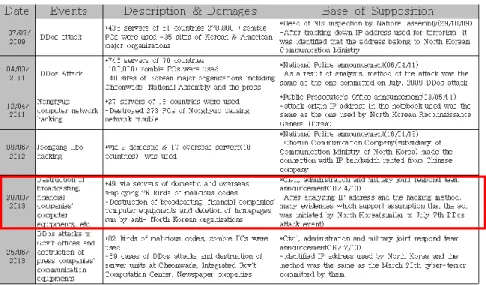
Table 1. DDoS Attack Status in Republic of Korea in Recent Years
Table 1 is a chart that shows DDoS attack status in Republic of Korea in recent years and the test was conducted with the code(i.e. partial code in the section marked red) used for the DDoS attack against NH Nonghyup Bank in March, 2013.
4.2. Test Evaluation
The "Graphic Based Network Intrusion Detection System" we have proposed in this paper was implemented with Java in the Microsoft's Window 7 development environment and Jpcap library was also used. Since it was possible to capture and analyze transmitting packets within their own networks through Jpcap library, such implementation of the system to detect network intrusions was successfully achieved.
Distinct from other existing DDoS security products, this program is a software only program, we have constructed an adequate testing environment. After installing the program in the server and embedding malicious codes in 1 PC and 5 laptops, attacks had been initiated against the server. For the test, software only DDoS detection solution and other comparable solution was used.
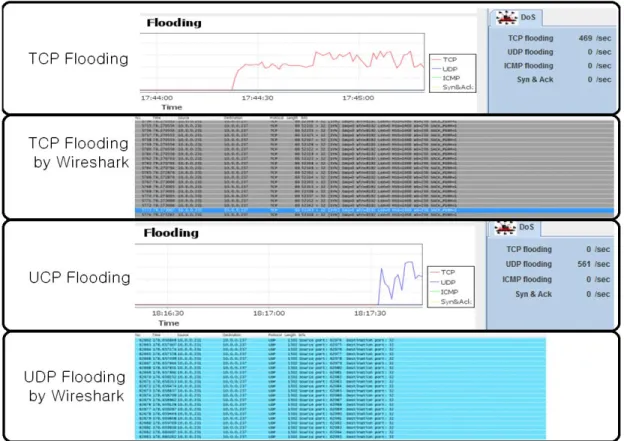
Test was conducted by coding DDoS attack rules for TCP SYN Flood and UDP Flood and the actual attacks were made to the Victim PC in which our developed intrusion detection system had been installed. Attack attempts were simultaneous and several virtual machines were used. It was possible to check TCP Flooding packet volume for each second the victim PC received and the slop changing rate in Figure 4 for this total of 4 virtual machines were used.
Figure 5. Image of Packets Captured with Wireshack at the Same Time Slot of Figure
Figure 5 the images of captured packets with our program and Wireshark respectively. Our program detected UDP Flooding successfully and then warned the user. As an experimental condition, 4 virtual machines were used to initiate attacks, consistent with the case of TCP Flooding test.
As the result of an experiment, our program detected the DDoS attack. Additionally, we were able to check that the program had captured relevant packets, calculated thresholds, and depending upon the packet volume received, warned the user with tray icons and warning sound.
The difference with advanced research [5] is that we have excluded the mechanism which detects Botnets although the function which detects and informs DDoS attack packets to the user. The most central function is to inform the user of the packets originated from DDoS attacks or danger regions by showing the communication network structure centering around the user.
Additionally, we have implemented the function which outputs packets' origin on the map. When compared with the advanced research [5], it has a similar functional aspect for thread 1 and 2. However, it does not analyze the data by bringing them out from the database(i.e. the function of thread 2 in advanced research [6]) but rather take statistical values of abnormal packets simultaneously(also in real-time base) with the program start. Based on such values, DDoS detection system which calculates the standard deviations periodically alters threshold values, uses TCP, UDP and ICMP packets has been realized.
Unlike other products, this system is a software-only DDoS detection solution so that we have established an experimental setup suitable to the system. The DDoS Botnets that struck
major government branches and the homepages of financial sector in March, 2013 was used for the attack scenario applied in the simulation. As a result of the simulation, we were able to see that the system detected the DDoS attack event and had warned the user.
4.3. Results
Graphic Based Network Intrusion Detection System was coded with Jpcap on the basis of JAVA and aimed to lookout all the packets passing through user's network interface card. It was constructed in such a way that the user can grasp network situation at a glance easily, check information regarding the control and other details, and gives warnings using threshold value enabling easy detection of DDoS attack possibilities.
The ultimate objective of the system we have proposed in this paper is to lower the entry barriers to the network analysis and management as well as providing a framework easily understandable to network administrators who do not have adequate expert knowledge yet.
Since the program has been constructed based on GUI, the users unfamiliar with Wireshark or other network analysis programs can easily approach it and the program will contribute to lowering of the entry barriers for the network security operation in small network/server management by individuals. Other contributions would be prevention of unintended errors and protection of user information. We expect that this will be achieved by displaying the harmful packets easily missed due to the mistakes and lack of security consciousness of the network administrator clearly on the monitor.
Existing commercial products have adopted a method that applies signatures to make computer systems to avoid invasions or infections. Thus, we have arranged the test that the existing anti-virus softwares are unable to detect an emergence of the new Botnets to establish the relevance of the test [6] and performed comparative analysis for the products listed below: -Product A: Alyac by Eastsoft [7] -Product B: Norton anti-virus by Symantec [8] -Product C: Smart Defense by AhnLab [9] Product D: ADSPIDER Dajaba by Digital on net [10] and, -Product E: Online vaccine v6 by nProtect [11].
In the test results, as seen in [Table 2], existing anti-virus product lines executed deletions of known Botnets after user's confirmation process but for the unknown Botnets, they continued the detections while the process was being executed. Meanwhile, in the case of Product C and Product E, deletion was executed after detecting some part of unknown malicious codes and this indicates that the deletion process was restrictively applied to the groups having the same types of malicious codes.
In general, since the traffic attacks are ones that continuously attack networks, our proposed Graphic based Network Intrusion Detection System has an advantage over others because even if smaller number(i.e. less than threshold value) of packets arrive and there exists abnormalities more than once, the system can detect them. During the test, After constructing the virtual network environment having 4 clients and initiating DDoS attacks, we were able to observe that all of the attacks were detected.
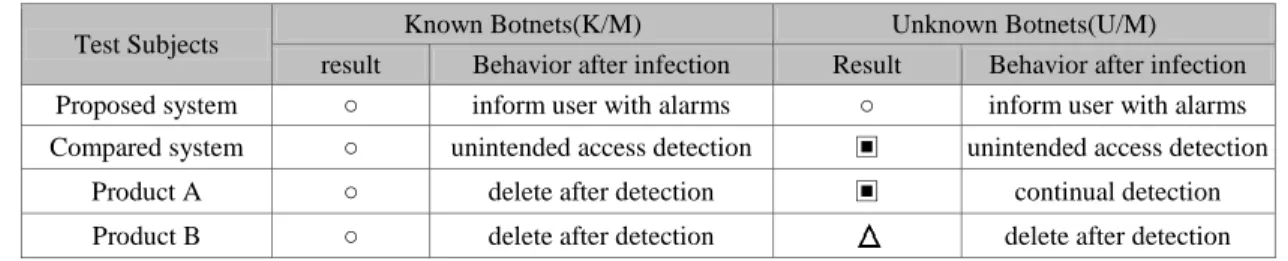
Table 2. The Comparative Analysis with Advanced Research
Test Subjects Known Botnets(K/M) Unknown Botnets(U/M) result Behavior after infection Result Behavior after infection Proposed system ○ inform user with alarms ○ inform user with alarms Compared system ○ unintended access detection ▣ unintended access detection
Product A ○ delete after detection ▣ continual detection Product B ○ delete after detection delete after detection
Product C ○ delete after detection ▣ continual detection Product D ○ delete after detection ▣ continual detection Product E ○ delete after detection delete after detection
○: detection, :partial detection, ▣: undetection
5. Conclusion
Normally, DDoS type attacks are more difficult to handle and have much more constraint conditions than the attacks which exploit vulnerabilities of operating systems or application programs. Moreover, because attacks are made in distributed network environment, it is not easy to track down the origin and the scale of damage caused by computer network failure increases exponentially in accordance with attack duration time. Since it's impossible to defend themselves from the DDoS Attacks just with security updates of operation system only, companies engaged in financial industry had to construct intrusion detection system that could perform continuous analysis of the network condition as well as intrusion detection. However, for those small sized online based companies who often lacked appropriate expert knowledge of homepage management and server security, it was necessary to get a program that could avoid burdensome costs and be used easily. For this reason, we have made a program which is intended to manage homepages and servers more easily through intuitive interface.
The majority of recent DDoS attacks are the ones that exceed threshold value (i.e. packet receive limit) so that the intrusion detection system should be able to protect the network server in operation by grasping the available threshold and making sure that the server would not become DoS (i.e. Denial of Service) state. However, such concept is often disregarded in Republic of Korea easily because of the cost involved.
The program proposed in this paper is an Network Intrusion Detection System (NIDS) which detects external DDoS attacks and warns the user in realtime basis to ensure speedy response. Although the system has the merits of being simple for it does not require costly hardwares and can check the traffic condition at a glance with the graphical display function, high CPU overhead, depending upon the system specifications, can be considered as a demerit.
Also, people normally wonder about the identity of attackers once they face any kinds of attacks. We expect that the system can satisfy a certain part of such curiosity by determining the origin of the attack through Google map using IP output information. Furthermore, by displaying the information such as Zombie PC's IP address, time of attack and nationality at the bottom and storing them as logfiles, a contribution to the posterior measures is anticipated.
References
[1] J.-H. Huh, Y.-H. Park, Y. Ahn, D. Lee and K. Seo, “Implementation of Graphic based Intrusion Detection System for Local Area Network”, Proceedings of the 10th International Conference on Multimedia Information Technology and Applications (MITA2014), (2014) July 8-11; Hong Kong University of Science and Technology (HKUST) Hong Kong, China, pp. 1-4.
[2] H. Liu, Y. Sun and M. S. Kim, “Fine-Grained DDoS Detection Scheme Based on Bidirectional Count Sketch”, IEEE Computer Communications and Networks (ICCCN), (2011), pp. 1-6.
[3] MIT Lincoln Lab, “1999 DARPA Intrusion Detection Scenario Specific Datasets”, LINCOLN LABORATORY, (1999).
[4] MIT Lincoln Lab, “2000 DARPA Intrusion Detection Scenario Specific Datasets”, LINCOLN LABORATORY, (2000).
[5] J.-h. Huh, M.-H. Hong, J. Lee and K. Seo, “Implementation of DDoS Botnet Detection System On Local Area Network”, Journal of Korea Multimedia Society, vol. 16, no. 6, (2013) June, pp. 678-688.
[6] D.-J. Shin and H.-S. Yang, “Design and Implementation of an Intrusion Detection System based on Outflow Traffic Analysis”, Journal of Korea Contents Association, vol. 9, no. 4, (2009), pp. 131-141.
[7] http://alyac.altools.co.kr/Main/Default.aspx [8] http://www.symantec.com [9] http://kr.ahnlab.com/b2b/securityinfo/html/renewasecreport [10]http://www.ad-spider.com/spyware [11] http://www.nprotect.com/v6/service
Authors
Jun-Ho Huh, Bachelor of Science Degree from Department of Major of Applied Marine Sciences, Bachelor of Engineering Degree (Double Major) Department of Major of Computer Engineering from Jeju National University, Jeju, Republic of Korea in Aug. 2007.
Master of Education Degree from Department of Major of Computer Science Education, Graduate School Of Education, Pukyoug National University, Busan, Republic of Korea in Aug. 2012. He is a student In the Doctor Course Major of Computer Engineering, Graduate School, Pukyoug National University, Busan, Republic of Korea. His research directions are Green IT, Network Security, Curriculum of Computer, High Availability Computing.
Donghoon Lee, Bachelor of Engineering Degree from Department of Major of Computer Engineering from Pukyoug National University, Busan, Republic of Korea in Aug. 2014. His research directions are Network Security, Ebook Security, High Availability Computing.
Kyungryong Seo, he received the Ph.D. Degree in Computer Engineering from Republic of Korea Advanced Institute of Science and Technology, Daejeon, Republic of Korea in 1995. Currently he is a professor of Computer Engineering Departments, Pukyong National University, Busan, Republic of Korea. His research directions are High Speed Computer Network, Network Security, High Availability Computing.