Data Weighted Training Strategies for Grammatical Error Correction
Jared Lichtarge Chris Alberti Shankar KumarGoogle Research
{lichtarge,chrisalberti,shankarkumar}@google.com
Abstract
Recent progress in the task of Grammatical Error Correction (GEC) has been driven by addressing data sparsity, both through new methods for generating large and noisy pre-training data and through the publication of small and higher-quality finetuning data in the BEA-2019 shared task. Building upon recent work in Neural Machine Translation (NMT), we make use of both kinds of data by deriving example-level scores on our large pretraining data based on a smaller, higher-quality dataset. In this work, we perform an empirical study to discover how to best incorporate delta-log-perplexity, a type of example scoring, into a training schedule for GEC. In doing so, we per-form experiments that shed light on the func-tion and applicability of delta-log-perplexity. Models trained on scored data achieve state-of-the-art results on common GEC test sets.
1 Introduction
Grammatical Error Correction (GEC), the task of automatically correcting errors in written text, can be framed as a translation task from ‘bad grammar’ to ‘good grammar.’ This framing has enabled GEC to borrow models and techniques from the vast literature in machine translation (MT). Neural approaches have dominated recent state-of-the-art advances in GEC, and have been shown to be more effective in direct comparison with non-neural methods (Chollampatt and Ng, 2018; Junczys-Dowmunt et al., 2018). Nevertheless, GEC continues to pose a challenge for data-reliant neural models, given that the publicly available training data is relatively limited, with the largest corpus numbering only 2M examples (Mizumoto et al., 2012). Therefore, much recent work in GEC has focused on diverse methods to address data sparsity by supplementing available annotated cor-pora with much larger pretraining data (Ge et al., 2018a; Kasewa et al., 2018; Lichtarge et al.,
2019; Grundkiewicz et al., 2019; Zhao et al., 2019). A contrasting approach to addressing data sparsity in GEC has been explored in the Building Educational Application (BEA) 2019 Shared Task on Grammatical Error Correction (Bryant et al., 2019). The task introduced theWrite and Improve training set, a new high-quality annotated corpus numbering only∼34k examples (referred to in this work as BEA-19 train), and encouraged explora-tion of low-resource methods by organizing two tracks specifically for data-restricted competition. Despite the relatively small size, many approaches using the BEA-19 train data achieved better results on common GEC test sets than previous approaches that did not have access to this small but high-quality data (Bryant et al., 2019).
In the context of neural MT (NMT), models have been shown to be sensitive to noise in the training data (Khayrallah and Koehn, 2018). Although much effort has been dedicated to methods which either filter or downweight noisy pretraining data in NMT (Junczys-Dowmunt, 2018), less attention has thus far been paid in GEC. To the best of our knowledge, previously explored techniques for filtering pretraining data in GEC are limited to hand-engineered heuristic cutoffs (Grundkiewicz and Junczys-Dowmunt, 2014) and
n-gram language model filtering (Ge et al., 2018a). Recent work in NMT (Wang et al., 2018) pre-sents a training technique for scoring the ‘noise’ of training data by employing a much smaller, higher-quality ‘trusted’ dataset. The authors de-scribe a curriculum-style training over data scored by this metric, and demonstrate significant im-provements over a baseline. We refer to this score as delta-log-perplexity (∆ppl).
2 Contributions of this Work
This work presents an empirical study of training strategies for GEC in multiple dimensions. Using a standard training setup (without scoring), we explore arrangements of GEC corpora into pre-training and finetuning data, establishing a strong
634
baseline. We then apply data scoring via∆pplto the GEC task, demonstrating the value of ∆ppl
as a heuristic for example quality. By comparing multiple plausible methods for applying∆ppl, we gain some insight into the interpretation and practical applicability of the metric. We train on the scored data via four simple methods that instantiate different intuitions about how to treat a heuristic score for data quality. We demon-strate performance gains for various demon-strategies incorporating scoring into the training, and present state-of-the-art results on the CoNLL-14 (Ng et al., 2014) and JFLEG (Napoles et al., 2017) test sets.
3 Related Work
In recent GEC work, most approaches pretrain on some synthetic data and then finetune on the union of multiple annotated data sources, with some variation in which datasets are included for fine-tuning (Grundkiewicz et al., 2019; Lichtarge et al., 2019). In a thorough study of incorporating generated pseudo-data into GEC training, Kiyono et al. (2019) report that this typical pretrain-finetune setup scales with size of pretraining data better than a setup in which all data is trained on simultaneously. Choe et al. (2019) describe a ‘sequential transfer learning’ approach in which the pretrained model, finetuned on all available annotated data, is finetuned again separately for each test set. A thorough review of the GEC field is made by Wang et al. (2020).
Data selection in MT has been performed along two dimensions: domain-relevance and denoising. Multiple researchers (Moore and Lewis, 2010; Axelrod et al., 2011; van der Wees et al., 2017) have used the difference in cross-entropy between two language models as a criteria for the selection of in-domain sentences. In contrast, Wang et al. (2018) and Junczys-Dowmunt (2018) have used data selection for denoising. Recently, Wang et al. (2019) demonstrate that a co-curriculum training for dynamic selection of data that is both clean and in-domain, can outperform independent selection along each of the two dimensions.
4 Methods
4.1 Delta-Log-Perplexity 4.1.1 Background
Wang et al. (2018) present a metric defined as the difference in log-probability of an individual
training example before and after improving a pretrained model by finetuning on a small trusted dataset. Wang et al. use this metric to order the pretrain data, and train a new model via a curriculum-style strategy using this ordering. In their setup, this metric is interpreted as measuring ‘noise’, describing the change in log probability of an example between a noisy pretrained model and its ‘denoised’ finetuned counterpart. Because log perplexity for an example is the negative of the log-probability, we refer to this score as ‘delta-log-perplexity’(∆ppl).1
4.1.2 Calculation
In the most general case, ∆ppl describes the change in a model’s log perplexity for an indivi-dual example between two checkpoints in model training. If the first checkpoint (with parameteri-zation θ−) is sampled after model convergence on abasedatasetD−, and the second checkpoint (θ+), after further finetuning on a secondtarget datasetD+, then the∆pplbetween those models for a given example (composed of input, output pair(i, o)) should suggest which of the datasets the example is more similar to, from the perspective of the successive modelsθ−andθ+.
∆ppl(i, o;θ−, θ+) = logp(o|i;θ−)−logp(o|i;θ+) (1) In the course of this work, we make use of therelative orderingof examples from the scored dataset D−
∆ when sorted by their ∆ppl scores,
rather than the actual ∆ppl score values.2 We refer to this quantity as ‘delta-perplexity-rank’:
D−∆= {(i, o,∆ppl(i, o))|(i, o)∈D−} δppl(i, o;D−∆) = 1−%ile rank(∆ppl(i, o);D − ∆) 100 (2)
‘%ile rank’ refers to percentile rank. δppl has range [0,1], and is computed such that the example with the most negative∆pplwill have the highest
δpplscore of 1. The median example will have a
δpplof 0.5.
4.1.3 Explanation
Any example drawn from D+ should trivially be expected to have a negative ∆ppl because 1Note that∆pplis a difference betweenlogperplexities, not between the example perplexities themselves.
2This allows us to implement curriculum-style data se-lection and directly weight examples using the same score.
Input:base datasetD−, target datasetD+
Result:∆ppl-scored base datasetD−∆
δppl-scored base datasetDδ θ−←train new model on D−
θ+←finetuneθ−onD+ D−
∆← {}
forexample x∈D−do
pplx−← −logp(x.o|x.i,θ−)
pplx+← −logp(x.o|x.i,θ−) x.∆ppl←(pplx+−ppl−x) D− ∆←D−∆∪x end D− δ ← {}
forscored example x∈D−
∆do x.δppl←1−%ile rank(x.∆ppl,D−∆) 100 D− δ ←D−δ ∪x end
Algorithm 1: Score base data with ∆ppl, and calculateδpplfor each sentence pair. The sym-bols x.i and x.o refer to the input and output sequences of the example.
θ+ has just been trained directly upon the exact example, whereasθ−has never seen the example before. The negative ∆ppl can be explained by suggestingθ+has begun to memorize thespecific examples inD+.
Scoring examples drawn fromD− reveals the value of the technique; both checkpoints have been trained onD− and no example in D− was present during further training onD+, so the∆ppl reflects the general changes learned during the transition fromθ−toθ+. Examples fromD−that are similar to examples fromD+can be expected to have relatively lower log perplexity for θ+, and thus lower∆ppl. Examples fromD−that are markedly different from those of D+ should be expected to have higher∆pplscores.
AlthoughD−(basedata) andD+(targetdata) refer to the pretraining and fine-tuning datasets, respectively, in our setup, we note that these two datasets could be selected according to alternative criteria. The only requirement is that these sets differ in terms of some observable qualitative aspect, for which∆pplbecomes a heuristic. While in this work we use a target dataset to focus on example quality, it may also be feasible to employ a target dataset that differs from the base data chiefly in domain, and use ∆ppl to negotiate domain transfer.
4.2 Annealing Strategies
WhenD+ is selected to be ‘higher quality’ than D−, then the ∆ppl scores of examples drawn fromD−provide a heuristic for example quality. Given a heuristic score for example quality, there are many plausible strategies to incorporate the score into a training schedule. We explore the following schemes:[a]Filter the pretraining data by discarding examples for whichδppl< k, where
k is a fixed cutoff parameter. [b] Instead of discarding data, down-weight the loss on low-scoring examples during training proportionally to their rank:weightx =δpplx. A more sophisticated
variation of filtering the data is implemented by Wang et al. (2018):[c]Define a curriculum by an exponentially decaying function over training, so that by the end of training, only the best-scoring examples remain in the training data.
includex(δpplx, k(t)) = (
1 ifδpplx ≥k(t) 0 ifδpplx < k(t)
where k(t) = 0.5Ht for training step t and constant H. To combine the benefits of down-weighting and the curriculum-style annealing, we also implement a mixed strategy[d]:
weightx(k(t)) = (
1 δpplx ≥k(t) δpplx δpplx < k(t) where k(t) = 0.5Ht for training step t and constantH.
5 Experiment Setup 5.1 Model
We use the Transformer sequence-to-sequence model (Vaswani et al., 2017), using theTensor2 Tensor open-source implementation with the ‘‘transformer clean big tpu’’ setting.3 We use a 32k word piece dictionary (Schuster and Nakajima, 2012). For all training stages we use the Adafactor optimizer (Shazeer and Stern, 2018).
5.2 Data
We train on the public version of the Lang-8 corpus (Mizumoto et al., 2012), the FCE corpus (Yannakoudakis et al., 2011), and the Cambridge 3https://github.com/tensorflow/tensor2tensor.
English Write & Improve training split described in the BEA-2019 shared task (BEA-19 train) (Bryant et al., 2019).
The Lang-8 corpus is scraped from the social language learning Web site,4and is composed of potentially erroneous sentences from English-language-learners with crowd-sourced correc-tions. The corpus includes many sentence pairs that are noisy or irrelevant to GEC for a variety of reasons. In contrast, FCE5 and BEA-19 train6 are much smaller corpora that have been carefully annotated by a small number of professional anno-tators. Due to their highly curated origin, these datasets have a much higher proportion of high-quality GEC-relevant sentence pairs than Lang-8. For pretraining data, we follow Lichtarge et al. (2019) in using a large and noisy corpus of edits crawled from Wikipedia’s publicly available revi-sion histories (REV). We also use a similar-sized corpus of sentence pairs, where the target sentences are drawn from Wikipedia, and the source sentences are generated via round-trip-translation through a bridge language (RT) (Lichtarge et al., 2019). We generate four paral-lel datasets of equal size by round-trip-translating the same ‘clean’ sequences through four bridge languages.7 Both pretraining corpora are further probabilistically corrupted via character-level insertions, deletions, transpositions, and replace-ments. We corrupt each character of REV, which already contains some ‘natural’ spelling errors, at a rate of 0.003 per character. For the RT data, which does not already have spelling errors, we use a rate of 0.005 per character.
Prior research on GEC has used the NUCLE corpus (Dahlmeier et al., 2013) for model training. Our pilot experiments showed that a model pre-trained on REV/RT yielded similar performance when fine tuned on either Lang-8 or a combination of Lang-8 and NUCLE. Because both corpora contain corrections of sentences written by non-native speakers, and NUCLE, which has only a fourth as many sentences as Lang-8, did not give additional improvements on top of Lang-8, we decided to exclude the corpus in our experiments to simplify the presentation.
4https://www.Lang-8.com.
5https://www.cl.cam.ac.uk/research/nl/
bea2019st/data/fce_v2.1.bea19.tar.gz. 6https://www.cl.cam.ac.uk/research/nl/
bea2019st/data/wi+locness v2.1.bea19.tar.gz. 7Japanese, Russian, French, and German, following Lichtarge et al. (2019).
5.3 Non-Scored Training and Finetuning
When pretraining, we train theTransformermodel for 1M steps. We set the learning rate to 0.01 for the first 10,000 steps, after which we decrease it proportionally to the inverse square root of the number of steps. When finetuning, we set the learning rate to a constant3×10−5. Regardless of
the dataset being used, we run finetuning for∽30 epochs.
5.4 Scored Training and Finetuning
When applying the scored training strategies to Lang-8, we discard the base model that was used in calculating the∆pplscores (which was trained on: Pretrain→Lang-8), and start a new finetuning run on the scored Lang-8, from a model initialized on the same pretraining data.
When applying our scored training strategies to the much larger pretraining data, rather than start the model from random initialization and repeat 1M steps of training, we continue training from the 1M checkpoint of the base model and train on the scored data for an additional 100,000 steps (using the same pretraining settings).
5.5 Evaluation
In the course of our experiments, we evaluate on the development set of the BEA-2019 shared task (BEA-19 dev), which includes examples from both W&I and the LOCNESS corpus (Granger, 1998), using the ERRANT scorer (Bryant et al., 2017). In our analysis (Section 7), we report on the BEA-19 test, with scores provided by the official Codalab of the BEA-2019 task.8We also report on the popular GEC evaluation corpora: CoNLL-2014 (Ng et al., CoNLL-2014) and JFLEG (Napoles et al., 2017; Heilman et al., 2014), for which we report
F0.5with theM2scorer (Dahlmeier and Ng, 2012)
and the GLEU+ metric (Napoles et al., 2016)
respectively. For BEA-19 dev and BEA-19 test, following the conventions of the shared task, we post-processed the model output with the spaCy tokenizer.9
For decoding, we use iterative decoding (Lichtarge et al., 2019) with a beam size of 4. For each reported test result, we select the model checkpoint, set the number of decoding itera-tions, and tune a scalar identity threshold based 8h t t p s : / / c o m p e t i t i ons.codalab.org/
competitions/20229. 9https://spacy.io/.
Corpus sentences words
FCE 28K 432K
BEA-19 train 34K 560K
Lang-8 1.9M 25.0M
Wiki revisions (REV) 170M 4.1B Wiki roundtrip-translated (RT)10 170M 4.1B
Table 1: Training datasets. Wiki refers to Wikipedia.
on performance on the corresponding develop-ment sets. Ensemble decoding is computed using the average (Cromieres et al., 2016) of the logits of multiple identical Transformers, trained separately.
6 Experiments 6.1 Standard Training
The datasets presented in Table 1 can be sorted into three categories by their relative quality. REV and RT are noisiest, with most data not appearing relevant to GEC. FCE and BEA-19 train are cleanest, as they are professionally annotated. Lang-8 occupies a middle ground, as the data, which is largely relevant to GEC but scraped from a crowd-sourced medium, does not rise to the stan-dard of professional annotation. In light of this, we combine the single REV dataset with each of the four RT datasets to produce four large pretraining datasets, each containing half Wiki revisions and half round-trip translated data (PRE). All experi-ments are run for each of these merged datasets, and all reported figures are the average of those four models. We also merge the FCE and BEA-19 train into a single finetuning set, which we refer to as ‘BEA-FCE’ (BF).
We explore three training schemes: including Lang-8 with the higher-quality annotated data, including Lang-8 with the pretraining data, and a two-stage finetuning scheme, with Lang-8 as the intermediate step.
6.2 Applying Delta-log-perplexity
For experiments [2] and [3] of the standard training setup (Table 2), we apply delta-log-perplexity scoring. For the multistage finetuning setup, we explore arrangements of base (D−) and target (D+) datasets that ensure thatD+ is smaller and 10For each of the four bridge languages. The ‘clean’ target sentences are the shared between the four.
Training Data BEA-19 devF0.5
1 PRE 24.0 →(Lang-8∪BF) 46.3 2 (PRE∪Lang-8) 32.4 →BF 51.4 3 PRE→Lang-8 42.5 →BF 51.5
Table 2: Comparing pretrain-finetune arrange-ments. The arrow indicates finetuning.
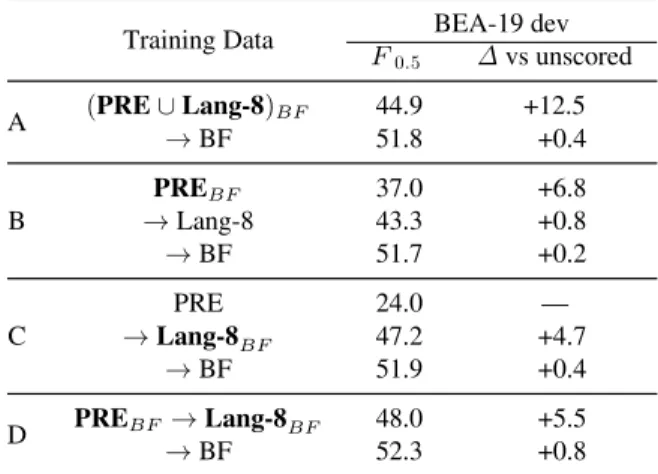
Training Data BEA-19 dev
F0.5 ∆vs unscored A (PRE∪Lang-8)BF 44.9 +12.5 →BF 51.8 +0.4 B PREBF 37.0 +6.8 →Lang-8 43.3 +0.8 →BF 51.7 +0.2 C PRE 24.0 — →Lang-8BF 47.2 +4.7 →BF 51.9 +0.4 D PREBF→Lang-8BF 48.0 +5.5 →BF 52.3 +0.8 Table 3: Comparing scoring arrangements. Bold indicates a base dataset for which ∆ppl scores have been calculated, the subscript denotes the target dataset used, e.g., in A, the scores are calculated for PRE∪Lang-8 using BF as the target. All scored datasets are trained via soft down-weighting. The final column indicates the change inF0.5 over the unscored setup at the same
training stage (absolute values in Table 2).
higher-quality than D−. For these experiments, we use the soft-weighting training strategy ([b] in Section 4.2), as it is has no tunable hyper-parameters and does not discard any data. Results are shown in Table 3.
6.3 Training With Scored Examples
Given a set of training data for which each example has an associated heuristic ‘quality’ score, there are many plausible options for incorporating that score into a training schedule. For the best-performing scoring arrangement, [D] in Table 3, we repeat the scored training stage in order to compare the following strategies for incorporating scores in training.
Training Data Training Strategy
unscored hard soft hard-cclm soft-cclm i PREBF(soft)→Lang-8BF* 43.3 49.0 48.0 45.8 47.9
→BF 51.7 52.1 52.3 51.8 52.4 ii
PREBF* 24.0 45.7 37.0 47.7 36.9
→Lang-8BF(soft) 42.5 48.1 48.4 48.6 48.0 →BF 51.5 51.8 52.4 52.3 52.2 Table 4: Comparing training strategies for PREBF, and Lang-8BF, following setup
(D) in Table 3. The asterisk indicates the training stage that is being varied in each experiment. In (ii) all models are finetuned on Lang-8BF using thesoftstrategy. The hard strategies filter out all examples with positive ∆ppl, which leaves 37% of the dataset remaining for both PREBF, andLang-8BF. The curriculum strategies anneal
down to the best 5% of the dataset, following (Wang et al., 2018).
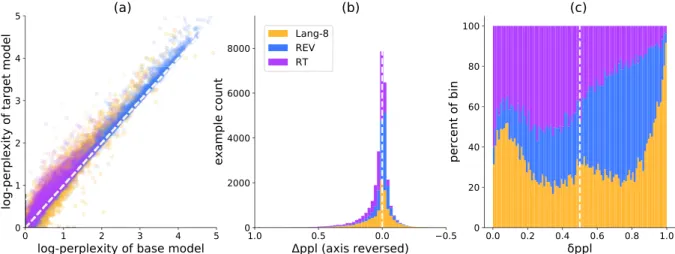
Figure 1: A comparison of the log-perplexity of base and target models (a), the corresponding histogram across the∆pplaxis (b), and the relative proportions of the three datasets in eachδpplpercentile (c), for 30k examples sampled fromPRE∪Lang-8BF such that 10k examples were selected from REV, RT, and Lang-8 respectively. The histogram (b) x-axis has been reversed to align the ‘best’ examples (with the lowest∆ppl) towards the right, copying the alignment of theδpplplot (c); for the scatter plot (a), the best examples are towards the bottom-right. Theδpplscores shown (c) are the values actually used by the various training strategies.
(a) hard Filter by preset rank-score cutoff
(b) soft Down-weight loss by rank-score
(c) hard-cclm Curriculum-style filtering
(d) soft-cclm Curriculum-style down-weighting
Results are shown in Table 4. We note that Wang et al. (2018) used the hard-cclm strategy for noise-filtering in NMT.
7 Analysis
7.1 Understanding∆pplScores
Training a model on PRE∪Lang-8BF ([A] in Table 3) achieves a +12.5 F0.5 gain over a
model trained on the same unscored dataset, and outperforms a model trained on PRE→Lang-8 by +2.4F0.5 on BEA-19 dev ([3] in Table 2). Figure 1
explores the characteristics of the∆pplscores for the merged dataset, with examples labeled by their original source dataset (REV, RT, or Lang-8).
The scatter plot (a) offers some insight into how ∆ppl works. Strikingly, all data clusters tightly around the diagonal on which ∆ppl=0. Almost all examples with negative ∆ppl also have lowppl+as well. Variance in∆pplbetween examples is much less than variance inppl+. The scatter plot yields distinct shapes for each of the datasets, and the percentile-rank plot (c) (which depicts the relative proportions of each dataset per percentile bin) shows that the datasets have drastically different scoring profiles. Lang-8, RT and REV have 52%, 30%, and 66% examples with negative (good) ∆ppl respectively, and Lang-8 carries a disproportionate share of the most
Dataset Example ppl+ ∆ppl
REV
a Itcomprisesgives birth to3 genera. 2.44 −0.25
b Theyalsocanalsolive in desert and forest areas. 0.1 −0.14 c It included 10 tracks, halfofthem with Joe on vocals. 0.07 −0.05 d Thethreee churches in the latterparish, at Rathgaroguie, Cushintown 3.89 0.06
and Terrerath, cater forhasa population of approximately 2500.
e Browsing by subject, for example,iswaspossible asiswasrestricting searches 0.42 0.12 to a particular subject or type of resource.
f She drove a blueFordSUV. 1.36 0.14
g The circle is complete.Fr. 2.65 2.06
RT
h In winter,thesport was hockey. 0.1 −0.2
i Nearly a thousand peoplewaswereinjured. 0.01 −0.16 j This sectionprovidesonlyprovidesa brief overview of some translated versions. 0.16 −0.08
k The sets are nowdepletedout of print. 0.12 0.06
l In 1902,they held a garden party on the grounds of the Rose Bay Cottage. 0.23 0.1 m Thismeant a reduction of the runtime byresulted in a25 minutesrun time reduction. 1.19 0.15
n The bad case wasAdverse weather isthe thirdlargestcause of accidents. 2.0 0.5
Lang-8
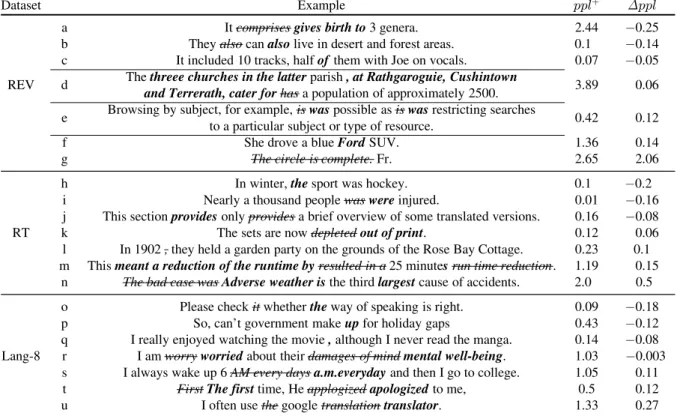
o Please checkitwhethertheway of speaking is right. 0.09 −0.18 p So, can’t government makeupfor holiday gaps 0.43 −0.12 q I really enjoyed watching the movie,although I never read the manga. 0.14 −0.08 r I amworryworriedabout theirdamages of mindmental well-being. 1.03 −0.003 s I always wake up 6AM every daysa.m.everydayand then I go to college. 1.05 0.11 t FirstThe firsttime, Heapplogizedapologizedto me, 0.5 0.12 u I often usethegoogletranslationtranslator. 1.33 0.27 Table 5: Examples fromPRE∪Lang-8BF. Italicized text represents differences between source and target. Strikethroughs represent deletions and bold text represents insertions.
extreme examples in either direction. Inspecting individual examples helps to elucidate why.
In Table 5 we draw individual examples from
PRE∪Lang-8BF alongside theirppl+and∆ppl
scores. The examples exhibit some characteristics particular to the methodology of their origination.
7.1.1 Wikipedia Revisions
Some of the REV examples [d,f,g] demonstrate the shortcomings of the dataset; significant additions or deletions of information with no grammatical content. Although most such examples have positive (bad)∆ppl, it is noteworthy that example [d], which seems catastrophically out-of-domain, has a better ∆ppl than [e], which simply changes the tense of the sentence. ppl+ is much higher for examples that have significant information change. This explains why the REV data in the scatter plot extends thinly along the
∆ppl=0 diagonal; REV contains many examples with information change, for which both source and target are grammatically correct. For these examples, absolute value of both ppl+ and ppl−
is large, but the change in ∆ppl is relatively small. This demonstrates a shortcoming of using only ∆ppl as a heuristic for example quality:
REV has a higher percentage of ‘good’ examples than Lang-8 according to ∆ppl, but many of those examples actually have largeppl+, and do not capture grammatical changes. Example [a] illustrates a related failure case; it has highppl−, but according to∆pplalone, is the ‘best’ example in the table.
7.1.2 Roundtrip-Translations
The roundtrip-translated data does not suffer from large information changes, except when the meaning is so garbled as to produce a semantically irreconcilable sequence, as in [n]. As a result, the distribution of RT examples has lower ppl+ than that of REV. However, many examples include re-arrangements or re-phrasings that are out of scope for the task of GEC [k, m]; of the 10k sampled examples, only 30% have ‘good’ (negative)∆ppl. Interestingly, in example [l], passing a sequence through two translation models introduced a reasonably placed comma in what should have been the ‘corrupted’ source sequence; removing this comma yields a bad∆ppl
7.1.3 Lang-8
Most Lang-8 examples, for better or worse, do involve grammatically relevant changes to the source sequence. Lang-8 contains many sentence pairs that contain some bad or awkward changes, and these examples perform poorly according to
∆ppl[s, u]. Interestingly, partial corrections, even apparently good ones, also perform poorly [t]. This may be a result of the relatively complete nature of the corrections made in BF, in which few if any target sequences appear to need further correction.
7.2 Training Strategies
The scored training strategies (Table 4) explore approaches to making use of an example-level quality heuristic that accommodate distinct intuitions about how to treat the data. Filtering out examples beforehand (hard) follows the intuition that bad examples only hurt performance and should be excluded. Down-weighting the loss (soft) modifies the relative importance of examples, but avoids throwing any out, main-taining the value of having a large dataset. The ‘curriculum’-style counterparts of each apply the same logic, while incorporating (albeit in a hard-coded manner) the intuition that the value of some examples changes over the course of training.
It is worthwhile to note that the optimal strategy, even among these simple hard-coded strategies, is a function of the characteristics of the dataset in question. The hard-cclm strategy is worst for
Lang-8BF, where it gradually isolates a small portion of an already small dataset, but is best for
PREBF, which is so large that 5% of the dataset
is still considerable. Also, much of what is lost in the ‘bad’ portion of PREBF is lower-quality
data than that which exists in Lang-8BF, which may explain both why hard-cclm does so well for PREBF and why soft-cclm, which does not
throw out the large portion of bad examples, does relatively poorly.
The hard strategy outperforms both soft and soft-cclmfor the first stage of both experiments, but the advantage disappears following finetuning on BF. This suggests that cutting out the ‘worst’ examples entirely, while beneficial in the scored training stage, may prevent a sort of regularization that is beneficial to the ultimate finetuned model.
That all strategies similarly outperform the baseline suggests that ∆ppl is a robust heuristic
Dataset proportion examples learning rate
full 60011 3×10⁻⁵ ∼1/2 29998 3×10⁻⁵ ∼1/4 15121 25×10−6 ∼1/8 7608 1×10⁻⁷ ∼1/16 3749 1×10⁻⁷ ∼1/32 1841 1×10⁻⁷ ∼1/64 905 1×10⁻⁷
Table 6: Successive halves of the BF dataset used in Figure 2. Proportion of FCE and BEA-19 train is held constant during down-sampling. Learning rates are tuned based on the test set of the CoNLL-2013 shared task.
for quality; that all are simple and un-tuned to the data suggests that there remains headroom for more sophisticated training strategies to do even better.
7.3 Scoring With Less Target Data
We observe that scoring any combination of lower-quality datasets using BF as the target data leads to large improvements over unscored pretraining models, and modest performance gains over those unscored models after finetuning (Table 3).
We now explore how each of these effects varies as a function of the target data size. For the scoring setup with the largest relative gains over unscored pretraining ([A] in Table 3), we repeat the same experiment multiple times, but using nested subsets of BF for both scoring and finetuning, each half the size of the previous one. While halving the datasets, we maintain the ratio of BEA-19 train and FCE data within each subset. Because using the same finetuning learning rate would quickly overfit for the smaller datasets, learning rates were tuned for each subset using the test set of the CoNLL-2013 shared task (Ng et al., 2013) (Table 6).
All models are trained via the hard-cclm strategy, which, prior to finetuning, significantly outperforms other strategies for training on scored pretraining data (section ‘ii’ in Table 4). Results are shown in Figure 2.
7.4 Understanding the Benefits of Scoring
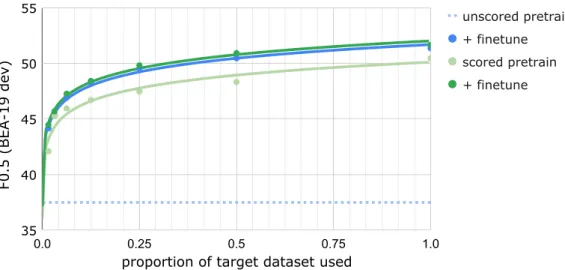
The marginal benefit of scoring the pretraining data yields a drastic performance gain over
Figure 2: Performance of scored and unscored pretraining and finetuning as a function of proportion of the target dataset used. The pretraining dataset is (PRE∪Lang-8). Full BF dataset is shown at the far right (n=60011). Each smaller dataset is a randomly halved subset of the last, with proportion of BEA-19 train / FCE examples held constant. The smallest subset, (BF randomly halved six times) has 905 examples. Logarithmic lines of best fit are shown.
unscored pretraining, even for very small amounts of target data (see Figure 2 and Table 3). This pretrain gain reflects the value of obliquely incorporating the information of the target dataset into the pretraining data via ∆ppl scoring. Because finetuning on the target dataset directly incorporates that same information again, this gain is diminished once the scored models are finetuned (see "∆ vs unscored" column in Table 3). However, the benefits of finetuning are limited by over-fitting to the finetuning dataset, which is likely to occur given that it is substantially smaller (≈1M words) than pretraining data (≈8B words). Thus the scored pretrained model, which has already incorporated some of the information of the target dataset without yet having seen any of the specific examples therein, is able to make better use of the finetuning set before the harm of over-fitting outweighs the benefit of further training. This difference explains why even after finetuning, the models with scored training stages outperform the unscored models, though by less than if directly comparing the scored and unscored stages themselves.
In Figure 2, the marginal benefit of scoring for the 30k dataset size is +0.5F0.5, compared with
+0.9 F0.5 for doubling the size of the finetuning
data (without scoring). For tasks constrained by the availability of high-quality data, and for which labeling costs are high, scoring noisy pretraining data may be a thrifty path to performance gains.
7.5 Test Set Results
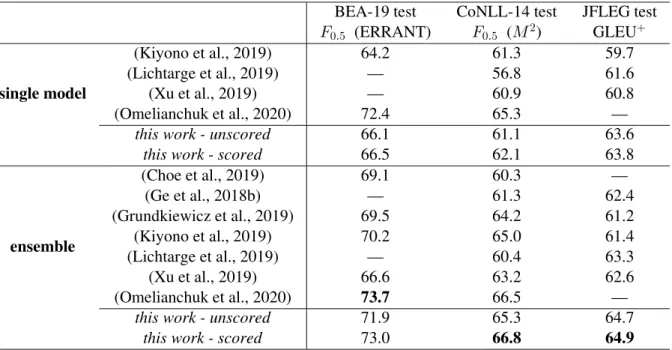
We evaluate our best unscored and scored systems at all stages of training on BEA-19 test, CoNLL-14, and JFLEG. Results are shown in Table 7. Results for BEA-19 test are provided by the official Codalab competition of the BEA-2019 shared task, where this work qualifies as Unrestricted because of its reliance on additional parallel data like the Wikipedia revisions pretraining dataset. Because the most competitive results in the BEA-2019 task were submitted to theRestricted track, the results of this work are not perfectly comparable to most recent and competitive GEC publications. Additionally, many of the cited works make use of the NUCLE dataset (Dahlmeier et al., 2013), which was not used in this work. Nonetheless, it is useful to contextualize the results within the scope of recent progress in GEC. A comparison to recent prior work is made in Table 8. This work achieves state-of-the-art results for the JFLEG and CoNLL-14 test sets, and obtains competitive results on BEA-19 test.
8 Future Work
The huge jump in performance between unscored and scored pretraining data demonstrates the possibility of making much more effective use of large and noisy datasets through the incorporation of example-level quality scores. While ∆ppl is one such score, there is significant room for
Training Strategy BEA-19 test CoNLL-14 test JFLEG test Prec. Rec. F0.5 (ERRANT) Prec. Rec. F0.5 (M2) GLEU+
unscored PRE 35.7 41.7 36.8 44.6 36.2 42.6 54.1 →Lang-8 62.7 52.4 60.3 64.0 42.8 58.3 62.5 →BF 67.4 61.7 66.1 67.6 44.3 61.1 63.6 ensemble 74.1 64.3 71.9 72.6 46.7 65.3 64.7 scored PREBF (soft) 56.6 47.1 54.4 61.6 38.2 54.8 59.4 →Lang-8BF (soft) 68.0 57.8 65.7 68.6 44.7 62.0 63.7 →BF 67.6 62.5 66.5 69.4 43.9 62.1 63.8 ensemble 75.4 64.7 73.0 74.7 46.9 66.8 64.5
PREBF (soft)→Lang-8 64.1 52.2 61.3 66.0 41.8 59.2 62.5
→BF 66.8 61.5 65.7 68.3 45.4 62.0 63.6
ensemble 71.7 67.4 70.8 71.2 49.9 65.6 64.9
Table 7: Test set evaluation results. For each test set, the finetuning checkpoint selected, the identity-correction threshold, and the number of rounds of iterative decoding are tuned to the respective dev sets. BEA-19 test results are provided via the Codalab competition website of the BEA-2019 shared task. Each non-ensemblerow represents the average of four models, whose construction is described in Section 6. Theensemblescombine the four models from the preceding row.
BEA-19 test CoNLL-14 test JFLEG test
F0.5 (ERRANT) F0.5 (M2) GLEU+ single model (Kiyono et al., 2019) 64.2 61.3 59.7 (Lichtarge et al., 2019) — 56.8 61.6 (Xu et al., 2019) — 60.9 60.8 (Omelianchuk et al., 2020) 72.4 65.3 —
this work - unscored 66.1 61.1 63.6
this work - scored 66.5 62.1 63.8
ensemble (Choe et al., 2019) 69.1 60.3 — (Ge et al., 2018b) — 61.3 62.4 (Grundkiewicz et al., 2019) 69.5 64.2 61.2 (Kiyono et al., 2019) 70.2 65.0 61.4 (Lichtarge et al., 2019) — 60.4 63.3 (Xu et al., 2019) 66.6 63.2 62.6 (Omelianchuk et al., 2020) 73.7 66.5 —
this work - unscored 71.9 65.3 64.7
this work - scored 73.0 66.8 64.9
Table 8: Comparison of test set evaluation results to prior work, showing the best reported result for each test set in each cited work. Cited values for different test sets do not necessarily represent the same model.
improvement, as seen in the example-level analy-sis in Section 7. Other methods for scoring in-dividual examples should be explored.
In our scored training, we have presented hard-coded training strategies selected for their simplicity. These un-tuned strategies are easy to implement, but do not represent optimal uses of an example-level heuristic score. The fact that there is such variability between them in the two experiments of Table 4 suggests that training
methods that are sensitive to the particularities of the scored dataset and the model may be able to make much better use of the same scored data. For example, a training scheme that, during training, dynamically decided which data to include or exclude (or how to weight the included data) could be expected to outperform our hard-coded strategies and hyperparameters. A training strategy along these lines has been implemented successfully by Kumar et al. (2019) for NMT.
These two complementary directions of future work, the development of new example-level quality heuristics and the techniques to apply them in scored training, present an intriguing path for future exploration.
Acknowledgments
The authors would like to thank Felix Stahlberg, and the three anonymous reviewers, for their helpful comments.
References
Amittai Axelrod, Xiaodong He, and Jianfeng Gao. 2011. Domain adaptation via pseudo in-domain data selection. In Proceedings of the 2011 Conference on Empirical Methods in Nat-ural Language Processing, pages 355–362, Edinburgh, Scotland, UK. Association for Computational Linguistics.
Christopher Bryant, Mariano Felice, Øistein E. Andersen, and Ted Briscoe. 2019. The BEA-2019 shared task on grammatical error correction. In Proceedings of the Fourteenth Workshop on Innovative Use of NLP for Building Educational Applications, pages 52–75, Florence, Italy. Association for Computational Linguistics.
Christopher Bryant, Mariano Felice, and Ted Briscoe. 2017. Automatic annotation and eval-uation of error types for grammatical error correction. InProceedings of the 55th Annual Meeting of the Association for Computa-tional Linguistics (Volume 1: Long Papers), pages 793–805, Vancouver, Canada. Associa-tion for ComputaAssocia-tional Linguistics.
Yo Joong Choe, Jiyeon Ham, Kyubyong Park, and Yeoil Yoon. 2019. A neural grammatical error correction system built on better pre-training and sequential transfer learning. InProceedings of the Fourteenth Workshop on Innovative Use of NLP for Building Educational Applications, pages 213–227, Florence, Italy. Association for Computational Linguistics.
Shamil Chollampatt and Hwee Tou Ng. 2018. A multilayer convolutional encoder-decoder neural network for grammatical error correc-tion. InThe Thirty-Second AAAI Conference on Artificial Intelligence.
Fabien Cromieres, Chenhui Chu, Toshiaki Nakazawa, and Sadao Kurohashi. 2016. Kyoto university participation to WAT 2016. In Proceedings of the 3rd Workshop on Asian Translation (WAT2016), pages 166–174, Osaka, Japan. The COLING 2016 Organizing Committee.
Daniel Dahlmeier and Hwee Tou Ng. 2012. Better evaluation for grammatical error correc-tion. In Proceedings of the 2012 Conference of the North American Chapter of the Asso-ciation for Computational Linguistics: Human Language Technologies, pages 568–572, Montr´eal, Canada. Association for Computa-tional Linguistics.
Daniel Dahlmeier, Hwee Tou Ng, and Siew Mei Wu. 2013. Building a large annotated corpus of learner English: The NUS corpus of learner English. In Proceedings of the Eighth Work-shop on Innovative Use of NLP for Build-ing Educational Applications, pages 22–31, Atlanta, Georgia. Association for Computational Linguistics.
Tao Ge, Furu Wei, and Ming Zhou. 2018a. Fluency boost learning and inference for neural grammatical error correction. In Proceedings of the 56th Annual Meeting of the Association for Computational Linguistics (Volume 1: Long Papers), pages 1055–1065, Melbourne, Australia. Association for Computational Linguistics.
Tao Ge, Furu Wei, and Ming Zhou. 2018b. Reaching human-level performance in auto-matic gramauto-matical error correction: An empiri-cal study.CoRR, abs/1807.01270.
Sylviane Granger. 1998. The computer learner corpus: A versatile new source of data for SLA research. In Sylviane Granger, editor,Learner English on Computer, pages 3–18, Addison Wesley Longman, London and New York. Roman Grundkiewicz and Marcin
Junczys-Dowmunt. 2014. The wiked error corpus: A corpus of corrective wikipedia edits and its application to grammatical error correction. Adam Przepiórkowski and Maciej Ogrodniczuk, editors, In Advances in Natural Language Processing – Lecture Notes in Computer
Science, volume 8686, pages 478–490. Springer.
Roman Grundkiewicz, Marcin
Junczys-Dowmunt, and Kenneth Heafield. 2019. Neural grammatical error correction systems with unsupervised pre-training on synthetic data. In Proceedings of the Fourteenth Workshop on Innovative Use of NLP for Building Educational Applications, pages 252–263, Florence, Italy. Association for Computational Linguistics. Michael Heilman, Aoife Cahill, Nitin Madnani,
Melissa Lopez, Matthew Mulholland, and Joel Tetreault. 2014. Predicting grammaticality on an ordinal scale. In Proceedings of the 52nd Annual Meeting of the Association for Computational Linguistics (Volume 2: Short Papers), pages 174–180, Baltimore, Maryland. Association for Computational Linguistics. Marcin Junczys-Dowmunt. 2018. Dual
condi-tional crossentropy filtering of noisy parallel corpora. In Proceedings of the Third Confer-ence on Machine Translation: Research Papers, Brussels, Belgium. Association for Computa-tional Linguistics.
Marcin Junczys-Dowmunt, Roman Grundkiewicz, Shubha Guha, and Kenneth Heafield. 2018. Approaching neural grammatical error correc-tion as a low-resource machine translacorrec-tion task. In Proceedings of the 2018 Conference of the North American Chapter of the Association for Computational Linguistics: Human Lan-guage Technologies, Volume 1 (Long Papers), pages 595–606, New Orleans, Louisiana. Asso-ciation for Computational Linguistics.
Sudhanshu Kasewa, Pontus Stenetorp, and Sebastian Riedel. 2018. Wronging a right: Gen-erating better errors to improve grammatical error detection. In Proceedings of the 2018 Conference on Empirical Methods in Natural Language Processing, pages 4977–4983, Brus-sels, Belgium. Association for Computational Linguistics.
Huda Khayrallah and Philipp Koehn. 2018. On the impact of various types of noise on neural machine translation. In Proceedings of the Second Workshop on Neural Machine Transla-tion and GeneraTransla-tion, Melbourne. AssociaTransla-tion for Computational Linguistics.
Shun Kiyono, Jun Suzuki, Masato Mita, Tomoya Mizumoto, and Kentaro Inui. 2019. An empiri-cal study of incorporating pseudo data into grammatical error correction. In Proceed-ings of the 2019 Conference on Empirical Meth-ods in Natural Language Processing and the 9th International Joint Conference on Natu-ral Language Processing (EMNLP-IJCNLP), pages 1236–1242, Hong Kong, China. Asso-ciation for Computational Linguistics.
Gaurav Kumar, George Foster, Colin Cherry, and Maxim Krikun. 2019. Reinforcement learning based curriculum optimization for neural machine translation. InProceedings of the 2019 Conference of the North American Chapter of the Association for Computational Linguistics: Human Language Technologies, Volume 1 (Long and Short Papers), pages 2054–2061, Minneapolis, Minnesota. Association for Computational Linguistics.
Jared Lichtarge, Chris Alberti, Shankar Kumar, Noam Shazeer, Niki Parmar, and Simon Tong. 2019. Corpora generation for grammatical error correction. In Proceedings of the 2019 Conference of the North American Chapter of the Association for Computational Linguistics: Human Language Technologies, Volume 1 (Long and Short Papers), pages 3291–3301, Minneapolis, Minnesota. Association for Computational Linguistics.
Tomoya Mizumoto, Yuta Hayashibe, Mamoru
Komachi, Masaaki Nagata, and Yuji
Matsumoto. 2012. The effect of learner corpus size in grammatical error correction of ESL writings. In Proceedings of COLING 2012: Posters, pages 863–872, Mumbai, India. The COLING 2012 Organizing Committee.
Robert C. Moore and William Lewis. 2010. Intelligent selection of language model train-ing data. In Proceedings of the ACL 2010 Conference Short Papers, pages 220–224, Uppsala, Sweden. Association for Computa-tional Linguistics.
Courtney Napoles, Keisuke Sakaguchi, Matt Post, and Joel Tetreault. 2016. GLEU without tuning. arXiv:1605.02592.
Courtney Napoles, Keisuke Sakaguchi, and Joel Tetreault. 2017. JFLEG: A fluency corpus and
benchmark for grammatical error correction. In Proceedings of the 15th Conference of the European Chapter of the Association for Com-putational Linguistics: Volume 2, Short Papers, pages 229–234, Valencia, Spain. Association for Computational Linguistics.
Hwee Tou Ng, Siew Mei Wu, Ted Briscoe,
Christian Hadiwinoto, Raymond Hendy
Susanto, and Christopher Bryant. 2013. The conll-2013 shared task on grammatical error correction. InCoNLL Shared Task.
Hwee Tou Ng, Siew Mei Wu, Ted Briscoe,
Christian Hadiwinoto, Raymond Hendy
Susanto, and Christopher Bryant. 2014. The CoNLL-2014 shared task on grammatical error correction. In Proceedings of the Eighteenth Conference on Computational Natural Lan-guage Learning: Shared Task, pages 1–14, Baltimore, Maryland. Association for Compu-tational Linguistics.
Kostiantyn Omelianchuk, Vitaliy Atrasevych,
Artem Chernodub, and Oleksandr
Skurzhanskyi. 2020. Gector – grammatical error correction: Tag, not rewrite. In Proceed-ings of the Fifteenth Workshop on Innova-tive Use of NLP for Building Educational Applications, Seattle, WA. Association for Computational Linguistics.
Michael Schuster and Kaisuke Nakajima. 2012. Japanese and korean voice search. In Proceed-ings of the IEEE Conference on Acoustics, Speech and Signal Processing.
Noam Shazeer and Mitchell Stern. 2018. Ada-factor: Adaptive learning rates with sublinear memory cost.arXiv:1804.04235.
Ashish Vaswani, Noam Shazeer, Niki Parmar, Jakob Uszkoreit, Llion Jones, Aidan N Gomez, Łukasz Kaiser, and Illia Polosukhin. 2017. Attention is all you need. In Advances in Neural Information Processing Systems, pages 6000–6010.
Marlies van der Wees, Arianna Bisazza, and Christof Monz. 2017. Dynamic data selection for neural machine translation. In Proceed-ings of the 2017 Conference on Empirical Methods in Natural Language Processing,
pages 1400–1410, Copenhagen, Denmark. Association for Computational Linguistics. Wei Wang, Isaac Caswell, and Ciprian Chelba.
2019. Dynamically composing domain-data selection with clean-data selection by ‘‘co-curricular learning’’ for neural machine trans-lation. In Proceedings of the 57th Annual Meeting of the Association for Computational Linguistics, pages 1282–1292, Florence, Italy. Association for Computational Linguistics. Wei Wang, Taro Watanabe, Macduff Hughes,
Tetsuji Nakagawa, and Ciprian Chelba. 2018. Denoising neural machine translation training with trusted data and online data selection. In Proceedings of the Third Conference on Machine Translation: Research Papers, pages 133–143, Brussels, Belgium. Association for Computational Linguistics.
Yu Wang, Yuelin Wang, Jie Liu, and Zhuo Liu. 2020. A comprehensive survey of grammar error correction. 2005.06600.
Shuyao Xu, Jiehao Zhang, Jin Chen, and Long Qin. 2019. Erroneous data generation for grammatical error correction. In Proceedings of the Fourteenth Workshop on Innovative Use of NLP for Building Educational Applications, pages 149–158, Florence, Italy. Association for Computational Linguistics.
Helen Yannakoudakis, Ted Briscoe, and Ben Medlock. 2011. A new dataset and method for automatically grading ESOL texts. In Proceed-ings of the 49th Annual Meeting of the Asso-ciation for Computational Linguistics: Human Language Technologies, pages 180–189, Port-land, Oregon, USA. Association for Computa-tional Linguistics.
Wei Zhao, Liang Wang, Kewei Shen, Ruoyu Jia, and Jingming Liu. 2019. Improving grammatical error correction via pre-training a copy-augmented architecture with unlabeled data. InProceedings of the 2019 Conference of the North American Chapter of the Associa-tion for ComputaAssocia-tional Linguistics: Human Language Technologies, Volume 1 (Long and Short Papers), pages 156–165, Minneapolis, Minnesota. Association for Computational Linguistics.