Pacific Gas and Electricity Company (PG&E) currently provides gas and electric services to Daly City homes and businesses and is regulated by the California Public Utilities Commission (CPUC). With a few exceptions, PG&E’s service area extends north to south from Eureka to Bakersfield, and east to west from the Sierra Nevada to the Pacific Ocean. The company controls 141,215 circuit miles of electric distribution lines and 18,616 circuit miles of interconnected transmission lines, as well as 42,141 miles of natural gas distribution pipelines and 6,438 miles of transportation pipelines.1
PG&E obtains its energy supplies from power plants and natural gas fields in northern California and from energy purchased outside its service area, and delivers energy through high voltage transmission lines. PG&E purchases electrical power from a variety of sources, including PG&E owned, independent, and out-of-state generators. Natural gas comes from three major sources: California, Southwestern U.S., and Canada.2 To promote the safe and reliable maintenance and operation of
utility facilities, the CPUC has mandated specific clearance requirements between utility facilities and surrounding objects or construction activities.
In 2005, the baseline year for when the County of San Mateo 2005 Community-Scale Greenhouse Gas Emissions Inventory for the City of Daly City was conducted, Daly City, compared all the cities in San Mateo County, had one of the lowest residential electricity and natural gas usage rates per customer.
1 PG&E, Company Information, available at http://www.pge.com/about/company/profile, accessed August, 2012. 2 Ibid.
Driven by high demand from California’s many motorists, major airports, and military bases, the transportation sector is the State’s largest energy consumer. More motor vehicles are registered in California than any other State, and worker commute times are among the longest in the country. California’s demand for motor gasoline was 357 million barrels in 2010. Energy for transportation comprised approximately 39 percent of all energy that the State consumed in 2009.3
In the Bay Area, as in most other places in the United States, automobiles and commercial vehicles (composed of small, medium, and large trucks) are the largest energy consumers in the transportation sector. Automobiles and commercial vehicles are generally fueled by diesel or gasoline. Other transit
3 US Energy Information Administration (EIA), Independent Statistics and Analysis, California Data
available at http://www.eia.gov/state/state-energy-profiles-data.cfm?sid=CA#Consumption, last updated January 2012, accessed February 2012.
modes in the Bay Area include ferries, buses, light rail (San Francisco MUNI and SCVTA rail cars), BART, and commuter rail (Caltrain, Amtrak, and ACE). These transit modes also consume gasoline, diesel, and electricity.
There is a general scientific consensus that global climate change is occurring, caused in whole or in part, by increased emissions of greenhouse gases (GHGs) that keep the Earth’s surface warm by trapping heat in the Earth’s atmosphere,in much the same way as glass traps heat in a greenhouse.4
Over the last 10,000 years, the rate of temperature change has typically been incremental, with warming and cooling occurring over the course of thousands of years. During this period, the earth has experienced incremental warming as glaciers retreated across the globe. However, scientists have observed an unprecedented increase in the rate of warming over the past 150 years, roughly coinciding with the global industrial revolution. While many studies show evidence of warming over the last century and predict future global warming, the precise causes of such warming and its potential effects are far less certain.5In its “natural” condition, the greenhouse effect is responsible for maintaining a habitable climate on Earth, but human activity has caused increased concentrations of these gases in the atmosphere, thereby contributing to an increase in global temperatures.
Global climate change (GCC) is currently one of the most important and widely debated scientific, economic, and political issues in the United States. The anticipated impacts of climate change on California range from water shortages to inundation from sea level rise. GCC refers to a change in the average air temperature that may be measured by wind patterns, storms, precipitation, and temperature. The baseline by which these changes are measured originates in historical records identifying temperature changes that have occurred in the distant past, such as during previous ice ages. Over the last 10,000 years, the rate of temperature change has typically been incremental, with warming and cooling occurring over the course of thousands of years. During this period, the earth has experienced incremental warming as glaciers retreated across the globe. However, scientists have observed an unprecedented increase in the rate of warming over the past 150 years, roughly coinciding with the global industrial revolution.
GCC is now a widely accepted phenomenon. While scientists are certain that human activities are changing the composition of the atmosphere and that increasing concentrations of GHGs (defined below) will change the planet’s climate, they are less certain about how much the climate will change, at what rate it will change, or what the exact global, or even regional, effects will be. Nonetheless, the world’s leading climate scientists—the IPCC6—have reached consensus that GCC is “very likely”
4 U.S. Environmental Protection Agency (US EPA), Climate Change Facts: Answers to Common Questions (webpage).
http://www.epa.gov/climatechange/facts.html, accessed July 9, 2012.
5 “Global climate change” is a broad term used to describe any worldwide, long-term change in the earth’s climate.
“Global warming” is more specific and refers to a general increase in temperatures across the earth, although it can cause other climatic changes, such as a shift in the frequency and intensity of weather events and even cooler temperatures in certain areas, even though the world, on average, is warmer.
6 The Intergovernmental Panel on Climate Change is a scientific intergovernmental body set up by the World
Meteorological Organization and by the United Nations Environment Programme. Its role is to assess on a comprehensive, objective, open and transparent basis the latest scientific, technical and socio-economic literature produced worldwide relevant to the understanding of the risk of human-induced climate change, its observed and projected impacts, and options for adaptation and mitigation.
caused by humans, and that hotter temperatures and rising sea levels will continue for centuries no matter how much humans control their future emissions. In particular, human influences have:
Very likely contributed to sea level rise and increased storm surge during the latter half of the 20th century;
Likely contributed to changes in wind patterns, affecting extra-tropical storm tracks and temperature patterns;
Likely increased temperatures of extreme hot nights, cold nights and cold days;
More likely than not increased risk of heat waves, area affected by drought since the 1970s, and frequency of heavy precipitation events.7
The IPCC predicts that global mean temperature increase from 1990-2100 could range from 2.0 to 11.5 degrees Fahrenheit. They project a sea level rise of seven to 23 inches by the end of the century, with a greater rise possible depending on the rate of polar ice sheet melting.
According to the California Climate Action Team, accelerating GCC has the potential to cause numerous adverse impacts in California, including but not limited to: a shrinking Sierra snowpack that would threaten the state’s water supply; public health threats caused by higher temperatures and more smog; damage to agriculture and forests due to reduced water storage capacity, rising temperatures, increasing salt water intrusion, flooding, and pest infestations; critical habitat modification and destruction; eroding coastlines; increased wildfire risk; and increased electricity demand.8
While all of these impacts may be felt to some extent in the Bay Area, of particular concern are sea level rise and increased storm surge with the resulting potential for increased coastal erosion, higher storm-surge flooding, more extensive coastal inundation, changes in surface water quality and groundwater characteristics, loss of property and coastal habitats, increased flood risk and potential loss of life, loss of nonmonetary cultural resources and values, impacts on agriculture and aquaculture through decline in soil and water quality, and loss of tourism, recreation, and transportation functions. Also of concern is the potential for GCC to increase fire threat at the urban-wildland interface, and the potential for an imbalance between electricity supply and demand.
Gases that trap heat in the Earth’s atmosphere are called greenhouse gases (GHGs). These gases play a critical role in determining the Earth’s surface temperature. Part of the solar radiation that enters Earth’s atmosphere from space is absorbed by the Earth’s surface. The Earth reflects this radiation back toward space, but GHGs absorb some of the radiation. As a result, radiation that otherwise would have escaped back into space is retained, resulting in a warming of the atmosphere. Without
7 Intergovernmental Panel on Climate Change (IPCC). “Summary for Policymakers,” Climate Change 2007: Synthesis Report.
Fourth Assessment Report of the Intergovernmental Panel on Climate Change. Cambridge University Press, Cambridge, United Kingdom and New York, NY, USA, November 2007.
natural GHGs, the Earth’s surface would be about 61°F cooler.9 This phenomenon is known as the
greenhouse effect. However, many scientists believe that emissions from human activities—such as electricity generation, vehicle emissions, and even farming and forestry practices—have elevated the concentration of GHGs in the atmosphere beyond naturally-occurring concentrations, contributing to the larger process of GCC. The six primary GHGs are:
Carbon Dioxide (CO2), emitted when solid waste, fossil fuels (oil, natural gas, and coal), and wood
and wood products are burned;
Methane (CH4), produced through the anaerobic decomposition of waste in landfills, animal
digestion, decomposition of animal wastes, production and distribution of natural gas and petroleum, coal production, and incomplete fossil fuel combustion;
Nitrous oxide (N2O), typically generated as a result of soil cultivation practices, particularly the use
of commercial and organic fertilizers, fossil fuel combustion, nitric acid production, and biomass burning;
Hydrofluorocarbons (HFCs), primarily used as refrigerants;
Perfluorocarbons (PFCs), originally introduced as alternatives to ozone depleting substances and
typically emitted as by-products of industrial and manufacturing processes;
Sulfur hexafluoride (SF6), primarily used in electrical transmission and distribution.
Though there are other gases that can contribute to global warming,10 these six are identified
explicitly in California legislation and litigation as being of primary concern. GHGs have varying potential to trap heat in the atmosphere, known as global warming potential (GWP), and atmospheric lifetimes. GWP ranges from one (carbon dioxide) to 23,900 (sulfur hexafluoride). GHG emissions with a higher GWP have a greater global warming effect on a molecule-by-molecule basis. For example, one ton of CH4 has the same contribution to the greenhouse effect as approximately 21 tons of CO2.11 GWP is alternatively described as “carbon dioxide equivalents,” or CO2e. The parameter “atmospheric lifetime” describes how long it takes to restore the system to equilibrium following an increase in the concentration of a GHG in the atmosphere. Atmospheric lifetimes of GHGs range from tens to thousands of years.
9 Ibid.
10 Diesel particulate matter, which is also referred to as black carbon, is a strong absorber of solar radiation; scientists have
known for many years that when black carbon particles combine with dust and chemicals in air they become more efficient in absorbing solar radiation, and black carbon mixtures may be the second biggest contributor to global warming. See California Air Resources Board, Health Effects of Diesel Particulate Matter pages 4-5, available at http://www.arb.ca.gov/research/diesel/dpm_draft_3-01-06.pdf [as of October 14, 2008].
In 2009 California emitted 457 million tons of CO2e.12 As of 2007, California accounted for 6.7 percent of all emissions in the country and ranked second highest among the states. This large number is due primarily to the sheer size of California compared to other states. By contrast, California has one of the fourth lowest per capita GHG emission rates in the country, due to the success of its energy-efficiency and renewable energy programs and commitments that have lowered the State’s GHG emissions rate of growth by more than half of what it would have been otherwise.13
California’s fuel use and GHG emissions have also been reduced due to its mild climate compared to that of many other states.
The California Air Resources Board stated in its December 2011 Greenhouse Gas Inventory that the composition of gross climate change pollutant emissions in California in 2009 (expressed in terms of CO2 equivalence) was as follows:
Carbon dioxide (CO2) accounted for 86.1 percent;
Methane (CH4) accounted for 7 percent;
Nitrous oxide (N2O) accounted for 3.3 percent;
Sulfur Hexafluoride (SF6) accounted for 0.2 percent; and
Other halogenated gases accounted for 3.3 percent.
While total emissions have increased 5.5 percent from 1990 to 2009, emissions decreased by 5.8 percent from 2008 to 2009. In 2009, transportation was the source of 38 percent of the total emissions, while the industrial sector accounted for approximately 20 percent. Electricity generation accounted for approximately 23 percent (with almost equal contributions from in-state and imported electricity).
In 2010, the Bay Area Air Quality Management District (BAAQMD) completed a baseline inventory of GHG emissions for the year 2007. According to that inventory, 95.8 million metric tons of CO2e were emitted in the Bay Area that year.14 Given a population of just over seven million, the resulting
per capita emissions were about 13.6 metric tons of CO2e. Table 3.6-2 shows the emissions breakdown by pollutant.
12 California Air Resources Board, California Greenhouse Gas Inventory, 2000-2009, December 2011, available at
http://www.arb.ca.gov/cc/inventory/inventory.htm, accessed August 2012
13 California Energy Commission (CEC), Inventory of California Greenhouse Gas Emissions and Sinks: 2000-2009 - Final
Staff Report, publication # CEC-600-2006-013-SF, Sacramento, CA, December 22, 2006; and January 23, 2007 update to that report.
14 Bay Area Air Quality Management District (BAAQMD). Source Inventory of Bay Area Greenhouse Gas Emissions, February
The Bay Area’s transportation sector contributes 37 percent of the CO2e GHG emissions, followed by industrial and commercial sources (36 percent), electricity and co-generation (16 percent), residential fuel usage (7 percent), off-road equipment (3 percent), and agriculture and farming (1 percent). Bay Area emissions by sector are illustrated in Figure 3.3-1. Of transportation emissions, 76 percent are estimated to be from cars and light duty trucks.
Absent policy changes, Bay Area GHG emissions are expected to grow at a rate of 1.4 percent a year due to population growth and economic expansion.15 Economic activity variations and the fraction
of electric power generation in the region will cause year-to-year fluctuations in the emissions trends. Figure 3.6-2 shows the emission trends projected as usual by major sources for the period of 1990 to 2029, absent policy changes.
Transportation Industrial/ Commercial Electricity/Co-Generation Residential Fuel Off-Road Equipment Agriculture 0 20 40 60 80 100 120 140 1990 1993 1996 1999 2002 2005 2008 2011 2014 2017 2020 2023 2026 2029 M ill ion M e tr ic T on s C O 2 e Year
As seen in Table 3.6-3, transportation made up the largest source of Daly City emissions in 2005, accounting for 51 percent of total emissions. Of that, 65 percent was the result of state highways. Residential energy use was the next largest source of overall emissions at 19 percent.
On April 2, 2007, in Massachusetts v. EPA, 549 U.S. 497 (2007), the Supreme Court found that greenhouse gases are air pollutants covered by the Clean Air Act. The Court held that the Administrator must determine whether or not emissions of greenhouse gases from new motor vehicles cause or contribute to air pollution which may reasonably be anticipated to endanger public health or welfare, or whether the science is too uncertain to make a reasoned decision.
On December 7, 2009, Administrator Lisa Jackson signed a final action, under Section 202(a) of the Clean Air Act, finding that six key well-mixed greenhouse gases constitute a threat to public health and welfare, and that the combined emissions from motor vehicles cause and contribute to the climate change problem.
This action was a prerequisite for implementing greenhouse gas emissions standards. Current efforts include issuing greenhouse gas emission standards for new motor vehicles, developing and implementing renewable fuel standard program regulations, proposing carbon pollution standards for new power plans, and setting greenhouse gas emissions thresholds to define when permits are required for new and existing industrial facilities under the Clean Air Act, and establishing a greenhouse gas reporting program.
This rule was proposed jointly by EPA and the National Highway Traffic Safety Administration (NHTSA) to create a National Program of GHG emission standards and Corporate Average Fuel Economy (CAFE) standards. The standards apply to passenger cars, light-duty trucks, and medium-duty passenger vehicles, covering model years 2012 through 2016. The standards are designed to
achieve a national vehicle fleet whose emissions and fuel economy performance improves year over year. The goal is to reduce CO2 emissions by 960 million metric tons and save 1.8 billion barrels of oil over the lifetime of the vehicles sold in model years 2012 through 2016.16 The final rule was
signed on April 1, 2010.
Finalized on February 3, 2010, this rule makes changes to the Renewable Fuel Standard (RFS) program, as required by the Energy Independence and Security Act of 2007. The original RFS program was designed to implement the provisions of the Energy Policy Act of 2005 (EPAct, described later). The revised statutory requirements establish new specific volume standards for cellulosic biofuel, biomass-based diesel, advanced biofuel, and total renewable fuel that must be used in transportation fuel each year. The revised statutory requirements also include new definitions and criteria for both renewable fuels and the feedstocks used to produce them, including new greenhouse gas emission thresholds for renewable fuels.
On October 5, 2009, President Obama issued Executive Order 13154, which instructs federal agencies to set or achieve various emissions reduction and energy and environmental benchmarks by 2015, 2020, and 2030. The order also sets out required reductions in vehicle fleet petroleum use and requires increases in water and energy efficiency and in recycling and waste diversion rates. The order also mandates adoption of certain contract and procurement practices designed to promote energy and water efficiency and environmentally-preferable products.
The Energy Independence and Security Act of 2007 was designed to improve vehicle fuel economy and help reduce U.S. dependence on oil. The Act establishes several key standards:
Increases the supply of alternative fuel sources by setting a mandatory Renewable Fuel Standard (RFS) requiring fuel producers to use at least 36 billion gallons of biofuel in 2022, which represents a nearly five-fold increase over current levels; and
Reduces U.S. demand for oil by setting a National Fuel Economy Standard of 35 miles per gallon by 2020—an increase in fuel economy of 40 percent.
The Energy Policy and Conservation Act (EPCA) of 1975 declared it to be U.S. policy to establish a reserve of up to 1 billion barrels of petroleum, and established nationwide fuel economy standards in order to conserve oil. Pursuant to this Act, the National Highway Traffic and Safety Administration, part of the U.S. Department of Transportation, is responsible for revising existing fuel economy standards and establishing new vehicle fuel economy standards.
16 United States Environmental Protection Agency, available at http://www.epa.gov/oms/climate/regs-light-duty.htm,
The Corporate Average Fuel Economy (CAFE) program was established to determine vehicle manufacturer compliance with the government’s fuel economy standards. Compliance with CAFE standards is determined based on each manufacturer’s average fuel economy for the portion of their vehicles produced for sale in the United States. The EPA calculates a CAFE value for each manufacturer based on city and highway fuel economy test results and vehicle sales. The CAFE values are a weighted harmonic average of the EPA city and highway fuel economy test results. Based on information generated under the CAFE program, the U.S. Department of Transportation is authorized to assess penalties for noncompliance.
CAFE rules require the average fuel economy of all vehicles of a given class that a manufacturer sells in each model year to be equal or greater than the standard. CAFE standards apply to passenger cars and light trucks (gross vehicle weight of 8,500 pounds or less). Heavy-duty vehicles (i.e. gross vehicle weight over 8,500 pounds) are not currently subject to fuel economy standards. The EPCA was reauthorized in 2000 (49 CFR 533). The Energy Independence and Security Act of 2007 revised CAFE standards for the first time in 30 years, followed quickly by Section 202 GHG Regulation of Cars and Light Duty Trucks, which calls for further revision of the CAFE standards. Both of those regulations are described above.
The Energy Policy Act of 2005 seeks to reduce reliance on non-renewable energy resources and provide incentives to reduce current demand on these resources. For example, under the Act, consumers and businesses can attain federal tax credits for purchasing fuel-efficient appliances and products. Because driving fuel-efficient vehicles and installing energy-efficient appliances can provide many benefits, such as lower energy bills, increased indoor comfort, and reduced air pollution, businesses are eligible for tax credits for buying hybrid vehicles, building energy efficient buildings, and improving the energy efficiency of commercial buildings. Additionally, tax credits are given for the installation of qualified fuel cells, stationary microturbine power plants, and solar power equipment.
This Order directs the state's Air Resources Board (ARB) to adopt regulations increasing California's Renewable Portfolio Standard (RPS) to 33 percent by 2020. The executive order provides more guidance to state regulators about how to achieve the requirement than Governor Schwarzenegger’s 2008 order (Executive Order S-14-08) establishing the 33 percent goal.
This Order calls for a statewide goal to be established to reduce the carbon intensity of California’s transportation fuels by at least 10 percent by 2020 (“2020 Target”), and that a Low Carbon Fuel Standard (“LCFS”) for transportation fuels be established for California. Further, it directs ARB to determine if an LCFS can be adopted as a discrete early action measure pursuant to AB 32, and if so, consider the adoption of a LCFS by June 30, 2007, pursuant to Health and Safety Code Section 38560.5. The LCFS applies to all refiners, blenders, producers, or importers (“Providers”) of transportation fuels in California, will be measured on a full fuels cycle basis, and may be met
through market-based methods by which Providers exceeding the performance required by a LCFS shall receive credits that may be applied to future obligations or traded to Providers not meeting the LCFS.
In June 2007, CARB approved the LCFS as a Discrete Early Action item under AB 32. The LCFS rulemaking package was filed with the Office of Administrative Law (OAL) on November 25, 2009. The OAL approved the LCFS rulemaking and filed with the Secretary of State on January 12, 2010.
This Order was to establish biomass production and use targets for California. Biomass is a large but primarily unused resource including residues from forestry, urban, and agricultural wastes and can be used to create electricity, transportation fuels, and biogas. Use of biomass could not only increase energy production but also reduce the waste stream. The Order states that biomass should comprise 20 percent of the State’s Renewables Portfolio Standard for 2010 and 2020, and California shall produce a minimum of 20 percent of its biofuels within the state by 2010, 40 percent by 2020, and 75 percent by 2050. On April 12, 2011, Governor Jerry Brown signed Senate Bill X1 2 (Simitian, Chapter 1, Statutes of 2011, First Extraordinary Session), legislatively extending the current 20 percent Renewables Portfolio Standard target in 2010 to a 33 percent Renewables Portfolio Standard by December 31, 2020, and broadening the scope of the RPS to include local publicly owned electric utilities. Additional funding and research will go to further developing these technologies and integrating them into use.
This Order recognizes California’s vulnerability to climate change, noting that increasing temperatures could potentially reduce snow pack in the Sierra Nevada, which is a primary source of the State’s water supply. Additionally, according to this Order, climate change could influence human health, coastal habitats, microclimates, and agricultural yield. The Order set the greenhouse gas reduction targets for California: By 2010, reduce GHG emissions to 2000 levels; by 2020 reduce GHG emissions to 1990 levels; by 2050 reduce GHG emissions to 80 percent below 1990 levels. This corresponds to an approximate 27 percent reduction by 2030 to 1990 levels, or 55 CO2e in total emissions which correlates to 41 percent reduction over today’s levels by 2030.
On September 30, 2008, Governor Schwarzenegger signed Senate Bill (SB) 375 into law. This legislation links transportation and land use planning with the CEQA process to help achieve the GHG emission reduction targets set by AB 32. Regional transportation planning agencies are required to include a sustainable community strategy (SCS) in regional transportation plans. The SCS must contain a planned growth scenario that is integrated with the transportation network and policies in such a way that it is feasible to achieve AB 32 goals on a regional level. SB 375 also identifies new CEQA exemptions and stream lining for projects that are consistent with the SCS and qualify as Transportation Priority Projects (TPP). TPPs must meet three requirements: 1) contain at least 50 percent residential use; commercial use must have floor area ratio (FAR) of not less than 0.75; 2) have a minimum net density of 20 units per acre; and 3) be located within one-half mile of a major transit stop or high quality transit corridor included in the regional transportation plan.
Senate Bill (SB) 97 directs the Office of Planning and Research (OPR) to prepare, develop, and transmit to the California Resources Agency guidelines for feasible mitigation of GHG emissions or the effects of GHG emissions, by July 1, 2009. The Resources Agency was required to certify and adopt amendments to the Guidelines implementing the CEQA Guidelines on or before January 1, 2010, providing regulatory guidance on the analysis and mitigation of GHG emissions in CEQA documents. California’s Natural Resources Agency adopted new guidelines on December 31, 2009, requiring lead agencies to analyze greenhouse gas emissions under section 15064.4 during their CEQA review through California.
SB 1771 requires the CEC to prepare an inventory of the state’s GHG emissions, to study data on GCC, and to provide government agencies and businesses with information on the costs and methods for reducing GHG emissions. It also established the California Climate Action Registry to serve as a certifying agency for companies and local governments to quantify and register their GHG emissions for possible future trading systems.
Assembly Bill (AB) 1493 (Pavley) amended California Health and Safety Code sections 42823 and 43018.5 requiring the California Air Resources Board (ARB) to develop and adopt, by January 1, 2005, regulations that achieve maximum feasible reduction of GHGs emitted by passenger vehicles, light-duty trucks, and other vehicles used for noncommercial personal transportation in California. The regulations apply to motor vehicles manufactured in the 2009 or later model year.
In September 2004, pursuant to AB 1493, the ARB approved regulations to reduce GHG emissions from new motor vehicles. Under the regulation, one manufacturer fleet average emission standard is established for passenger cars and the lightest trucks, and a separate manufacturer fleet average emission standard is established for heavier trucks. The regulation took effect on January 1, 2006, and set near-term emission standards, phased in from 2009 through 2012, and mid-term emission standards, phased in from 2013 through 2016 (referred to as the Pavley Phase 1 rules). The ARB intends to extend the existing requirements to obtain further reductions in the 2017 to 2020 timeframe (referred to as Pavley Phase 2 rules). The ARB has included both Pavley 1 and 2 rules in its Climate Change Proposed Scoping Plan (October 2008), pursuant to the Global Warming Solutions Act of 2006 (AB 32), which outlines the State’s strategy to achieve 2020 GHG emission reductions. After initially refusing to grant a waiver, on June 30, 2009 the EPA granted a waiver that allows California to implement these standards.
The ARB calculates that in calendar year 2016, the Pavley Phase 1 rules will reduce California’s GHG emissions by 16.4 million metric tons of carbon dioxide equivalents, and by 2020, Pavley Phase 2 would reduce emissions by 31.7 million metric tons of carbon dioxide equivalents. Further, the AB 1493 new vehicle requirements would cumulatively produce 45 percent more GHG reductions by
2020 compared to the federal CAFE standard in the Energy Independence and Security Act of 2007 (above).17
In September 2006, Governor Arnold Schwarzenegger signed Assembly Bill (AB) 32, the California Global Warming Solutions Act (Health and Safety Code Section 38500 et. seq.). The Act requires the reduction of statewide GHG emissions to 1990 levels by the year 2020. This change, which is estimated to be a 30 percent reduction from business as usual emission levels projected for 2020, will be accomplished through an enforceable statewide cap on GHG emissions that will be phased in starting in 2012. The Act also directs the ARB to develop and implement regulations to reduce statewide GHG emissions from stationary sources and address GHG emissions from vehicles. The ARB developed a Climate Change Scoping Plan, finalized in December 2008, outlining the State’s strategy to achieve 2020 greenhouse gas emission limits. The Plan proposes a comprehensive set of actions designed to reduce overall greenhouse gas emissions.
The CEC adopts and transmits to the Governor and Legislature a report of findings biannually. In 2002, the Legislature passed Senate Bill 1389. The legislation reconstituted the state’s responsibility to develop an integrated energy plan for electricity, natural gas, and transportation fuels, or Energy Report. At a Special Business Meeting on November 12, 2003, the CEC adopted the 2003 Integrated Energy Policy. The 2004 Update to the Integrated Energy Policy was adopted by the Energy Commission on November 3, 2004. The 2005 Integrated Energy Policy was adopted by the Energy Commission on November 21, 2005.
The plan calls for the state to assist in the transformation of the transportation system to improve air quality, reduce congestion, and increase the efficient use of fuel supplies with the least environmental and energy costs. To further this policy, the plan identifies a number of strategies, including assistance to public agencies and fleet operators in implementing incentive programs for Zero Emission Vehicle and addressing their infrastructure needs, and encouragement of urban design that reduces vehicle miles traveled (VMT) and accommodates pedestrian and bicycle access.
Known by the shorthand name of “Title 24”, this policy was established in 1978 in response to a legislative mandate to reduce California’s energy consumption. Title 24 is updated periodically to allow for incorporation of new energy efficiency technologies and methods. The most recent update, 2008, incorporated AB 32 mandates and advanced the energy efficiency requirements in order to meet California’s energy needs. The 2013 update to the standards will build upon the previous standards and will take effect in 2014. Several state energy policy goals drive the design of the current standards: the “Loading Order,” which directs California’s growing demand must first be met with cost-effective energy efficiency; “Zero Net Energy” (ZNE) goals for new homes by 2020 and
17 California Air Resources Board (ARB). Comparison of Greenhouse Gas Reductions for the United States and Canada Under ARB
GHG Regulations and Proposed Federal 2011-2015 Model Year Fuel Economy Standards, Addendum to February 25 Technical Assessment, 2008.
commercial buildings by 2030; Governor Brown’s Executive Order on Green Buildings; the Green Building Standards Code, and AB 32. The 2013 Standards will use 25% less energy for lighting, heating, cooling, ventilation, and water heating than the 2008 Standards. Additionally, the Standards will 170,500 tons of greenhouse gas emissions per year.
CALGreen is the green building code specific to the state of California, adopted in January 2010 and effective as of January 2011 for residential and non-residential new construction projects. This code aims to improve safety, health and general welfare of the public in California by reducing the negative impacts of construction and buildings on the environment and encouraging sustainable construction practices. Through the promotion of sustainable planning and design, energy efficiency, water efficiency and conversion, material conversion and resources efficiency and environmental quality, CALGreen aims to support a high standard for green buildings in California and lower the overall impacts that buildings pose on the environment. The code is composed of mandatory measures that must be implemented by local jurisdictions as well as voluntary measures called Tiers.
In the Bay Area, the Joint Policy Committee (JPC) coordinates the regional planning efforts of the Association of Bay Area Governments (ABAG), the BAAQMD, the San Francisco Bay Conservation and Development Commission (BCDC), and the Metropolitan Transportation Commission (MTC). In fall 2006, the JPC commenced a six-month program to study the issue of climate change and to recommend an initial set of actions to be pursued jointly by the four regional agencies. The study recommends that the regional agencies build their Joint Climate Protection Strategy in service of this key goal: To be a model for California, the nation and the world. It then organizes initial actions by six strategy elements: establish priorities, increase public awareness and motivate action, provide assistance, reduce unnecessary driving, prepare to adapt, and break old habits.18
Most recently, MTC and ABAG have started work on Plan Bay Area, which will address climate change on a regional scale in the Bay Area. This joint, long-range planning effort will culminate in the adoption of a 25-year plan in 2013. Also participating in this exercise are the Bay Area Air Quality Management District and the Bay Conservation and Development Commission. Plan Bay Area will address new requirements in California’s 2008 Senate Bill 375 (Steinberg), which calls on each of the state’s 18 metropolitan areas to reduce greenhouse gas (GHG) emissions from cars and light trucks. The mechanism for achieving these reductions will be a Sustainable Communities Strategy that promotes compact, mixed-use commercial and residential development that is walkable and bikeable and close to mass transit, jobs, schools, shopping, parks, recreation and other amenities.
18 Association of Bay Area Governments, Bay Area Air quality Management District, Bay Conservation and Development
Commission, Metropolitan Transportation Commission. Joint Policy Committee memo regarding “Bay Area Regional Agency Climate Protection Program – Consolidated Recommendations,” available at
The Daly City Climate Action Plan (CAP) seeks to reduce the City operation’s overall carbon footprint through a series of ten goals by the year 2020. The goals cover topics such as reducing solid waste, recycling and reuse of wastewater, preservation of urban forests, adoption of a master pedestrian and bicycle plan, reuse of biosolids, the use of green building standards, and community education.
Chapter 15.65 of the Daly City Municipal Code contains the green building program for new residential buildings. The purpose of the city’s Green Building Program is to encourage the conservation of natural resources, reduce waste, increase energy efficiency, lower energy use, and promote a healthy indoor environment. The Green Building Ordinance requires that new residential projects meet a minimum standard of points in accordance with Build it Green or LEED green building certification systems.
The significance criteria for this analysis were developed from criteria presented in the CEQA Guidelines (including the 2010 amendments).19 Implementation of the proposed General Plan would
have a potentially significant adverse impact if it would:
1. Result in wasteful, inefficient, and unnecessary consumption of energy;
2. Generate greenhouse gas emissions in excess of 6.6 metric tons of carbon dioxide equivalents (MTCO2e) per service population (population plus jobs); or
3. Conflict with any applicable plan, policy, or regulation adopted for the purpose of reducing greenhouse gas emissions.
The climate change analysis is conducted in response to the most recent recommendations and guidance materials from the OPR, ARB, the Attorney General, CAPCOA, and other responsible agencies. Criterion 2 is based on the level of per service population emissions needed statewide to meet the goal of reducing total greenhouse gas emissions to 1990 levels by 2020 under the California Global Warming Solutions Act of 2006 (AB 32) and to 80 percent below 1990 levels by 2050 under
192010 California Environmental Quality Act Statute and Guidelines, California Code of Regulations, Title 14, Division 6,
Executive Order S-3-05, which is 6.6 MTCO2e from all sources (residential and commercial building energy use, industrial sources, transportation, waste, agriculture, etc.).
For the first and second significance criteria, this analysis employs the concept of “service population” to account for growth in both residential population and jobs. Distributing GHG emissions across a whole service population allows the analysis to more accurately project the climate impacts of future development in the city, and the relative role that residential and non-residential activities will play.
This EIR includes Pavley Phases 1 and 2 in the energy analyses because these regulations are mandates and will be implemented during the course of the proposed General Plan implementation. This EIR uses fuel efficiency estimates for Pavley Phase 1 and Pavley Phase 2 as developed by MTC as a means of incorporating State regulations into this analysis.20 Rather than growth rates for
population, employment, and VMT supplied by ABAG and MTC, the analysis uses the projected population and employment that can be accommodated in the proposed General Plan and projections of VMT from the traffic modeling associated with implementation of the proposed General Plan.
The residential and commercial/industrial energy data for the baseline condition are provided in the 2005 Community-Wide Greenhouse Gas Emissions Inventory (2005 Inventory). The forecast for residential energy use in the 2005 Inventory is based on household growth while the forecast for commercial/industrial energy use is based on the increase of jobs. For transportation energy use, the analysis uses Kittelson’s estimates of VMT generated for existing conditions and for the year 2035 (though General Plan buildout is assumed to occur in 2030, resulting in a more conservative analysis), applies fuel efficiency assumptions to obtain fuel consumption, and multiplies by the amount of energy (in Btu) contained within a gallon of fuel. Fuel efficiency is assumed to be higher in the future than today, as a result of implementation of existing State policy. To the extent that the analysis incorporates transportation energy, it reflects a cumulative impact analysis because the projected future VMT assumes the implementation of the proposed General Plan as well as wider regional growth and development and regulatory efforts.
The analysis of greenhouse gas emissions uses a business as usual methodology to project emissions, with residential increasing at the same rate as households in the residential sector (4.76 percent) and commercial/industrial at the same rate as jobs in the commercial/industrial sector (22.60 percent). The waste sector is projected to increase at the same rate as the service population (7.79 percent).
20 Metropolitan Transportation Commission (MTC), Draft Environmental Impact Report for Transportation 2035 Plan for the San
The transportation sector is projected to increase at the same rate as VMT (29.15 percent). Agriculture is projected to remain the same, as a conservative estimate, as greenhouse uses in the city are limited and are not anticipated to expand, and expansion of the horse stables in the Skyline Planning Area is not anticipated.
Energy use under the proposed General Plan would be moderated by the application of State regulations. State regulations such as AB 1493 Pavley and SB 1078 Renewable Portfolio Standard will ensure that energy use will not be wasteful, inefficient and unnecessary. Implementation of the proposed General Plan, along with anticipated regional growth/travel and improvements in vehicle technology, would result in a decrease in per service population energy use (relative to existing conditions) from transportation, largely as a result of implementation of existing State policy. Overall, there would be a slight reduction in energy use per service population, indicating that the impact of the proposed General Plan on energy use is less than significant.
Greenhouse Gas emissions under proposed General Plan buildout is estimated to be approximately 5.2 MTCO2e per service population. However this is a conservative analysis and does not take into account Pavley 1 and 2 nor the application of state/local programs and policies in the proposed General Plan supporting mixed use and increasing mode share of alternative transportation methods (walking, cycling, and transit), which would further reduce this number. While regional GHG emissions are a significant cumulative impact, these findings indicate that the proposed General Plan would result in less than 6.6 MTCO2e per service population, and does not make a considerable contribution to the overall cumulative impact.
The proposed General Plan does not conflict with any of the actions in the Scoping Plan developed by ARB under AB 32 and is consistent with measures in the Bay Area 2010 Clean Air Plan, resulting in a less than significant impact in regard to existing GHG plans, policies and regulations.
Implementation of the proposed General Plan will not result in wasteful, inefficient and
unnecessary consumption of energy. (Less than Significant)
The analysis of electricity and natural gas consumption uses a business as usual methodology to project future demand, with electricity and natural gas use increasing at the same rate as households in the residential sector and at the same rate as jobs in the commercial/industrial sector. Table 3.6-4 shows that the increase in annual GBtu by 2030 with proposed General Plan scenario.
Since energy is projected to grow at the same rate as population and jobs, per capita and per job energy use remains constant for electricity and natural gas. Therefore, development considered under the proposed General Plan could potentially increase the total demand for gas and electrical services. Despite the business as usual approach in this analysis, it is expected that energy efficiency will improve in the future. New development under the proposed General Plan would have to adhere to California’s Energy Efficiency Standards for Residential and Nonresidential Buildings (Title 24, Part 6) and CALgreen Code (Title 24, Part 11), which outlines improved site planning and building design as well as energy conservation measures, ensuring that energy use will not be wasteful, inefficient, or unnecessary. As improvements in energy efficiency due to Title 24 are difficult to quantify, especially at the plan level, Table 3.6-4 does not account for energy improvements under Title 24.
In addition, state-led or state-induced energy efficiency strategies included in the AB 32 Scoping Plan will also help ensure that energy use will not be wasteful, inefficient, and unnecessary. Established in 2002 in Senate Bill 1078, the Renewable Portfolio Standard (RPS) directs utility providers to increase the portion of energy that comes from renewable sources to 20 percent by 2010 and to 33 percent by 2020. A June 2009 report from the California Public Utilities Commission indicated that it is unlikely that the State and its investor-owned utilities will be able to reach the RPS goal of 33 percent by 2020. According to state assessments, the forecast assumes that energy providers will achieve a 26 percent renewable portfolio by 2020.
Analysis of transportation energy use considers projected VMT resulting from both regional growth and growth within the Planning Area. VMT is expected to increase from 1,999,751 daily VMT to 2,582,619 daily VMT in 2030 with the proposed General Plan. Under the future No Project condition (i.e., if the current General Plan were to remain in effect through 2030), daily VMT would increase to 2,577,085. As shown in Table 3.6-5, while VMT will increase considerably from 2008 to 2030 both under the proposed Plan and under the No Project scenario, the GBtu per service population will actually decline in that time period. This is because enforcement of the Pavley fuel efficiency regulations (which are consistent with and reinforced by new federal CAFE standards) is expected to cause greater fuel efficiency across the fleet, which means using less energy per mile traveled. The result is that total direct transportation energy use per service population is projected to decrease slightly, from 0.044 GBtu annually under existing conditions to 0.034 GBtu annually under both the proposed General Plan and No Project conditions in 2030.
When looking at residential, commercial, and transportation energy use together, it is shown that overall there is expected to be an 18 percent decrease in energy use per service population, as shown in Table 3.6-6. Overall, this analysis of residential, commercial, and transportation energy use concludes that the proposed General Plan’s contributions to inefficient energy use are less than significant.
Policy HE-23: Gradually increase energy and water efficiency standards for all new and existing housing while minimizing the costs of such standards.
Task HE-23.1: Develop enhanced residential energy efficiency standards (Title 24, California Administrative Code) in all new residential construction which exceeds State-mandated requirements by five percent in 2015, ten percent in 2020, and twenty percent in 2030.
Task HE-23.2: Establish energy and water efficiency upgrade programs that promote energy and water efficiency upgrades in all existing residential buildings. Energy efficiency upgrades promoted as part of this program could include upgrades such as attic insulation, programmable thermostats, heating duct insulation, and water heater insulation. Water efficiency upgrades could include the installation of low-flow shower heads, where feasible, and retrofit of existing toilets to meet low-flush requirements as established by the City. Examples of programs developed as a part of this task could provide financial incentives (e.g., rebates, appliance buy-back, and similar programs) aimed at providing strong incentives to residential building owners to use the programs.
Policy HE-24: Mandate the inclusion of green building techniques into most new construction.
Task HE-24.1: Amend the building code to require the inclusion of mandatory green building standards for all new construction and remodels that exceed a certain valuation (to be determined at the time of the building code amendment).
Task HE-24.2: Amend the building code to require all City-funded affordable housing projects reach a Home Energy Rating System (HERS) score above 86 (the minimum Energy Star rating), or equivalent.
Policy HE-28: Promote alternative sources of energy in all homes.
Task HE-28.1: Reduce or eliminate permit fees for installations involving solar electric, wind and solar hot water systems.
Task HE-28.2: Encourage, incentivize, or require all new major construction projects to pre-plumb for solar hot water and pre-wire for solar electric systems.
Task HE-28.3: Develop a funding source to offer loans to residents and developers that invest in solar electric, solar hot water, wind, and/or other clean energy systems.
Task HE-28.4: Amend the Zoning Ordinance to include development standards for the installation of alternative energy generating systems on residential properties.
Implementation of the proposed General Plan will result in a ratio of carbon dioxide
equivalent emissions to service population not exceeding 6.6 MTCO2e. (Less than
Significant)
Concurrent implementation of the proposed General Plan and forecast development of residential and employment land uses in the region could result in increased GHG emissions, thereby contributing to GCC. It is reasonable to generalize that GCC is a significant cumulative impact, as the scientific community has acknowledged its detrimental effects on ecosystems and human communities, and it is caused by the cumulative GHG emissions from human activities. Furthermore, as GCC is accelerated by GHG emissions, any emissions in addition to what exists today in the atmosphere can generally be considered to contribute somewhat to this significant cumulative impact. For the purposes of this EIR, this analysis makes a determination about whether the proposed General Plan makes a cumulatively considerable contribution to the overall significant cumulative impact.
Under the proposed General Plan, future emissions in Daly City are estimated to increase from around 555,027 metric tons of CO2e in 2005 to 667,306 metric tons of CO2e in 2030, without considering application of Pavley 1 and 2. Table 3.6-7 shows the increases in each sector. While overall GHG emissions are expected to increase, resulting in an increase of emissions per service population from 4.7 metric tons of CO2e in 2005 to 5.2 metric tons of CO2e in 2030, the emissions per service population will remain below 6.6 metric tons of CO2e in 2030.
There are several State mandates and local programs that will further reduce GHG emissions. The Office of the California Attorney General has a list of measures to offset or reduce global warming impacts and several of these measures would be implemented with the proposed General Plan.21
21 Office of the California Attorney General. Global Warming Measures, Updated December 9, 2008, available at
Recommended measures include: adopt land use designations to carry out policies designed to reduce greenhouse gas emissions, policies to minimize or reduce VMT, expand development near existing public transportation corridors, encourage alternative modes of transportation, and increase infill, mixed use, and higher density development. Additionally, identify and facilitate the development of land uses not already present in local districts – such as residential uses in business districts or supermarkets, parks and recreation fields, and schools in neighborhoods– to reduce vehicle miles traveled and allow bicycling and walking to these destinations.
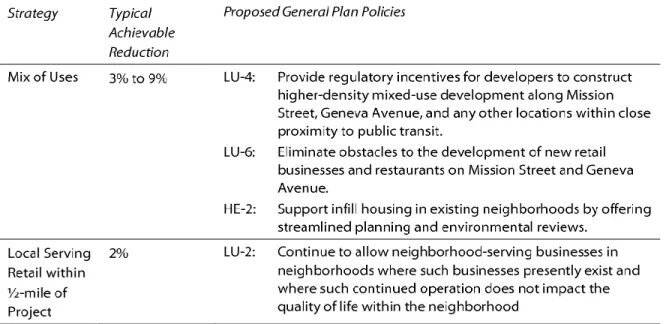
The BAAQMD 2012 CEQA Air Quality Guidelines also contains a list of strategies and measures that would reduce operational-related emissions of criteria air pollutants, precursors, and GHGs from mobile, area, and stationary sources as well as estimated emission reductions for each measure. Table 3.6-8 shows a list of the relevant measures and demonstrates how the proposed General Plan includes these measures. For a conservative analysis, these GHG measures are not included in the calculation of emissions, though as outlined below, several would apply within the city.
For a conservative analysis, these GHG emission reduction measures are not included in the calculation of emissions, and the proposed General Plan does not exceed the established threshold independent of any of these additional measures. However, they are included here in order to demonstrate how policies in the proposed General Plan will help reduce GHGs even beyond the reductions made possible through State-required fuel efficiency standards.
As described above, GHG emissions are in and of themselves a significant cumulative impact. However, due to emission reductions that would result from State regulations and the implementation of the proposed Plan, emissions in 2030 would not exceed 6.6 metric tons of CO2e. This indicates that the proposed General Plan does not make a considerable contribution to the impact. In addition, policies in the General Plan related to promoting mixed use, alternative modes of transportation, and energy efficiency will help reduce GHG, though these effects are not quantified.
The policies highlighted in Table 3.6-8 help to alleviate the cumulative impact.
None required.
Implementation of the proposed General Plan would not conflict with an applicable plan,
policy or regulation adopted for the purpose of reducing GHG emissions. (No Impact)
Under AB 32, which requires a statewide reduction of GHG emissions to 1990 levels by 2020, ARB has developed a Scoping Plan outlining the State’s strategy to achieve the 2020 GHG emissions limit,
which proposes a comprehensive set of actions designed to reduce overall GHG emissions in California. AB 32 does not require individual sectors or jurisdictions to reduce emissions by a specific amount. However, as discussed for Impact 3.6-1, Daly City transportation GHG emissions will be reduced to below current levels as a result of State mandates. And as discussed for Impact 3.6-2, Daly City overall GHG emissions in 2030 under the proposed General Plan will be below 6.6 metric tons of CO2e.
GHG emissions would be further reduced as a result of implementing policies in the proposed General Plan. These reductions will assist California in achieving its reduction goal; therefore the proposed Plan does not conflict with AB 32, resulting in less than significant impacts. In addition, the Bay Area 2010 Clean Air Plan provides a comprehensive plan to help reduce greenhouse gas emissions. The proposed Plan policies conform to the control strategies included in the Bay Area 2010 Clean Air Plan. These policies are detailed in Table 3.2-6 in Section 3.2, Air Quality, and show that the proposed General Plan is consistent with the 2010 Bay Area Clean Air Plan control measures, therefore resulting in no impact.