Chapter 4
The GANTT Procedure
Chapter Table of Contents
OVERVIEW . . . 353
GETTING STARTED . . . 356
SYNTAX . . . 360
Functional Summary . . . 361
PROC GANTT Statement . . . 365
BY Statement . . . 368
CHART Statement . . . 368
ID Statement . . . 394
DETAILS . . . 395
Schedule Data Set . . . 395
Missing Values in Input Data Sets . . . 397
Specifying the PADDING= Option . . . 398
Page Format . . . 399
Multiple Calendars and Holidays . . . 400
Full-Screen Version . . . 402
Graphics Version . . . 406
Specifying the Logic Options . . . 416
Automatic Text Annotation . . . 423
Web Enabled Gantt Charts . . . 428
Mode-Specific Differences . . . 428
Output . . . 429
Computer Resource Requirements . . . 433
EXAMPLES . . . 434
Line-Printer Examples . . . 434
Example 4.1 Printing a Gantt Chart . . . 434
Example 4.2 Customizing the Gantt Chart . . . 438
Graphics Examples . . . 441
Example 4.3 Marking Holidays . . . 442
Example 4.4 Marking Milestones and Special Dates . . . 446
Example 4.5 Using the COMPRESS Option . . . 448
Example 4.6 Using the MININTERVAL= and SCALE= Options . . . 449
Example 4.8 Variable Length Holidays . . . 454
Example 4.9 Multiple Calendars . . . 457
Example 4.10 Plotting the Actual Schedule . . . 460
Example 4.11 Comparing Progress against a Baseline Schedule . . . 463
Example 4.12 Using the COMBINE option . . . 465
Example 4.13 Plotting the Resource-Constrained Schedule . . . 467
Example 4.14 Specifying the Schedule Data Directly . . . 469
Example 4.15 BY Processing . . . 471
Example 4.16 Gantt Charts by Persons . . . 475
Example 4.17 Using the HEIGHT= and HTOFF= Options . . . 478
Example 4.18 Drawing a Logic Gantt Chart Using AON Representation . . . 479
Example 4.19 Specifying the Logic Control Options . . . 481
Example 4.20 Nonstandard Precedence Relationships . . . 488
Example 4.21 Using the SAS/GRAPH ANNOTATE= Option . . . 491
Example 4.22 Using the Automatic Text Annotation Feature . . . 497
Example 4.23 Multiproject Gantt Charts . . . 500
Example 4.24 Multi-Segment Gantt Charts . . . 502
Example 4.25 Zoned Gantt Charts . . . 505
Example 4.26 Web Enabled Gantt Charts . . . 507
Statement and Option Cross Reference Tables . . . 511
Chapter 4
The GANTT Procedure
Overview
The GANTT procedure produces a Gantt chart that is a graphical scheduling tool for the planning and control of a project. In its most basic form, a Gantt chart is a bar chart that plots the tasks of a project versus time. PROC GANTT displays a Gantt chart corresponding to a project schedule such as that produced by the CPM procedure or one that is input directly to the procedure, and it offers several options and statements for tailoring the chart to your needs.
Using PROC GANTT, you can plot the predicted early and late schedules and identify critical, supercritical, and slack activities. In addition, you can visually monitor a project in progress with the actual schedule and compare the actual schedule against a target baseline schedule. You can also graphically view the effects of scheduling a project subject to resource limitations. Any combination of these schedules can be viewed simultaneously (provided the relevant data exist) together with any user-specified variables of interest, such as project deadlines and other important dates. PROC GANTT enables you to display the early, late, and actual schedules in a single bar to produce a more meaningful schedule for tracking an activity in progress. PROC GANTT can display the project logic on the Gantt chart by exhibiting depen-dencies between tasks using directed arcs to link related activities. You can use either the Activity-on-Arc (AOA) or Activity-on-Node (AON) style of input for defining the project network. In addition, the GANTT procedure recognizes nonstandard prece-dence types. With PROC GANTT, you can display weekends, holidays, and multiple calendars, and you can depict milestones, reference lines, and a timenow line on the chart. PROC GANTT enables you to annotate text and graphics on the Gantt chart and provides you with a wide variety of options to control and customize the graphi-cal appearance of the chart.
The GANTT procedure also supports an automatic text annotation facility that is designed specifically for labeling Gantt charts independently of the SAS/GRAPH Annotate facility. It enables you to display label strings with a minimum of effort and data entry while providing the capability for more complex chart labeling situations. An important feature of this facility is the ability to link label coordinates and text strings to variables in the Schedule data set. This means that you can preserve the Label data set even though the schedule dates may change. Several options enable you to customize the annotation, such as the clipping of text strings that run off the page or the chart and the specification of a split character to split labels that are too long.
can generate zoned Gantt charts with several options to control its appearance. You can display a zone variable column as well as draw a line demarcating the different zones. You can also control the bar height and bar offset of each type of schedule bar. This enables you to change the display order of the schedules as well as giving you the capability to produce a Gantt chart with embedded bars. You can override the default schedule bar pattern assignments at the activity level. In addition, you can restrict the schedule types to which the specified pattern is to be applied to. You can also override the text color for selected columns of activity text at the activity level. These features facilitate the production of multiproject and multiprocess Gantt charts. Finally, you can also associate HTML pages with activity bars and create web enabled Gantt charts.
The GANTT procedure enables you to control the number of pages output by the procedure in both horizontal and vertical directions. In addition, you can control the number of jobs displayed per page as well as the number of tickmarks displayed per page. You can display ID variables on every page and even let the procedure display the maximum number of ID variables that can fit on one page. You can number the pages, justify the Gantt chart in the horizontal and vertical directions with respect to the page boundaries, and, maintain the original aspect ratio of the Gantt chart on each page.
PROC GANTT gives you the option of displaying the Gantt chart in one of three modes: line-printer, full-screen or graphics mode. The default mode is graphics mode, which enables you to produce charts of high resolution quality. Graphics mode requires SAS/GRAPH software. See the “Graphics Version” section on page 406 for more information on producing high-quality Gantt charts. You can also pro-duce line-printer quality Gantt charts by specifying the LINEPRINTER option in the PROC GANTT statement. In addition to submitting the output to either a plotter or printer, you can view the Gantt chart at the terminal in full-screen mode by specify-ing the FULLSCREEN option in the PROC GANTT statement. See the “Full-Screen Version” section on page 402 for more information on viewing Gantt charts in full-screen mode. The GANTT procedure also produces a macro variable that indicates the status of the invocation and also contains other useful statistics about the Gantt charts generated by the invocation.
There are several distinctive features that characterize the appearance of the chart produced by the GANTT procedure:
The horizontal axis represents time, and the vertical axis represents the se-quence of observations in the data set.
Both the time axis and the activity axis can be plotted across more than one page.
The procedure automatically provides extensive labeling of the time axis, en-abling you to determine easily the exact time of events plotted on the chart. The labels are determined on the basis of the formats of the times being plotted. You can also specify user-defined formats for the labeling.
In graphics mode, the COMPRESS option in the CHART statement enables you to produce the entire Gantt chart on one page. The PCOMPRESS option enables you to produce the entire Gantt chart on one page while maintaining the
Overview 355
original aspect ratio of the Gantt chart. Both these options work in conjunction with the HPAGES= and VPAGES= options, which specify the number of pages in the horizontal and vertical directions for the chart.
Project information is communicated into PROC GANTT via SAS data sets. The input data sets used by PROC GANTT are as follows:
The Schedule data set contains the early, late, actual, resource-constrained, and baseline schedules and any other related information. The activity-related information can include precedence information, calendar used by the activity, special dates, and any other information that you want to identify with each activity. This data set can be the same as the Schedule data set produced by PROC CPM, or it can be created separately by a DATA step. Each observation in the Schedule data set represents an activity and is plotted on a separate row of the chart unless activity splitting during resource-constrained scheduling has caused an activity to split into disjoint segments. For details regarding the output format in this case, see the “Displayed Output” section on page 429. The Precedence (Logic) data set contains the precedence information of the
project in AON format in order to draw a Logic Gantt chart of the project. Specifying this data set is not necessary if the precedence information exists in the Schedule data set. If the data set is specified, however, the ACTIVITY variable must exist in both the Schedule and Precedence data sets.
Typically you would use this feature when scheduling in PROC CPM with non-standard precedence constraints where the LAG variables are not transferred to the Schedule data set or with the COLLAPSE option. Setting the Precedence data set for PROC GANTT to be the Activity data set (used in PROC CPM) establishes the required precedence relationships. This is also a convenient feature when drawing several Gantt charts for the same project with different schedule information (such as when monitoring a project in progress). Specify-ing a Precedence data set avoids havSpecify-ing to duplicate the precedence information in every Schedule data set.
The Label data set contains the label information of the project that enables you to to draw labeled Gantt charts independently of the SAS/GRAPH Anno-tate facility. It requires a minimum of effort and provides you with a convenient mechanism to link label strings and their coordinates to variables in the Sched-ule data set. Another convenient feature is its ability to replicate labels across all activities. Both these features facilitate reuse of the Label data set.
The Workday and the Calendar data sets together enable you to represent any type of work pattern, during a week and within each day of the week, on the Gantt chart. The same Workday and Calendar data sets used by PROC CPM can also be passed to PROC GANTT.
The Holiday data set enables you to associate standard holidays and vacation periods with each calendar and represent them on the Gantt chart. Like the Workday and Calendar data sets, the same Holiday data set used by PROC CPM can also be used by PROC GANTT.
The Annotate data set contains the graphics and text that are to be annotated on the Gantt chart. This data set is used by the GANTT procedure in conjunc-tion with the Annotate facility in SAS/GRAPH software.
The GANTT procedure produces one output data set.
The Imagemap data set contains the outline cooordinates for the schedule bars used in the Gantt chart that can be used to generate HTML MAP tags.
When displaying the precedence relationships between activities on the Gantt chart, bear in mind the following facts with regard to data sets used by PROC GANTT:
The Schedule data set (and optionally the Precedence data set) contains the variables that define the precedence relationships between activities in the project.
You can handle nonstandard precedence constraints in PROC GANTT when using AON format by identifying the LAG variables in the CHART statement.
When you use PROC CPM to produce the schedule for a project with non-standard precedence relationships, the LAG variables are not automatically in-cluded in the Schedule data set. Use an ID statement or the XFERVARS option in the PROC CPM statement to add them.
When you generate the schedule using PROC CPM with the COLLAPSE op-tion, it is recommended that you use the Activity data set to define the prece-dence relationships for the Gantt procedure by specifying the PRECDATA= option in the PROC GANTT statement. This ensures that all the relevant prece-dence information is extracted.
Each option and statement available in the GANTT procedure is explained in the “Syntax” section on page 360. The “Examples” section illustrates most of these options and statements.
Getting Started
In order to draw a Gantt chart, at the very minimum, you need a Schedule data set. This data set is expected to be similar to the OUT= Schedule data set produced by PROC CPM, with each observation representing an activity in the project. It is pos-sible to obtain a detailed Gantt chart by specifying the single statement
PROC GANTTDATA= SASdataset ;
Getting Started 357
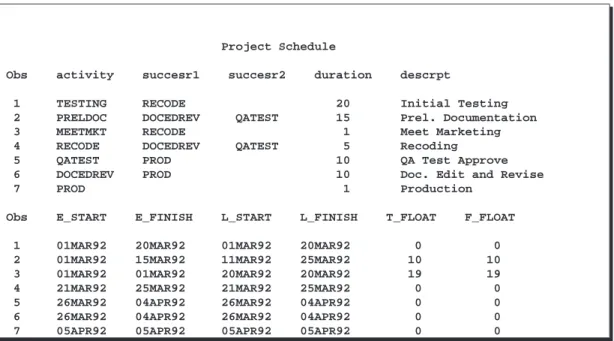
As an example of this, consider the software development project in the “Getting Started” section in Chapter 2 “The CPM Procedure.” The output schedule for this example is saved in a data set,INTRO1, which is displayed in Figure 4.1.
Project Schedule
Obs activity succesr1 succesr2 duration descrpt
1 TESTING RECODE 20 Initial Testing
2 PRELDOC DOCEDREV QATEST 15 Prel. Documentation
3 MEETMKT RECODE 1 Meet Marketing
4 RECODE DOCEDREV QATEST 5 Recoding
5 QATEST PROD 10 QA Test Approve
6 DOCEDREV PROD 10 Doc. Edit and Revise
7 PROD 1 Production
Obs E_START E_FINISH L_START L_FINISH T_FLOAT F_FLOAT
1 01MAR92 20MAR92 01MAR92 20MAR92 0 0
2 01MAR92 15MAR92 11MAR92 25MAR92 10 10
3 01MAR92 01MAR92 20MAR92 20MAR92 19 19
4 21MAR92 25MAR92 21MAR92 25MAR92 0 0
5 26MAR92 04APR92 26MAR92 04APR92 0 0
6 26MAR92 04APR92 26MAR92 04APR92 0 0
7 05APR92 05APR92 05APR92 05APR92 0 0
Figure 4.1. Software Project Plan
The following code produces the Gantt chart shown in Figure 4.2.
proc gantt lineprinter data=intro1; run;
The DATA= option could be omitted if theINTRO1data set is the most recent data set created; by default, PROC GANTT uses the– LAST– data set.
Line-Printer Gantt Chart
MAR MAR MAR MAR MAR MAR MAR MAR MAR MAR MAR MAR MAR MAR MAR MAR APR APR APR Job 01 03 05 07 09 11 13 15 17 19 21 23 25 27 29 31 02 04 06 -+--+--+--+--+--+--+--+--+--+--+--+--+--+--+--+--+--+--+-| | 1 |*=======================================* | | | 2 |<---<--->...> | | | 3 |<->...<.> | | | 4 | *=========* | | | 5 | *===================* | | | 6 | *===================* | | | 7 | *=*| | | -+--+--+--+--+--+--+--+--+--+--+--+--+--+--+--+--+--+--+-LEGEND Symbol Explanation
<---> Duration of a Normal Job
>....> Slack Time for a Normal Job
*====* Duration of a Critical Job
Figure 4.2. Line-Printer Gantt Chart
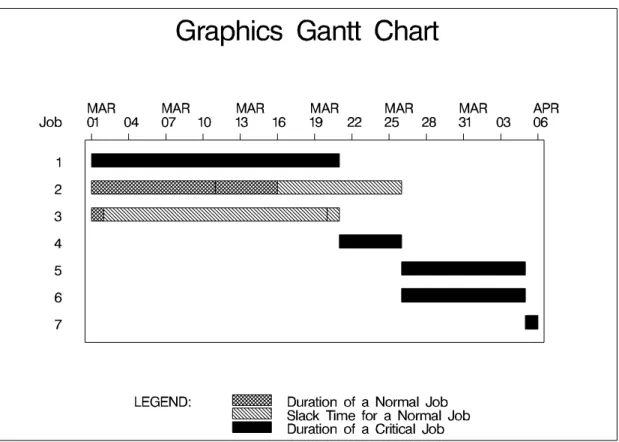
You can produce a high-resolution graphics quality Gantt chart by specifying the GRAPHICS option instead of the LINEPRINTER option in the PROC GANTT state-ment. Graphics mode is also the default display mode. The resulting Gantt chart is shown in Figure 4.3.
proc gantt graphics data=intro1; run;
Getting Started 359
Figure 4.3. Graphics Gantt Chart
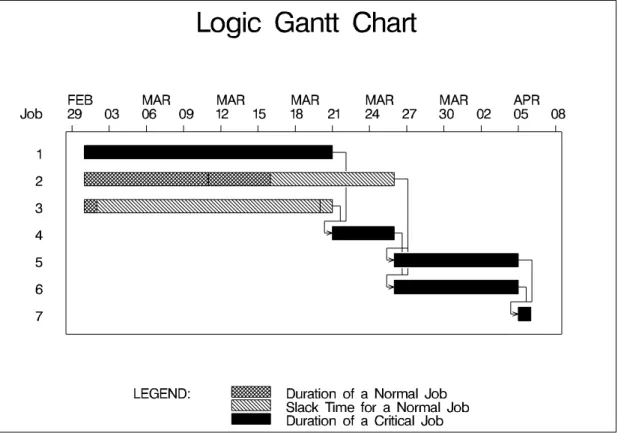
Finally, you can draw a Logic Gantt chart by defining the precedence information to PROC GANTT via AON format using the ACTIVITY= and SUCCESSOR= options in the CHART statement. The Logic Gantt chart is shown in Figure 4.4.
proc gantt data=intro1;
chart / activity=activity successor=(succesr1-succesr2); run;
Figure 4.4. Logic Gantt Chart
For further examples illustrating typical invocations of the GANTT procedure when managing projects, see Chapter 1 “Introduction to Project Management.”
Syntax
The following statements are used in PROC GANTT:
PROC GANTToptions ;
BYvariables ;
CHARTspecifications / options ;
Functional Summary 361
Functional Summary
The following tables outline the options available for the GANTT procedure classi-fied by function.
Table 4.1. Axis Formatting Options
Description Statement Option
increment for labeling axis CHART INCREMENT=
ending time for axis CHART MAXDATE=
starting time for axis CHART MINDATE=
smallest interval identified on chart CHART MININTERVAL= suppress time portion of datetime tickmark CHART NOTMTIME number of columns per mininterval CHART SCALE= use first plot variable format for tickmarks CHART USEFORMAT Table 4.2. Bar Enhancement Options
Description Statement Option
actual bar height CHART ABARHT=
actual bar offset CHART ABAROFF=
default bar height CHART BARHT=
default bar offset CHART BAROFF=
baseline bar height CHART BBARHT=
baseline bar offset CHART BBAROFF=
color of connect line CHART CHCON=
early/late bar height CHART EBARHT=
early/late bar offset CHART EBAROFF=
holiday bar height CHART HBARHT=
holiday bar offset CHART HBAROFF=
character for drawing connect line CHART HCONCHAR= draw a horizontal connect line CHART HCONNECT characters for drawing schedule CHART JOINCHAR= linestyle of connect line CHART LHCON= suppress pattern variable for bar fills CHART NOPATBAR overprint character for schedule variables CHART OVERLAPCH= overprint character for CHART variables CHART OVPCHAR= schedule types that use pattern variable CHART PATLEVEL= pattern variable for bar fills and text color CHART PATTERN=
resource bar height CHART RBARHT=
resource bar offset CHART RBAROFF=
Table 4.3. Calendar Options
Description Statement Option
calendar identifier CHART CALID= length of workday CHART DAYLENGTH= beginning of workday CHART DAYSTART= mark all breaks in a day CHART MARKBREAK mark all nonworking days CHART MARKWKND Table 4.4. Data Set Options
Description Statement Option
Annotate data set GANTT ANNOTATE= CHART ANNOTATE= Calendar data set GANTT CALEDATA= Schedule data set GANTT DATA= Holiday data set GANTT HOLIDATA=
Label data set GANTT LABDATA=
Precedence (Logic) data set GANTT PRECDATA= Imagemap output data set GANTT IMAGEMAP= Work pattern data set GANTT WORKDATA= Table 4.5. Graphics Catalog Options
Description Statement Option
description of catalog entry CHART DESCRIPTION= name of graphics catalog GANTT GOUT=
name of catalog entry CHART NAME= Table 4.6. Holiday Options
Description Statement Option
character for plotting holidays CHART HOLICHAR= holiday start variable CHART HOLIDAY= holiday duration variable CHART HOLIDUR= holiday finish variable CHART HOLIEND= holiday duration units CHART HOLINTERVAL= Table 4.7. ID Variable Options
Description Statement Option
number of columns between ID variables CHART BETWEEN= mark critical activities CHART CRITFLAG activity text columns that use pattern color CHART CTEXTCOLS= allow duplicate ID values CHART DUPOK display ID variables on every page CHART IDPAGES maximize number of ID variables on page CHART MAXIDS
suppress job number CHART NOJOBNUM
split character for dividing ID labels GANTT SPLIT=
Functional Summary 363
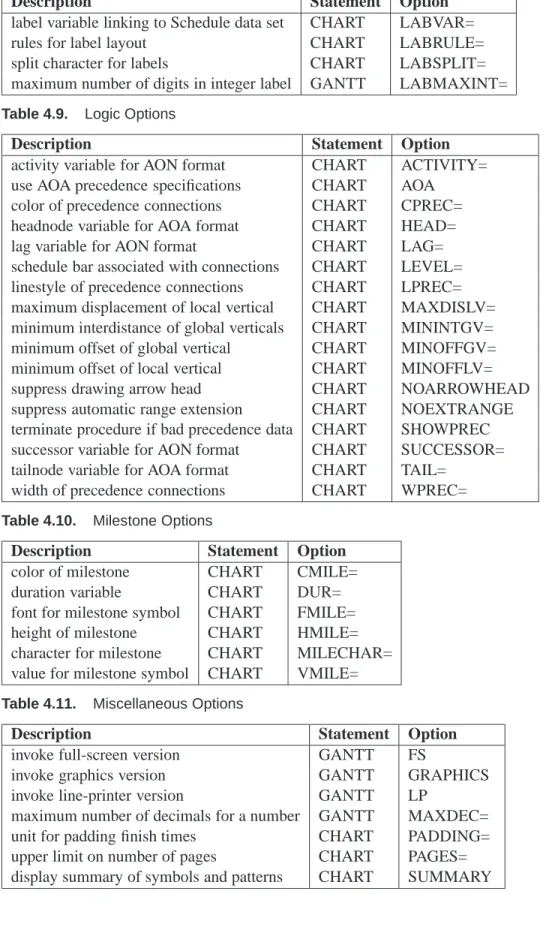
Table 4.8. Labeling Options
Description Statement Option
label variable linking to Schedule data set CHART LABVAR=
rules for label layout CHART LABRULE=
split character for labels CHART LABSPLIT= maximum number of digits in integer label GANTT LABMAXINT= Table 4.9. Logic Options
Description Statement Option
activity variable for AON format CHART ACTIVITY= use AOA precedence specifications CHART AOA
color of precedence connections CHART CPREC= headnode variable for AOA format CHART HEAD= lag variable for AON format CHART LAG= schedule bar associated with connections CHART LEVEL= linestyle of precedence connections CHART LPREC= maximum displacement of local vertical CHART MAXDISLV= minimum interdistance of global verticals CHART MININTGV= minimum offset of global vertical CHART MINOFFGV= minimum offset of local vertical CHART MINOFFLV= suppress drawing arrow head CHART NOARROWHEAD suppress automatic range extension CHART NOEXTRANGE terminate procedure if bad precedence data CHART SHOWPREC successor variable for AON format CHART SUCCESSOR= tailnode variable for AOA format CHART TAIL=
width of precedence connections CHART WPREC= Table 4.10. Milestone Options
Description Statement Option
color of milestone CHART CMILE= duration variable CHART DUR= font for milestone symbol CHART FMILE= height of milestone CHART HMILE= character for milestone CHART MILECHAR= value for milestone symbol CHART VMILE= Table 4.11. Miscellaneous Options
Description Statement Option
invoke full-screen version GANTT FS
invoke graphics version GANTT GRAPHICS
invoke line-printer version GANTT LP
maximum number of decimals for a number GANTT MAXDEC= unit for padding finish times CHART PADDING= upper limit on number of pages CHART PAGES= display summary of symbols and patterns CHART SUMMARY
Table 4.12. Page Layout Options
Description Statement Option
position chart at bottom of page CHART BJUST
color for drawing axes CHART CAXIS=
color for frame fill CHART CFRAME=
draw chart on one page in graphics mode CHART COMPRESS fill each page as much as possible CHART FILL
characters for table outlines and dividers CHART FORMCHAR= number of pages spanning time axis CHART HPAGES=
left justify chart CHART LJUST
line width CHART LWIDTH=
number of activities on each page CHART NJOBS=
suppress frame CHART NOFRAME
suppress legend CHART NOLEGEND
number of tickmarks on each page CHART NTICKS= display page number at upper right corner CHART PAGENUM draw chart proportionally on one page CHART PCOMPRESS
right justify chart CHART RJUST
number of rows between consecutive activities CHART SKIP= position chart at top of page CHART TJUST number of pages spanning activity axis CHART VPAGES= Table 4.13. Reference Line Options
Description Statement Option
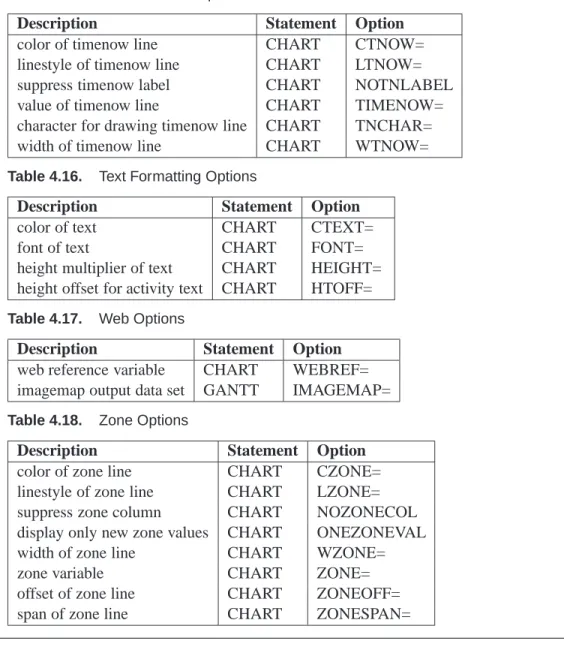
color of reference lines CHART CREF= values of reference lines CHART REF= character for drawing reference line CHART REFCHAR= label reference lines CHART REFLABEL Table 4.14. Schedule Selection Options
Description Statement Option
actual start variable CHART AS=
actual finish variable CHART AF=
baseline start variable CHART BS=
baseline finish variable CHART BF= concatenate early/late and actual schedules CHART COMBINE
early start variable CHART ES=
early finish variable CHART EF=
late start variable CHART LS=
late finish variable CHART LF=
resource-constrained start variable CHART SS= resource-constrained finish variable CHART SF=
PROC GANTT Statement 365
Table 4.15. Timenow Line Options
Description Statement Option
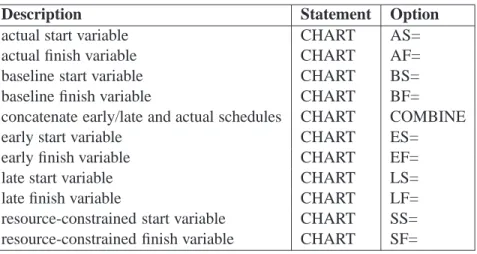
color of timenow line CHART CTNOW= linestyle of timenow line CHART LTNOW= suppress timenow label CHART NOTNLABEL value of timenow line CHART TIMENOW= character for drawing timenow line CHART TNCHAR= width of timenow line CHART WTNOW= Table 4.16. Text Formatting Options
Description Statement Option
color of text CHART CTEXT=
font of text CHART FONT=
height multiplier of text CHART HEIGHT= height offset for activity text CHART HTOFF= Table 4.17. Web Options
Description Statement Option
web reference variable CHART WEBREF= imagemap output data set GANTT IMAGEMAP= Table 4.18. Zone Options
Description Statement Option
color of zone line CHART CZONE= linestyle of zone line CHART LZONE= suppress zone column CHART NOZONECOL display only new zone values CHART ONEZONEVAL width of zone line CHART WZONE=
zone variable CHART ZONE=
offset of zone line CHART ZONEOFF= span of zone line CHART ZONESPAN=
PROC GANTT Statement
PROC GANTToptions ;
The following options can appear in the PROC GANTT statement. ANNOTATE=SASdataset
ANNO=SASdataset
specifies the input data set that contains the appropriate Annotate variables for the purpose of adding text and graphics to the Gantt chart. The data set specified must be an Annotate-type data set. See also the “Annotate Processing” section on page 407 for information specifically on annotate processing with the GANTT procedure. The data set specified with the ANNOTATE= option in the PROC GANTT statement is a “global” ANNOTATE= data set, in the sense that the information in this data set is
displayed on every Gantt chart produced in the current invocation of PROC GANTT. This option is available only in graphics mode.
See Example 4.21, “Using the SAS/GRAPH ANNOTATE= Option,” for further il-lustration of this option.
CALEDATA=SASdataset
CALENDAR=SASdataset
identifies a SAS data set that specifies the work pattern during a standard week for
eachof the calendars that is to be used in the project. Each observation of this data set (also referred to as the Calendar data set) contains the name or the number of the calendar being defined in that observation, the names of the shifts or work patterns used each day and, optionally, a standard workday length in hours. For details on the structure of this data set, see the “Multiple Calendars and Holidays” section on page 400. The work shifts referred to in the CALEDATA data set are defined in the WORKDATA data set.
DATA=SASdataset
names the SAS data set that carries the schedule information to be used by PROC GANTT. If the DATA= option is omitted, the most recently created SAS data set is used. This data set, also known as the Schedule data set, contains all the time variables (early, late, actual, resource-constrained, and baseline start and finish times, and any other variables to be specified in a CHART statement) that are to be plotted on the chart. For projects that use multiple calendars, this data set also identifies the calendar that is used by each activity. The Schedule data set also contains precedence information when drawing a Logic Gantt chart in graphics mode. See the “Schedule Data Set” section on page 395 for more details.
FULLSCREEN FS
indicates that the Gantt chart be drawn in full-screen mode. This mode enables you to scroll horizontally and vertically through the output using commands, pull-down menus, or function keys. See the “Full-Screen Version” section on page 402 for more information.
GOUT=graphics catalog
specifies the name of the graphics catalog used to save the output produced by PROC GANTT for later replay. This option is available only in graphics mode.
GRAPHICS
indicates that the Gantt chart produced be of high-resolution quality. This is the default mode of display. If you invoke the GANTT procedure in Graphics mode, but you do not have SAS/GRAPH software licensed at your site, the procedure stops and issues an error message. See the “Graphics Version” section on page 406 for more information.
HOLIDATA=SASdataset
names the SAS data set that specifies holidays. These holidays can be associated with specific calendars that are also identified in the HOLIDATA data set (also referred to as the Holiday data set). The HOLIDATA= option must be used with the HOLI-DAYS= option in the CHART statement, which specifies the variable in the SAS data
PROC GANTT Statement 367
set that contains the start time of holidays. Optionally, the data set can include a variable that specifies the length of each holiday or a variable that identifies the finish time of each holiday (if the holidays are longer than one unit of the INTERVAL= option). For projects involving multiple calendars, this data set can also include the variable named by the CALID= option that identifies the calendar to be associated with each holiday.
LABDATA=SASdataset
LABELDATA=SASdataset
LABEL=SASdataset
specifies the input data set that contains the label specific information. This option is required to initiate the automatic text annotation of the Gantt chart. See the “Label Data Set” section on page 424 for information on the variables it can contain. This option is available only in graphics mode.
LABMAXINT=n
LMI=n
specifies the maximum number of digits in the integer part when displaying an un-formatted numeric as a string. The default value is 16. The maximum number of decimal positions is specified using the MAXDEC= option in the PROC GANTT statement. This option is applicable only to labels defined with the Label data set. LINEPRINTER
LP
indicates that the Gantt chart be drawn in line-printer mode. MAXDEC=n
M=n
indicates the maximum number of decimal positions displayed for a number. A deci-mal specification in a format overrides a MAXDEC= specification. The default value of MAXDEC= is 2.
PRECDATA=SASdataset
names the SAS data set that contains the variables that define the precedence con-straints in AON format. This data set is required if the Schedule data set does not contain the required precedence information as, for example, when the COLLAPSE option in PROC CPM causes some observations to be excluded from the Schedule data set. When this option is specified, it is mandatory that the ACTIVITY variable exist in both data sets and be identical in both type and length. This option is available only in graphics mode.
SPLIT=’character’
S=’character’
splits labels used as column headings where the split character appears. When you define the value of the split character, you must enclose it in single quotes. In PROC GANTT, column headings for ID variables consist of either variable labels (if they are present and space permits) or variable names. If the variable label is used as the column heading, then the split character determines where the column heading is to be split.
IMAGEMAP=SASdataset
names the SAS data set that receives a description of the areas of a graph and a link for each area. This information is for the construction of HTML imagemaps. You use a SAS DATA step to process the output file and generate your own HTML files. The graph areas correspond to the link information that comes from the WEB= variable in the schedule data set. This gives you complete control over the appearance and structure of your HTML pages.
WORKDATA=SASdataset
WORKDAY=SASdataset
identifies a SAS data set that defines the work pattern during a standard working day. Each numeric variable in this data set (also referred to as the Workday data set) is assumed to denote a unique shift pattern during one working day. The variables must be formatted as SAS time values, and the observations are assumed to specify, alternately, the times when consecutive shifts start and end.
BY Statement
BYvariables ;
A BY statement can be used with PROC GANTT to obtain separate Gantt charts for observations in groups defined by the BY variables. When a BY statement appears, the procedure expects the schedule data to be sorted in order of the BY variables. If your Schedule data set is not sorted, use the SORT procedure with a similar BY statement to sort the data. The chart for each BY group is formatted separately based only on the observations within that group.
CHART Statement
CHARTspecifications / options ;
The options that can appear in the CHART statement are listed below. The options are classified under appropriate headings: first, all options that are valid for all modes of the procedure are listed, followed by the options classified according to the mode (line-printer, full-screen, or graphics) of invocation of the procedure. Most of the options in line-printer and full-screen modes are also valid in graphics mode with similar interpretations. The differences and similarities in interpretation of the op-tions are documented under the “Mode-Specific Differences” section on page 428.
General Options
The CHART statement controls the format of the Gantt chart and specifies additional variables (other than early, late, actual, resource-constrained, and baseline start and finish times) to be plotted on the chart. For example, suppose a variable that you want to specify in the CHART statement is one that contains the target finish date for each activity in a project; that is, ifFDATEis a variable in the Schedule data set containing
CHART Statement 369
the desired finish date for each activity, the CHART statement can be used to mark the value ofFDATEon the chart for each activity. A CHART specification can be one of the following types:
variable1 . . . variablen
variable1=’symbol1’ . . . variablen=’symboln’
(variables)=’symbol1’ . . . (variables)=’symboln’
variable1 . . . variablen
indicates that each variable is to be plotted using the default symbol, the first character of the variable name. For example, the following statement
CHART SDATE FDATE;
causes the values ofSDATEto be plotted with an ’S’ and the values ofFDATEwith an ’F’.
variable1=’symbol1’ . . . variablen=’symboln’
indicates that each variable is to be plotted using the symbol specified. The symbol must be a single character enclosed in quotes.
(variables)=’symbol1’ . . . (variables)=’symboln’
indicates that each variable within the parentheses is to be plotted using the symbol associated with that group. The symbol must be a single character enclosed in single quotes. For example, the following statement
CHART (ED SD)=’*’ (FD LD)=’+’;
plots the values of the variables in the first group using an asterisk (’*’) and the values of the variables in the second group using a plus sign (’+’).
A single CHART statement can contain specifications in more than one of these forms. Also, each CHART statement produces a separate Gantt chart.
Note: It is not necessary to specify a CHART statement if default values are to be
used to draw the Gantt chart.
The following options can appear in the CHART statement. A–FINISH=variable
AF=variable
specifies the variable containing the actual finish time of each activity in the Schedule data set. This option is not required if the default variable name A–FINISH is used. A–START=variable
AS=variable
specifies the variable containing the actual start time of each activity in the Schedule data set. This option is not required if the default variable name A–START is used.
B–FINISH=variable
BF=variable
specifies the variable containing the baseline finish time of each activity in the Sched-ule data set. This option is not required if the default variable name B–FINISH is used.
B–START=variable
BS=variable
specifies the variable containing the baseline start time of each activity in the Sched-ule data set. This option is not required if the default variable name B–START is used.
BETWEEN=number
specifies the number of columns between two consecutive ID variable columns. This option gives you greater flexibility in spacing the ID columns. The default value of the BETWEEN= option is 3.
CALID=variable
specifies the variable in the DATA=, HOLIDATA=, and CALEDATA= data sets that is used to identify the name or number of the calendar to which each observation refers. This variable can be either numeric or character depending on whether the different calendars are identified by unique numbers or names, respectively. If this variable is not found in any of the three data sets, PROC GANTT looks for a default variable named –CAL– in that data set (a warning message is issued to the log). For each activity in the Schedule data set, this variable identifies the calendar that is used to mark the appropriate holidays and weekends for the activity. For further details, see the “Multiple Calendars and Holidays” section on page 400.
COMBINE
concatenates the early/late and actual schedule bars of an activity into a single bar and draws a timenow line on the Gantt chart. The COMBINE option does not affect the resource-constrained or baseline schedule bars. If the TIMENOW= option is not specified, it is implicitly assumed to exist and set to missing. The computation of TIMENOW is then carried out as described in the TIMENOW= option. Since the timenow line represents the instant at which a “snapshot” of the project is taken, values less than TIMENOW can be regarded as the “past” and values greater or equal to TIMENOW can be regarded as the “future”. The GANTT procedure uses this property of the timenow line to partition the chart into two regions; the region to the left of the timenow line reporting only the actual schedule (events that have already taken place), and the region to the right (including the timenow line) reporting only the predicted early/late schedule.
CRITFLAG FLAG
indicates that critical jobs be flagged as being critical or super-critical. An activity is critical if its total float is zero. If the total float is negative, the activity is super-critical. Critical activities are marked ’CR’, and super-critical activities are marked ’SC’ on the left side of the chart.
CHART Statement 371
DAYLENGTH=daylength
specifies the length of the workday. Each workday is plotted starting at the beginning of the day as specified in the DAYSTART= option and endingdaylengthhours later. The value ofdaylength should be a SAS time value. If the INTERVAL= option is specified as DTSECOND, DTMINUTE, DTHOUR, or DTDAY, the default value of
daylength is 24 hours. If the INTERVAL= option is specified as WORKDAY or DTWRKDAY, the default value of daylength is 8 hours. For other values of the INTERVAL= option, the DAYLENGTH= option is ignored.
Note: The DAYLENGTH= option is needed to mark the nonworked periods within a
day correctly (if the MARKBREAK option is in effect). The DAYLENGTH= option is also used to determine the start and end of a weekend precisely (to the nearest second). This accuracy is needed if you want to depict on a Gantt chart the exact time (for example, to within the nearest hour) for the start and finish of holidays or weekends. This option is used only if the times being plotted are SAS datetime values.
DAYSTART=daystart
specifies the start of the workday. The end of the day, dayend, is computed as
daylengthseconds afterdaystart. The value ofdaystart should be a SAS time value. This option is to be specified only when the value of the INTERVAL= option is one of the following: WORKDAY, DTSECOND, DTMINUTE, DTHOUR, DTDAY, or DTWRKDAY. For purposes of denoting on the Gantt chart, the weekend is assumed to start atdayend on Friday and end atdaystart on Monday morning. Of course, if the SCALE= and MININTERVAL= values are such that the resolution is not very high, you will be unable to discern the start and end of holidays and weekends to the nearest hour. The default value ofdaystart is 9:00 a.m. if INTERVAL=WORKDAY or INTERVAL=DTWRKDAY, and midnight otherwise.
DUPOK
causes duplicate values of ID variables not to be skipped. As described later in the "ID Statement" section, if two or more consecutive observations have the same combina-tion of values for all the ID variables, only the first of these observacombina-tions is plotted. The DUPOK option overrides this behavior and causes all the observations to be plotted.
DURATION=variable
DUR=variable
identifies a variable in the Schedule data set that determines whether or not an activ-ity is to be regarded as a milestone with respect to a specific schedule. This option is not required if the default variable name –DUR– is used. A value of 0 for this variable indicates that if the start and finish times of the activity with respect to a given schedule are identical (a schedule taken to mean early, late, actual, resource-constrained or baseline), then the activity is represented by a milestone with respect to the given schedule. A nonzero value treats identical start and finish times in the default manner by implicitly padding the finish times as specified by the PADDING= option. The milestone symbol is defined by the MILECHAR= option in line-printer and full-screen modes and by the CMILE=, FMILE=, HMILE=, and VMILE= op-tions in graphics mode; these fout opop-tions represent the color, font, height, and value
of the symbol, respectively. See the descriptions of these options for their default values. To illustrate, suppose that the observations for activitiesA and B from the Schedule data set are as follows:
ACTIVITY E_START E_FINISH A_START A_FINISH _DUR_ A 27JUL92 27JUL92 31JUL92 31JUL92 1 B 31JUL92 31JUL92 01AUG92 02AUG92 0
In this example, the actual schedule for activityAbegins on ’31JUL92’ and finishes at the end of the day, as explained in the “Schedule Data Set” section on page 395. PROC GANTT uses the– DUR– variable to recognize that activity A has nonzero duration, pads the finish time by a PADDING= unit, and displays a bar representing one day. In contrast, the value of ’0’ for– DUR– in activityAalerts PROC GANTT that padding be ignored for any schedule with identical start and finish times. Conse-quently, the early schedule for activityBis represented on the chart by the milestone symbol at ’31JUL92’. The actual schedule, however, not having identical start and finish times, is padded as usual and plotted as starting on ’01AUG92’ and finishing at the end of ’02AUG92’.
E–FINISH=variable
EF=variable
specifies the variable containing the early finish time of each activity in the Schedule data set. This option is not required if the default variable name E–FINISH is used. E–START=variable
ES=variable
specifies the variable containing the early start time of each activity in the Schedule data set. This option is not required if the default variable name E–START is used. FILL
causes each page of the Gantt chart to be filled as completely as possible before a new page is started (when the size of the project requires the Gantt chart to be split across several pages). If the FILL option is not specified, the pages are constrained to contain an approximately equal number of activities. The FILL option is not valid in full-screen mode because all of the activities are plotted on one logical page. HCONNECT
causes a line to be drawn for each activity from the left boundary of the chart to the beginning of the bar for the activity. This feature is particularly useful when the Gantt chart is drawn on a large page. In this case, the schedule bars for some of the activities may not start close enough to the left boundary of the chart; the connecting lines help identify the activity that each bar refers to.
HOLIDAY=(variable)
HOLIDAYS=(variable)
specifies the date or datetime variable in the HOLIDATA data set that identifies holi-days to be marked on the schedule. If there is no end time nor duration specified for the holiday, it is assumed to start at the time specified by the HOLIDAY variable and last one unit ofinterval, whereinterval is the value of the INTERVAL= option.
CHART Statement 373
HOLIDUR=(variable)
HDURATION=(variable)
specifies the variable in the HOLIDATA data set that identifies the durations of the holidays that are to be marked on the schedule.
HOLIEND=(variable)
HOLIFIN=(variable)
specifies the date or datetime variable in the HOLIDATA data set that identifies the finish times of the holidays that are to be marked on the schedule.
IDPAGES
displays ID variables on every page. By default, the ID variables are displayed only on the first page.
INCREMENT=increment
specifies the number of minintervals between time axis labels on the Gantt chart. If the INCREMENT= options is not specified, a value is chosen that provides the maximum possible labeling.
INTERVAL=interval
HOLINTERVAL=interval
specifies the units for the values of the HOLIDUR variables. Valid values for this op-tion are DAY, WEEKDAY, WORKDAY, DTSECOND, DTMINUTE, DTHOUR, DT-DAY, or DTWRKDAY. If the value for the INTERVAL= option has been specified as WEEKDAY, WORKDAY, or DTWRKDAY, weekends are also marked on the Gantt chart with the same symbol as holidays for line-printer quality charts. Graphics-quality Gantt charts use the same PATTERN statement as the one used for marking holidays. The default value of the INTERVAL= option is DAY if the times being plotted are SAS date values and is DTDAY if the times being plotted are SAS date-time values. See the “Specifying the INTERVAL= Option” section on page 401 for further information regarding this option.
L–FINISH=variable
LF=variable
specifies the variable containing the late finish time of each activity in the Schedule data set. This option is not required if the default variable name L–FINISH is used. L–START=variable
LS=variable
specifies the variable containing the late start time of each activity in the Schedule data set. This option is not required if the default variable name L–START is used. MARKBREAK
causes all breaks (nonworked periods) during a day to be marked on the Gantt chart. The symbol used for marking the breaks is the same as the HOLICHAR= symbol. This option may not be of much use unless the chart has been plotted with a scale that enables you to discern the different hours within a day on the Gantt chart. For instance, if the chart is in terms of days, there is no point in trying to show the breaks within a day; on the other hand, if it is in terms of hours or seconds, you may want to see the start and end of the various shifts within a day. This option turns on the MARKWKND option.
MARKWKND
causes all weekends (or nonworked days during a week) to be marked on the Gantt chart. The symbol used for marking weekends is the same as the HOLICHAR= sym-bol. Note that weekends are also marked on the chart if the value of the INTERVAL= option is WEEKDAY, WORKDAY, or DTWRKDAY.
MAXDATE=maxdate
specifies the end time for the time axis of the chart. The default value is the largest value of the times being plotted unless the logic options are invoked without the NOEXTRANGE option in the CHART statement. For a discussion of the default behaviour in this instance, see the “Formatting the Axis” section on page 419. MAXIDS
displays as many consecutive ID variables as possible in the presence of an ID state-ment. In the absence of this option, the default displays all of the variables or none if this is not possible.
MINDATE=mindate
specifies the starting time for the time axis of the chart. The default value is the smallest value of the times being plotted unless the logic options are invoked without the NOEXTRANGE option in the CHART statement. For a discussion of the default behaviour in this instance, see the “Formatting the Axis” section on page 419. MININTERVAL=mininterval
specifies the smallest interval to be identified on the chart. For example, if MININ-TERVAL=DAY, then one day is represented on the chart byscale(see the SCALE= option) number of columns. The default value of the MININTERVAL= option is chosen on the basis of the formats of the times being plotted, as explained in the “Specifying the MININTERVAL= Option” section on page 399. See also the “Page Format” section on page 399 for a further explanation of how to use the MININTER-VAL= option in conjunction with the SCALE= option.
NOJOBNUM
suppresses displaying an identifying job number for each activity. By default, the job number is displayed to the left of the Gantt chart.
NOLEGEND
suppresses displaying the concise default legend at the bottom of each page of the Gantt chart. The NOLEGEND option is not effective in full-screen mode.
NOTNLABEL
suppresses displaying the timenow label. By default, the label is displayed on the bottom border of the chart.
PADDING=padding
FINPAD=padding
requests that finish times on the chart be increased by onepaddingunit. An exception to this is when a milestone is to be plotted. See the DUR= option for further informa-tion regarding this. The PADDING= opinforma-tion enables the procedure to mark the finish times as the end of the last time period instead of the beginning. Possible values for
CHART Statement 375
YEAR, DTSECOND, DTMINUTE, DTHOUR, DTWEEK, DTMONTH, DTQTR, or DTYEAR. The default value is chosen on the basis of the format of the times be-ing plotted. See the “Specifybe-ing the PADDING= Option” section on page 398 for further explanation of this option.
PAGELIMIT=pages
PAGES=pages
specifies an upper limit on the number of pages allowed for the Gantt chart. The de-fault value ofpagesis 100. This option is useful for preventing a voluminous amount of output from being generated by a wrong specification of the MININTERVAL= or SCALE= option. This option is ignored in full-screen mode.
REF=values
indicates the position of one or more vertical reference lines on the Gantt chart. The values allowed are constant values. Only those reference lines that fall within the scope of the chart are displayed.
In line-printer and full-screen modes, the reference lines are displayed using the char-acter specified in the REFCHAR= option. In graphics mode, use the CREF=, LREF=, and LWIDTH= options to specify the color, linestyle, and width of the reference lines.
REFLABEL
specifies that the reference lines are to be labeled. The labels are formatted in the same way as the time axis labels and are placed along the bottom border of the Gantt chart at the appropriate points. If the reference lines are too numerous and the scale does not allow all the labels to be nonoverlapping, then some of the labels are dropped.
S–FINISH=variable
SF=variable
specifies the variable containing the resource-constrained finish time of each activity in the Schedule data set. This option is not required if the default variable name S–FINISH is used.
S–START=variable
SS=variable
specifies the variable containing the resource-constrained start time of each activity in the Schedule data set. This option is not required if the default variable name S–START is used.
SCALE=scale
requests thatscalenumber of columns on the chart represent one unit ofmininterval
where mininterval is the value of the MININTERVAL= option. In line-printer and graphics modes, the default value of the SCALE= option is 1 if the time axis of the chart is too wide to fit on one page. If the time axis fits on less than one page, then a default value is chosen that expands the time axis as much as possible but still fits the time axis on one page. In full-screen mode, the default value of the SCALE= option is always 1.
SKIP=skip
S=skip
requests thatskipnumber of lines be skipped between the plots of the schedules of two activities. The SKIP= option can take integer values between 0 and 4, inclusive. In graphics mode, 0 is not a valid value. The default value of the SKIP= option is 1. STRIPIDBLANKS
STRIPID
strips all leading blanks from character ID variables. The default behavior is to pre-serve any leading blanks.
SUMMARY
requests that a detailed description of all symbols and patterns used in the Gantt chart be displayed before the first page of the chart. In line-printer mode, this description includes examples of some strings that could occur in the body of the Gantt chart. The SUMMARY option is not supported in full-screen mode.
TIMENOW=value
specifies the position for the timenow line on the chart. If the value is invalid or set to missing, TIMENOW is set to be the time period following the maximum of all specified actual times. If there are no actual times, TIMENOW is set to be equal to the current date. The value of TIMENOW is written to the log.
The timenow line has precedence over all other variables and reference lines and is drawn only if it falls within the range of the chart axis. If TIMENOW is based on the maximum of the actual times, and the MAXDATE= option is not specified, then the range of the chart axis is increased, if necessary, to display the timenow line. The timenow line is labeled by default; the label is formatted in the same way as the time axis and is placed along the bottom border of the chart. The timenow line is displayed in line-printer and full-screen modes using the character specified by the TNCHAR= option (orT, if none is specified) in the CHART statement. In graphics mode, use the CTNOW=, LTNOW=, and WTNOW= options in the CHART statement to specify the color, linestyle, and width of the timenow line. In the presence of a timenow line, the actual schedule for an activity with an actual start less than TIMENOW and a missing actual finish time is represented on the Gantt chart by a bar that begins at the actual start and ends at TIMENOW to indicate that the activity is in progress at TIMENOW. This behaviour is consistent with the convention used by PROC CPM. A warning is also issued to the log in this case.
USEFORMAT
specifies that the tickmark labels of the Gantt chart axis are to be displayed using the format associated with the first plot variable appearing in the order ES, EF, LS, LF, AS, AF, SS, SF, BS, BF. This format is also used for labeling any reference lines and the timenow line.
Full-Screen and Line-Printer Options
The following options can appear in the CHART statement and are specifically for the purpose of producing Gantt charts in line-printer and full-screen modes.
FORMCHAR[index list]=’string’
CHART Statement 377
value is a string 11 characters long defining the two bar characters, vertical and hor-izontal, and the nine corner characters: upper left, upper middle, upper right, middle left, middle middle (cross), middle right, lower left, lower middle, and lower right. The default value of the FORMCHAR= option is’|----|+|---’. Any character or hexadecimal string can be substituted to customize the chart appearance. Use an index list to specify which default form character each supplied character replaces, or replace the entire default string by specifying the full 11 character replacement string with no index list. For example, change the four corners to asterisks by using
formchar(3 5 9 11)= ’****’ .
Specifying the following produces charts with no outlines or dividers.
formchar=’ ’ (11 blanks)
If you have your output routed to an IBM 6670 printer using an extended font (type-style 27 or 225) with input character set 216, it is recommended that you specify
formchar=’FABFACCCBCEB8FECABCBBB’X .
If you are using a printer with a TN (text) print train, it is recommended that you specify the following:
formchar=’4FBFACBFBC4F8F4FABBFBB’X .
HCONCHAR=’character’
specifies the symbol to be used for drawing the connecting line described in the HCONNECT option. The default character is-. This is a line-printer option and is not valid in conjunction with the GRAPHICS option. For corresponding graphics options, see the LHCON= and CHCON= options described later in this section under “Graphics Options.”
HOLICHAR=’character’
indicates the character to display for holidays. Note that PROC GANTT displays only those holidays that fall within the duration or the slack time of an activity. The default character used for representing holidays is!.
JOINCHAR=’string’
defines a string eight characters long that identifies nonblank characters to be used for drawing the schedule. The first two symbols are used to plot the schedule of an activity with positive total float. The first symbol denotes the duration of such an activity while the second symbol denotes the slack present in the activity’s schedule. The third symbol is used to plot the duration of a critical activity (with zero total float). The next two symbols are used to plot the schedule of a supercritical activity (one with negative float). Thus, the fourth symbol is used to plot the negative slack of such an activity starting from the late start time (to early start time), and the fifth
symbol is used to plot the duration of the activity (from early start to early finish). The sixth symbol is used to plot the actual schedule of an activity if the A–START and A–FINISH variables are specified. The seventh symbol is used to plot the resource-constrained schedule of an activity if the S–START and S–FINISH variables are specified. The eighth symbol is used to plot the baseline schedule of an activity if the B–START and B–FINISH variables are specified. The default value of the JOINCHAR= option is’-.=-*-*_’.
MILECHAR=’character’
indicates the character to display for the milestone symbol. If this option is not used, the symbol M is used instead. In the event that another milestone or a character representing a start or finish time is to be plotted in this column, the OVERLAPCH= character is used.
OVERLAPCH=’character’
OVLPCHAR=’character’
indicates the overprint character to be displayed when more than one of the sym-bols in SYMCHAR=’string’or MILECHAR=’character’are to be plotted in the same column. The default character is*.
OVPCHAR=’character’
indicates the character to be displayed if one of the variables specified in the CHART statement is to be plotted in the same column as one of the start or finish times. If no OVPCHAR= option is given, the ’at’ symbol (@) is used. Note that if one of the E–START, E–FINISH, L–START, L–FINISH, A–START, A–FINISH, S–START, S–FINISH, B–START, or B–FINISH times coincides with another, the overprint character to be displayed can be specified separately using the OVERLAPCH= op-tion.
REFCHAR=’character’
indicates the character to display for reference lines. If no REFCHAR= option is given, the vertical bar (|) is used. If a time variable value is to be displayed in the column where a REF= value goes, the plotting symbol for the time variable is displayed instead of the REFCHAR= value. Similarly, the HOLICHAR= symbol has precedence over the REFCHAR= value.
SYMCHAR=’string’
defines the symbols to be used for plotting the early start, late start, early finish, late finish, actual start and finish, resource-constrained start and finish, and baseline start and finish times, in that order. The default value is’<<>>**<>[]’. If any of the above symbols coincide with one another or with the milestone symbol, the symbol plotted is the one specified in the OVERLAPCH= option (or*, if none is specified). If the actual, resource-constrained, and baseline schedules are not plotted on the chart, you can specify only the first four symbols. If fewer than the required number of symbols are specified, nonspecified symbols are obtained from the default string. TNCHAR=’character’
indicates the character to display for the timenow line. If this option is not used, the letterTis used instead.
CHART Statement 379
Graphics Options
The following describes the interpretation of the CHART specification in graphics mode.
As before, the CHART statement controls the format of the Gantt chart and speci-fies additional variables (other than the early, late, actual, resource-constrained, and baseline start and finish times) to be plotted on the chart. The same forms for the specification of CHART variables (as in the line-printer and full-screen version) are allowed, although the interpretation is somewhat different. Each form of specifica-tion is repeated here with a corresponding descripspecifica-tion of the interpretaspecifica-tion. Note that the symbols for any activity are plotted on a line above the one corresponding to that activity. In addition to plotting the required symbol, PROC GANTT draws a vertical line below the symbol in the same color as the symbol. The length of the line is the same as the height of the bars (referred to as bar height) that represent the dura-tions of the activities on the Gantt chart. This line helps identify the exact position of the plotted value. See also the “Special Fonts for Project Management and Decision Analysis” section on page 414 for information on a special set of symbols that are suitable for representing CHART variables on a Gantt chart.
variable1 . . . variablen
indicates that each variable is to be plotted using symbols specified in SYMBOL statements. The ith variable in the list is plotted using the plot symbol, color, and font specified in the ith SYMBOL statement. The height specified in the SYMBOL statement is multiplied by the bar height to obtain the height of the symbol that is plotted. Thus, if H=0.5 in the first SYMBOL statement, and the bar height is 5 percent of the screen area, then the first symbol is plotted with a height of 2.5 percent. For example, suppose the following two SYMBOL statements are in effect:
SYMBOL1 V=STAR C=RED H=1;
SYMBOL2 V=V C=GREEN H=0.5 F=GREEK;
Then, the following statement
CHART SDATE FDATE;
causes values ofSDATEto be plotted with a red star that is as high as each bar and the values ofFDATEwith an inverted green triangle that is half as high as the bar height. See the “Using SYMBOL Statements” section on page 411 for further information on using the SYMBOL statement.
variable1=’symbol1’ . . . variablen=’symboln’
indicates that each variable is to be plotted using the symbol specified. The symbol must be a single character enclosed in quotes. The font used for the symbol is the same as the font used for the text.
(variables)=’symbol1’ . . . (variables)=’symboln’
indicates that each variable in parentheses is to be plotted using the symbol associated with that group. The symbol must be a single character enclosed in single quotes. For example, the following statement
CHART (ED SD)=’*’ (FD LD)=’+’;
plots the values of variables in the first group using an asterisk (’*’) and the values of variables in the second group using a plus sign (’+’).
A single CHART statement can contain requests in more than one of these forms.
Note: It is not necessary to specify a CHART statement if only default values are
used to draw the Gantt chart.
The following options can appear in the CHART statement specifically for the pro-duction of high-resolution graphics quality Gantt charts.
ABARHT=h
specifies that the height of the actual schedule bar behcellheights. The value of h
is restricted to be a positive real number. The default bar height is one cellheight. This specification will override a BARHT= specification. In the event that the actual schedule bar corresponds to the logic bar (via the LEVEL= option), the value is ig-nored and the default value is used instead. Any nonworking days corresponding to this schedule bar are also drawn using the same height as the schedule bar unless the HBARHT= option is specified.
ABAROFF=d
specifies that the actual schedule bar be offsetdcellheights from its default position. A value of zero corresponds to the default position. The direction of increase is from top to bottom. This specification will override a BAROFF= specification. In the event that the actual schedule bar corresponds to the logic bar (specified using the LEVEL= option), the value is ignored and the default value is used instead. Any nonworking days corresponding to this schedule bar are drawn using the offset of the schedule bar unless the HBAROFF= option is specified.
ACTIVITY=variable
ACT=variable
specifies the variable identifying the names of the nodes representing activities in the Schedule data set. This option is required when the precedence information is specified via the AON format. The variable can be either numeric or character in type. If the PRECDATA= option is specified, then this variable must also exist in the Precedence data set and have identical type and length.
ANNOTATE=SASdataset
ANNO=SASdataset
specifies the input data set that contains the appropriate Annotate variables for the purpose of adding text and graphics to the Gantt chart. The data set specified must be an Annotate-type data set. See also the “Annotate Processing” section on page 407 for information specifically on annotate processing with the GANTT procedure. The ANNOTATE= data set specified in a CHART statement is used only for the Gantt chart created by that particular CHART statement. You can also specify an ANNOTATE= data set in the PROC GANTT statement, which provides “global” Annotate information to be used for all Gantt charts created by the procedure.
CHART Statement 381
AOA
causes PROC GANTT to use the specification for the AOA format for producing a Logic Gantt chart when the precedence information has been specified in both AOA format (TAIL= and HEAD= options) and AON format (ACTIVITY=, SUC-CESSOR=, and, optionally, LAG= options). The default behavior is to use the AON format.
BARHT=h
specifies that the height of all the schedule bars be h cellheights. The value of h is restricted to be a positive real number. The default value is one cellheight. This specification can be overridden for each schedule type by specifying the bar height option appropriate for that schedule type. If a logic Gantt chart is produced, the specified barheight is ignored for the logic bar (specified using the LEVEL= option) and the default barheight of one cellheight used for it instead. All nonworking days corresponding to a schedule bar are drawn using the height of the schedule bar unless the HBARHT= option is specified.
BAROFF=d
specifies that all the schedule bars be offsetdcellheights from their default positions. A value of zero corresponds to the default positions. The direction of increase is from top to bottom. This specification can be overridden for each schedule type by specifying the bar offset option that is appropriate for that schedule type. If a logic Gantt chart is produced, the specified baroffset is ignored for the logic bar (specified using the LEVEL= option) and the default bar offset of zero used instead.
BBARHT=h
specifies that the height of the baseline schedule bar behcellheights. The value of
his restricted to be a positive real number. The default bar height is one cellheight. This specification overrides a BARHT= specification. In the event that the baseline schedule bar corresponds to the logic bar (via the LEVEL= option), the value is ig-nored and the default value is used instead. Any nonworking days corresponding to this schedule bar are also drawn using the same height as the schedule bar unless the HBARHT= option is specified.
BBAROFF=d
specifies that the baseline schedule bar be offsetd cellheights from its default posi-tion. A value of zero corresponds to the default posiposi-tion.The direction of increase is from top to bottom. This specification overrides a BAROFF= specification. In the event that the baseline schedule bar corresponds to the logic bar (specified using the LEVEL= option), the value is ignored and the default value is used instead. Any nonworking days corresponding to this schedule bar are drawn using the offset of the schedule bar unless the HBAROFF= option is specified.
BOTTOM BJUST
positions the bottom of the Gantt chart at the bottom of the page, just above the footnotes. This option is ignored if you specify the TOP or TJUST option.
CAXES=color
CAXIS=color
CA=color
specifies the color to use for displaying axes for the Gantt chart. If the CAXIS= option is omitted, PROC GANTT uses the first color in the COLORS= list in the GOPTIONS statement.
CFRAME=color
CFR=color
specifies the color to use for filling the axis area. By default, the axis is not filled. This option is ignored if the NOFRAME option is specified.
CHCON=color
specifies the color to use for drawing the horizontal connecting lines. If the CHCON= option is not specified, PROC GANTT uses the first color in the COLORS= list in the GOPTIONS statement.
CMILE=color
specifies the color to use for drawing the milestone symbol on the chart. If the CMILE= option is not specified, PROC GANTT uses the first color in the COLORS= list in the GOPTIONS statement.
COMPRESS
specifies that the Gantt chart be drawn on the number of output pages determined via the HPAGES= and VPAGES= options. If the HPAGES= option is not specified, the procedure assumes a default of HPAGES=1. If the VPAGES= option is not specified, the procedure assumes a default of VPAGES=1. The COMPRESS option does not attempt to maintain the aspect ratio of the Gantt chart. To maintain the aspect ration of the Gantt chart, use the PCOMPRESS option instead.
CPREC=color
specifies the color to use for drawing the precedence connections. If the CPREC= option is not specified, PROC GANTT uses the first color in the COLORS= list in the GOPTIONS statement.
CREF=color
specifies the color to use for drawing vertical reference lines on the chart. If the CREF= option is not specified, PROC GANTT uses the first color in the COLORS= list in the GOPTIONS statement.
CTEXT=color
CT=color
specifies the color to use for displaying text that appears on the chart, including vari-able names or labels, tickmark values, values of ID varivari-ables, and so on. The default color is the value specified for the CTEXT= option in the GOPTIONS statement. If CTEXT= is not specified in the GOPTIONS statement, PROC GANTT uses the first color in the COLORS= list in the GOPTIONS statement.