We are transitioning into Phase 3 of the project, which is the decision-making phase. Based on the feedback from city council on April 12, staff and the consultants have developed draft options on fee levels and have begun compiling a comparative analysis of development-related fees from surrounding communities. We are seeking Technical Working Group input on the content of these options as well as feedback on the method of presentation.
Materials for review
Staff has prepared the following draft comparative charts for each component to put a framework around the wide range of fee options. The analysis and information for these comparative charts has been pulled from draft reports provided to the Technical Working Group in the past two months, except for the affordable housing fee level options. Additional analysis for the housing fee options has been developed in response to council feedback and is attached here. The draft reports for capital facility impact fees and transportation fee or tax have not been re-attached, copies can be found on the project website.
The objective of the comparative charts is roll up the content of the detailed draft reports to be easily compared across current levels and potential options. The comparative chart for capital facilities impact fees has proposed option. Three options are presented in the comparative chart for multi-modal
transportation funding including; maximizing our current excise tax, switching to an impact fee, or a hybrid combination of excise tax and impact fee. The comparative chart of options for affordable housing linkage fee has four options; two goal-based approaches, one approach based on Boulder’s current income Profile, and one approach based on market factors.
Working Group Discussion
Each component chart compares the options by methodology, fee level, what the fee would support, and potential credits. Initial considerations for each option have been developed. We are seeking the technical working group’s feedback on these charts.
Do these comparative charts clearly outline the options for each component? Are the right considerations listed?
Are there others that need to be included? Next Steps
Following the May 9 technical working group meeting, materials will be refined for a council study session on June 14. The purpose of that study session will be to discuss and narrow the options for any fee changes. Council will be provided with the comparative charts, working group feedback, and scenarios of fee options. These scenarios will demonstrate the range of potential fee changes, and include analysis of the development cost context.
Following the June 14 Study Session, the draft reports will be finalized and narrowed options will be developed for council consideration on July 19 in a public hearing.
Description Existing Fees Fees to Reach city’s 10% Goal by 2025
Fees to Reach city’s Middle Income Goal by 2025
Fees Based on Boulder’s Current Income Profile
Fees Based on Combination of Factors, Including Economic / Market Methodology (approach) Fees based on proportionate share attributable to non-residential growth for current Affordable Housing Goal to secure 10% of all dwelling units as permanently affordable to low- and moderate-income households.
Fees set to achieve the city’s current Affordable Housing Goal to secure 10% of all dwelling units as permanently affordable to low- and
moderate-income households. Adjusts for needs meet through Inclusionary and other funding sources
Fees set to achieve the city’s current Middle Income goals to secure 450 units as permanently affordable to middle income households and Maintaining the Middle by housing a similar share of new middle income workers as the city currently does (roughly 18% from 80% to 120% of Area Median Income).
Fees reflective of providing a level of affordability to new workers that is consistent with Boulder’s current income profile or level of income diversity. Adjusts for needs met through Inclusionary
Fee range based on consideration of multiple factors including economic / market conditions and the context of linkage fees adopted elsewhere.
Fee Level (Office)
*(See KMA Report for all land use categories)
$9.53/Sq. Ft. $33.00/Sq. Ft. $19.00/Sq. Ft. $34.49/Sq. Ft. $10-$15/Sq. Ft.
What the fee would support Creation and preservation of Low and Moderate Income affordable housing units. Achieve 10% goal by 2025 through approximately 760 affordable units
Achieve Middle Income goal by 2025 through approximately 330 units of middle income housing
Expand affordable housing; house new workers at a variety of income levels.
Expand affordable housing; house new workers at a variety of income levels.
Fees based on 2009 study. Financial resources available to support affordable unit production. Funds targeted to low and moderate income households may be
leveraged/matched with other state and federal funds, ultimately bringing additional funds into Boulder
Funds targeted to low and moderate income households may be leveraged/matched with other state and federal funds, ultimately bringing additional funds into Boulder With limited development opportunities and fluctuation of federal funds, future funding is uncertain. Fees under this option may exceed a level that can be sustained by many projects and may slow or reduce non-residential development.
Annexation only means to secure MI units.
Limited non-city subsidies available for MI units. Expensive subsidy/Costly investment = low yield Coordinate with IH program, expanding IH to create middle income units and linkage fee supplements the reduction in CIL.
Fees for some building types under this option may exceed a level that can be sustained by projects and may slow or reduce non-residential development. Further policy conversations required to gauge city’s position on subsidizing middle income housing.
not assert changes to specific income tiers. Serves all LMI and middle income. Inclusionary Housing: credit provided for affordable housing needs met through IH program.
Fees under this option may exceed a level that can be sustained by many projects and may slow or reduce non-residential development.
fee range not expected to significantly alter
development decisions. Fees resulting from a combination of factors including economic and market factors.
Provides flexibility to determine best and highest use of funds.
ADVISORS IN: REAL ESTATE AFFORDABLE HOUSING ECONOMIC DEVELOPMENT SAN FRANCISCO A.JERRY KEYSER TIMOTHY C.KELLY
KATE EARLE FUNK
DEBBIE M.KERN REED T.KAWAHARA DAVID DOEZEMA LOS ANGELES KATHLEEN H.HEAD JAMES A.RABE GREGORY D.SOO-HOO KEVIN E.ENGSTROM JULIE L.ROMEY SAN DIEGO PAUL C.MARRA DRAFT MEMORANDUM
To: Chris Meschuk and Kristin Hyser City of Boulder
From: David Doezema
Date: May 2, 2016
Subject: Affordable Housing Fee Level Options
KMA has conducted a nexus study to link new non-residential, or workplace buildings, to the demand for additional affordable residential units in Boulder. As previously
presented, the results of that analysis found very high supportable fee levels, even assuming affordable units are developed with the benefit of federal tax credits to reduce local costs and incorporating a 45% adjustment for commuting into the findings. The high maximum fee levels supported by the analysis are not unusual for high cost areas such as Boulder. The city has the discretion to consider a broad range of policy
objectives and/or market factors in setting fee levels anywhere below the identified maximums fee levels.
Summary of Nexus Findings – Maximum Supported Fees
Note: Nexus findings are not recommended fee levels. Building Type
Nexus Findings with 45% Commute Adjustment (per Sq. Ft.) Office $57.90 Light Industrial $42.90 Retail $71.00 Hospital $57.90 Lodging $26.70 Warehouse $24.20 Institutional $19.90 Assisted Living $57.00
Based upon direction from the City Council at the April 12th study session, the following
memorandum explores four options or potential approaches to selecting affordable housing fee levels within the maximums established by the nexus analysis:
Option #1: Fees to Reach 10% Goal by 2025 – this option explores fee levels needed to achieve, within the next 10 years, the goal that 10% of the total housing stock be secured as permanently affordable. Estimated funding from other sources and regulatory tools including the Inclusionary Housing program are reflected as “credits” toward funding needed to reach this goal by 2025.
Option #2: Fees Based on Middle Income Goals – this option identifies fees at a level reflective of the City’s middle income housing goals.
Option #3: Fees Based on Boulder’s Current Income Profile – this option identifies affordable housing fees reflective of providing a level of affordability to new workers consistent with Boulder’s current income profile or level of income diversity. A credit for needs met through the Inclusionary Housing program is also included.
Option #4 – Fees Based on Combination of Factors, Including Economic / Market – this option provides a fee rangethat reflects the added consideration of economic / market factors and a review of fee levels instituted in other programs nationally.
Summary of Fee Levels with Identified Options
The following table provides a summary of fees under the four options outlined above:
For certain fee categories such as lodging, fees under any of the options are probably Building Type Option #1 Fees to Reach 10% Goal by 2025 (per Sq. Ft.) Option #2 Fees based on Middle Income Housing Goals (per Sq. Ft.) Option #3 Fees based on Current Income Profile (per Sq. Ft.) Office $33.00 $19.00 $34.49 $10 - $15
Office Bonus FAR (1) $33.00 $19.00 $34.49 $15 - $25
Light Industrial $21.20 $12.20 $19.29 $6 - $8 Retail $23.10 $12.00 $23.39 $6 - $10 Hospital $27.00 $15.50 $23.59 $6 - $10 Lodging $8.70 $3.50 $8.09 $6 - $10 Warehouse $8.50 $4.90 $8.29 $2 - $5 Institutional $7.50 $4.30 $7.29 $2 - $6 Assisted Living $19.30 $11.10 $19.39 $2 - $8 Option #4 Fee Range Based on
Multiple Factors Including Market
(per Sq. Ft.)
(1) Suggestion under Option #4 is for a higher fee applicable to FAR additions in the Dow ntow n similar to the structure of the program before being expanded City-w ide.
development decisions in Boulder. For other fee categories, such as office at $34 per square foot under Option#3, fees are likely beyond a level that can be borne by many projects.
Option #4 reflects a recommended range based on consideration of multiple factors and tempered based upon review of economic / market factors and the context of linkage fees adopted elsewhere. Option #4 assumes an objective to establish fees within a range not expected to significantly alter development decisions. In consideration of higher real estate values in Boulder’s downtown and the original structure of the City’s affordable housing fee program as applicable to bonus floor area, an additional
suggestion under Option #4 is that the City consider a higher fee structure for bonus or additional floor area in a range of $15 to $25 per square foot. This suggestion would re-establish a premium or additional affordable housing fee payment for projects that exceed a base floor area allowance in the downtown.
Notwithstanding the fee range alternatives identified above, the City remains free to select fees anywhere above or below the levels shown, up to the maximums reflected in the nexus analysis, based on other policy objectives or overriding considerations that may take precedent.
Note on Middle Income and Coordination of Tools: Option #2 identifies fee ranges reflective of the City’s middle income goals and based upon the assumption of direct subsidy to middle income ownership units using affordable housing impact fee funds. To the extent the City chooses to direct resources and regulatory tools toward expanding middle income housing, coordination between the linkage fee and Inclusionary Housing tools may be appropriate. As one example, the City could restructure its Inclusionary Housing program to encourage on-site production of units restricted to middle income households (or add an alternative compliance option to encourage this). The City could then look to linkage fee funds as a replacement funding source for any decrease in Cash-In-Lieu funding that occurs from such a restructuring. This approach would allow linkage fees to be focused on cash contributions to 100% affordable projects in the lower income tiers where the greatest potential for leveraging of outside funding sources exists while promoting middle income housing through the regulatory tool of Inclusionary Housing ordinance.
OPTION #1 – GOAL-BASED APPROACH: ACHIEVE 10% GOAL BY 2025 a. Option Description
The City has a goal that 10% of its housing stock be permanently affordable to low- and moderate-income households. Approximately, 7.4% of the 10% goal has been achieved with these units secured as permanently affordable. This option identifies a target funding level and resulting fee levels necessary to reach the 10% Goal by the year 2025 (10 years).
b. Fee Levels for Option #1
c. Analysis
Funding Level to Reach 10% Goal in 10 Years
The following table presents an estimate of the additional funding needed to achieve the 10% Goal within the next 10 years:
Building Type
Fees to Reach 10% Goal in 10 Years (per Sq. Ft.) Office $33.00 Light Industrial $21.20 Retail $23.10 Hospital $27.00 Lodging $8.70 Warehouse $8.50 Institutional $7.50 Assisted Living $19.30
It is noted that the City has previously estimated that the 10% Goal may be achievable in approximately the next 8-10 years. This estimation reflects recent development trends and pace supporting the productivity of the Inclusionary Housing program which is dependent on market rate development activity. Future projections anticipate a slower pace of development impacting the generation of affordable units and Cash-in-Lieu revenue. In addition, the unit goal presented above reflects an increase in the 10% goal adjusted for the 2016 residential unit count as well as the projected residential unit growth over the next 10 years.
Fee Levels to Achieve Target Funding Level
The following table provides an illustration of fee levels that would be sufficient to produce the estimated $58 million in funding needed to achieve the City’s 10% Goal by 2025. The illustration allocates fees based on employment by building type.
Total Units
10% Goal - Based on Existing No. of Units(1) 44,725 X 10% 4,473 Units
Less: Progress Toward Goal (1) (3,319) Units
Remaining Goal 1,154 Units
Add: 10% Goal for New Housing Units through 2015(2) 1,015 X 10% 102 Units Add: 10% Goal - Future Housing Production: 2016- 2025 (3) 2,817 X 10% 282 Units Less: Credit for units produced by IH @ 0.38 / mkt rate unit (4) (776) Units
Affordable Units to Achieve Goal in 10 Years (Net of Units from IH) 761 Units
Gross Funding Required (affordability gap) $116,000 /Unit (5) $88 $Million Less: Other Funding (CHAP, CDBG, HOME) $3 $M/Yr (6) ($30) $Million Estimated Funding Needed to Reach 10% Goal in 10 Years $58 $Million
Job Growth: 2016-2025 6,336 Workers
Cost Per Worker $9,198 /Worker
(1) Per City of Boulder.
(2) Reflects units added since effective date of City estimate / adjustment to tie to TischlerBise Land Use Assumptions memo. (3) Per Tischler Bise Land Use Assumptions memo.
(4) See Tables 5 and 6, attached, for calculation of this ratio. 776 affordable units = 0.38/1.38 X 2,817 total units. (5) Reflects KMA affordability gap analysis w eighted by income tier based on income levels assisted from 2010-2015. (6) City of Boulder estimate. Includes $2.5 M CHAP and annualized average of $500k CDBG and HOME funds.
Illustrative Fee Levels Based on 10% Goal
Building Type
No. of Workers (20,000 Sq.Ft. Building)
Fees to Reach 10% Goal in 10 Years (per Sq. Ft.) (1) Office 71.8 $33.00 Light Industrial 46.2 $21.20 Retail 50.2 $23.10 Hospital 58.8 $27.00 Lodging 19.0 $8.70 Warehouse 18.4 $8.50 Institutional 16.2 $7.50 Assisted Living 42.0 $19.30
OPTION #2 – FEES BASED ON MIDDLE INCOME HOUSING GOALS a. Option Description
The City’s goals for middle income housing can be used to help inform selection of affordable housing fee levels. The approach below demonstrates the application of the City’s existing middle income housing goals to identify a target funding level and resulting fee levels by building type.
b. Fee Levels for Option #2
Building Type
Fees Based on Middle Income Goals (per Sq. Ft.) Office $19.00 Light Industrial $12.20 Retail $12.00 Hospital $15.50 Lodging $3.50 Warehouse $4.90 Institutional $4.30 Assisted Living $11.10 c. Analysis
Middle Income Housing Goals
The City of Boulder has adopted two specific affordable housing policy goals related to middle income housing including:
(1) Middle Income 450 Unit Goal – The City has a goal to provide 450 units that are permanently affordable to middle income households earning between HUD Low Income to 120% of Area Median Income. Approximately 344 additional units are needed to fulfill this goal.
(2) Maintain the Middle Goal – In 2015, City Council adopted this as one of six goals to help guide the development of a new housing strategy. The overarching goal is to “provide a greater variety of housing choices for middle-income families and for Boulder’s workforce.”
Funding Level Based on Middle Income Goals
The following is an estimate of funding levels reflective of the City’s middle income housing goals:
(1) 450 Unit Middle Income Goal – An estimated $35 Million in funding (current dollars) would be needed to provide the remaining 344 units needed to achieve this goal.
Estimated Funding to Achieve 450-Unit Middle Income Goal
(2) Maintain the Middle Goal – One way to approach the Maintain the Middle goal in relation to new non-residential development is to aim to house a similar share of new middle income workers as the city currently does (roughly 18% from 80% to 120% of Area Median Income). Based on projected employment growth over the next 10 years, this goal would translate into a need for approximately 318 middle income units requiring an estimated $32 million (current dollars) in funding. This funding level reflects the needs of new workers (e.g. creation of new units) and does not include funding to preserve the existing middle income housing stock. Estimated Funding Based on Applying “Maintain the Middle” Goal to New Workers
Note: 10-year projection of job growth per TischlerBise land use assumptions memo.
Applying the two middle income goals results in a similar funding target in the range of $32 - $35 million, or approximately $33.5 million as a mid-point.
Fee Levels to Achieve Target Funding Level for Middle Income
The following table provides an illustration of fee levels that would be sufficient to produce the estimated $33.5 million funding target based on the City’s middle income goals. The illustration allocates fees based on employment by building type.
Adopted Middle Income Production Goal 450 Units Less: Units Produced Toward Goal Units(106)
Remaining Units to Achieve 450 Unit Goal 344 Units
Per Unit Subsidy (affordability gap) $101,700 /Unit
Total Funding Required $35 $Million
Projected City of Boulder Job Growth: 2016-2025 6,336 Workers Adjusted for Commute Share@45% 2,851 Workers Adjusted from workers to [email protected] 1,765 Units Middle Income Units @18% Share (based on current) 318 Units
Per Unit Subsidy (affordability gap) $101,700 /Unit
Cost Per Worker – Middle Income Goals
Illustrative Fee Levels Based on Middle Income Goals
Total Funding Required - 450 Unit Goal $35 $Million Total Funding Required - Maintain the Middle $32 $Million
Average $33.5 $Million
Job Growth: 2016-2025 6,336 Workers
Cost Per Worker $5,286 /Worker
Building Type
No. of Workers (20,000 Sq.Ft.
Building)
Fees Based on Middle Income Goals (per Sq. Ft.) (1) Office 71.8 $19.00 Light Industrial 46.2 $12.20 Retail(2) 50.2 $12.00 Hospital 58.8 $15.50 Lodging(2) 19.0 $3.50 Warehouse 18.4 $4.90 Institutional 16.2 $4.30 Assisted Living 42.0 $11.10
(1) Calculated as number of w orkers X cost per w orker divided by 20,000 SF. (2) Fees in the Retail and Lodging categories w ere adjusted to limit fees based upon the maximum supported by the nexus analysis specific to the middle income category, prior to making a commute adjustment.
OPTION 3 – FEES BASED ON CURRENT INCOME PROFILE a. Option Description
This option identifies affordable housing fees that are reflective of providing a level of affordability to new workers that is consistent with Boulder’s current income profile or level of income diversity. With this approach, new development is not asked to provide for a greater level or depth of affordability than Boulder has today. Using impact fee terminology, Boulder’s current income diversity is used as an existing “level of service” applied to calculate fee levels. In addition, this option also includes a “credit” for
affordable housing needs estimated to be met through Boulder’s Inclusionary Housing program, an important way new development helps to address the need for affordable housing.
b. Fee Levels for Option #3
Fees Reflective of Boulder’s Current Income Profile
c. Analysis
This option adjusts the level or depth of affordability used in calculating fees based on the current income profile of the City. The approach is described below with the complete supporting calculations provided in Tables 1 through 6, attached.
Nexus Result – Housing Need by Income Tier (before adjustment)
The table below identifies the distribution of affordable housing needs by income from the nexus analysis, before making the adjustment described above:
Building Type
Fees based on Current Income Profile
(per Sq. Ft.) Office $34.49 Light Industrial $19.29 Retail $23.39 Hospital $23.59 Lodging $8.09 Warehouse $8.29 Institutional $7.29 Assisted Living $19.39
Affordable Housing Need by Income from Nexus (Before Adjustment)
Source: KMA Nexus Analysis
City of Boulder Existing Income Profile
The estimated existing income profile for the City of Boulder is presented in the table below. Since the nexus is based upon housing needs of workers, data for non-senior family households was selected as a way to approximate incomes of the working-age non-student population in Boulder.
Estimated City of Boulder Income Profile, Non-Senior Family Households
Source: KMA analysis of U.S. Department of Housing and Urban Development, CHAS data set.
Estimates are derived from a special tabulation of U.S. Census American Survey 2008-2012 data available from the U.S. Department of Housing and Urban Development (CHAS data set). Since the income categories presented in this data are not a precise match with the income categories for the nexus technical analysis, linear interpolation was used to make the translation.
Office
Light
Industrial Retail Hospital Lodging Warehouse Institutional
Assisted Living Extremely Low 2.5% 4.7% 26.2% 2.4% 30.3% 13.3% 10.4% 15.2% Low Income 19.1% 25.6% 49.0% 24.9% 47.9% 45.2% 38.1% 46.3% Low to Moderate 11.7% 12.8% 11.6% 14.4% 10.1% 16.1% 16.4% 16.8% Middle Income 24.6% 23.1% 9.6% 29.1% 7.3% 17.8% 22.0% 14.8% Subtotal 57.8% 66.2% 96.5% 70.8% 95.6% 92.4% 86.9% 93.0%
Above Middle Income 42.2% 33.8% 3.5% 29.2% 4.4% 7.6% 13.1% 7.0%
Total 100% 100% 100% 100% 100% 100% 100% 100% Percent of Households Extremely Low 14.4% Low Income 12.9% Low to Moderate 5.3% Middle Income 18.2% Total to 120% AMI 50.8% Above 120% AMI 49.2% Total 100%
Affordable Housing Need by Income Tier – After Adjustment
The affordability by income tier from the nexus technical analysis is adjusted so that the level of affordability is not greater than is represented in the existing income profile of the City.
The table below shows the distribution by income after making this adjustment: Affordable Housing Need by Income Tier (After Adjustment to Boulder’s Income Profile)
The above distribution of housing needed by income tier is used to determine adjusted affordable housing fee levels.
Credit for Inclusionary Housing Program
The Inclusionary Housing program is an important way in which new residential development contributes to the need for affordable housing. This option provides a “credit” for affordable housing needs met through the Inclusionary Housing program. The credit reflects the fact that new workers in new market rate housing will “bring along” some affordable units by virtue of the City’s inclusionary housing requirements. The City of Boulder provided data on affordable housing produced through its Inclusionary
Housing program during the period from 2010-2015. Based on the data provided, it was estimated that, on average, approximately 0.38 affordable units are produced through the program for each market rate unit (which equates to an effective inclusionary percentage of approximately 27.5% = 0.38 affordable units / 1.38 market rate and affordable units). This figure includes units built to meet applicable inclusionary housing requirements as well as units produced using financial assistance resulting from Cash-In-Lieu funds, including the leveraging of those funds with other non-local funding sources such as tax credits. While a figure representing the affordable units that could be produced solely using Cash-In-Lieu, absent leveraging of outside sources, would
Office
Light
Industrial Retail Hospital Lodging Warehouse Institutional
Assisted Living Extremely Low 2.5% 4.7% 14.4% 2.4% 14.4% 13.3% 10.4% 14.4% Low Income 19.1% 22.6% 12.9% 24.9% 12.9% 14.0% 16.9% 12.9% Low to Moderate 11.0% 5.3% 5.3% 5.4% 5.3% 5.3% 5.3% 5.3% Middle Income 18.2% 18.2% 18.2% 18.2% 18.2% 18.2% 18.2% 18.2% Subtotal 50.8% 50.8% 50.8% 50.8% 50.8% 50.8% 50.8% 50.8%
Above Middle Income 49.2% 49.2% 49.2% 49.2% 49.2% 49.2% 49.2% 49.2%
have been lower, the 0.38 figure was selected as a conservative estimate for purposes of applying a credit in the fee analysis.
The historic ratio of 0.38 affordable units for every market rate unit is used to calculate the amount of the credit as illustrated in the table below:
Illustration of Credit for Needs Met by the Inclusionary Program
Since most units produced by the Inclusionary Housing program have served the 31% to 60% income category, the credit is applied primarily to that income tier (see Table 5, attached, for details).
Tables 1 through 6, attached, provided the detail supporting the fee calculations for Option #3.
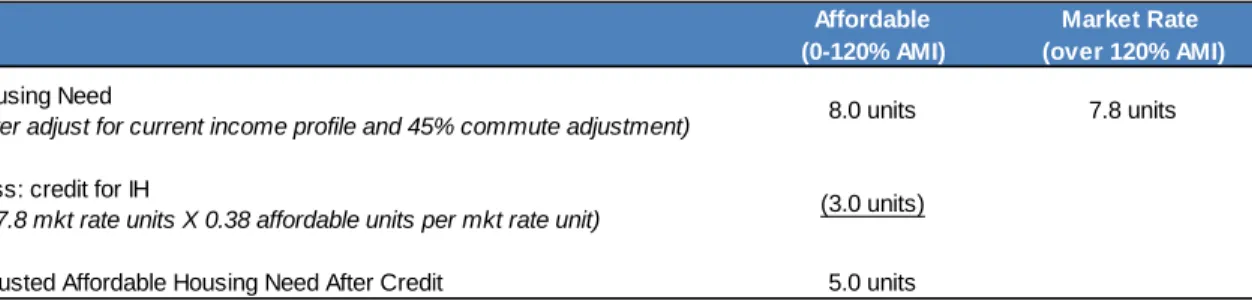
Affordable Market Rate
(0-120% AMI) (over 120% AMI)
Housing Need
(after adjust for current income profile and 45% commute adjustment) Less: credit for IH
(= 7.8 mkt rate units X 0.38 affordable units per mkt rate unit)
Adjusted Affordable Housing Need After Credit 5.0 units
8.0 units 7.8 units
OPTION #4 – FEE RANGE RECOMMENDATION CONSIDERING MULTIPLE FACTORS INCLUDING ECONOMIC / MARKET FACTORS
a. Option Description
Option #4 represents a KMA fee range recommendation based on review of a range of factors including market / economic factors and context regarding linkage fee programs implemented nationally.
b. Fee Levels for Option #4
c. Analysis
1. Nexus Analysis Findings
The KMA nexus analysis found very high supportable fee levels as shown in the table below. The fee levels shown are after a 45% adjustment factor for commuting. The high fee levels supported by the analysis are not unusual for high cost areas such as Boulder. As stated above, the nexus analysis establishes only the maximums for impact fees and will bear little relationship to the lower fee levels the City may ultimately select.
Building Type
Office $10 - $15
Office Bonus FAR (1) $15 - $25
Light Industrial $6 - $8 Retail $6 - $10 Hospital $6 - $10 Lodging $6 - $10 Warehouse $2 - $5 Institutional $2 - $6 Assisted Living $2 - $8 Option #4 Fee Range Based on Multiple Factors Including
Market (per Sq. Ft.)
(1) Suggestion is for a higher fee applicable to FAR additions in the Dow ntow n similar to the structure of the program before being expanded City-w ide.
Note: Nexus findings are not recommended fee levels.
In our opinion, fee levels for cities should be selected based on a combination of the strength of the local real estate market for the building types that will pay the fee, and local policy objectives. We also believe it is appropriate to take into account the fee levels in neighboring jurisdictions and cities that are comparable to Boulder in real estate demand.
2. Fees in Other Jurisdictions Affordable Housing Fees – Colorado
At this time, Boulder is the only jurisdiction on the Front Range that has an adopted commercial linkage fee. Denver is currently in the process of exploring a new program. Several mountain / ski-resort communities have affordable housing requirements applicable to non-residential development, including Aspen and Vail which were surveyed as part of the KMA work scope. The Aspen and Vail programs are not
affordable housing impact fees, rather they are structured as regulatory requirements to provide affordable housing or pay an in-lieu fee instead (much like Boulder’s Inclusionary Housing program). While these resort communities are not comparable to Boulder, the programs represent precedents for non-residential affordable housing requirements in Colorado.
Affordable Housing Fees – Outside of Colorado
More than 30 cities and counties in California have commercial linkage fees, with the majority of programs within the San Francisco Bay Area and Sacramento region. In the Boston area, several communities have linkage fees, including Boston and Cambridge. Seattle recently expanded its linkage fee City-wide with fee levels varying by zone and ranging from $0 to $17.50 within the downtown and South Lake Union areas and $5 to $10 outside the downtown. Portland is also beginning a process of exploring a linkage
Building Type
Nexus Findings with 45% Commute Adjustment (per Sq. Ft.) Office $57.90 Light Industrial $42.90 Retail $71.00 Hospital $57.90 Lodging $26.70 Warehouse $24.20 Institutional $19.90 Assisted Living $57.00
of college / university towns with linkage fees. All located within high-cost metropolitan areas.
The table on the following page provides selected fee level examples. A more
comprehensive listing was previously provided and will be incorporated as part of the full report. There are a wide range of fee levels represented among the adopted programs. The communities with the highest fees nationally are in Silicon Valley and San Francisco where the strength of the local real estate market is able to support high fee levels.
As a way to provide context in terms of the market conditions in each of the communities, a separate chart is also provided that shows office linkage fees (the building type that usually has the highest fees) for selected communities in relation to office rents by city. Office rents are an indicator of market strength and key driver of real estate values.
Office Linkage Fees vs. Average Office Rents in Selected Communities
*Office rents are for "West. L.A.“ West Hollywood Fee will increase from $4 to $8 in FY 16-17 per staff. Shown in chart at $8. **currently $12, increases to $15 (+CPI) over next 3 years. Shown in chart at $15.
Affordable Housing Fee Levels in Selected Communities
Other Impact Fees (non-Affordable Housing)
Tischler Bise has examined impact fees and excise taxes in the communities of
Broomfield, Ft. Collins, Longmont, Louisville, Loveland, Westminster, and Windsor. The following table provides a brief recap. The figures shown for Boulder do not include the affordable housing fees. Broomfield and Westminster have no impact fees for
commercial uses. Ft. Collins has the highest fees of the surveyed communities and is currently in the process of updating its fees.
City Office $/SF Retail $/SF Hotel $/SF
Boulder Current Fees $9.53 $6.96 $1.79*
Linkage Fee Programs
Mountain View, CA $25.00 $2.60 $2.60 Cupertino, CA $20.00 $10.00 $10.00 Palo Alto, CA $19.31 $19.31 $19.31 Cambridge, MA** $15.00 $15.00 $15.00 Santa Monica, CA $11.21 $9.75 $3.07 West Hollywood, CA $8.00 $8.00 $8.00 Berkeley, CA $4.50 $4.50 $4.50 Emeryville, CA $4.10 $4.10 $4.10 Sacramento, CA $2.25 $1.80 $2.14 San Diego, CA $1.76 $1.06 $1.06
Seattle: Downtown/S. Lake Union Seattle: Outside Downtown
Mountain Resort Programs
(fees are alternative to providing units)
Aspen, CO $629 $629 $134
Vail, CO $48 $36 - $101 $17
* Per room fee expressed on a per square foot basis assuming 600 SF per room. ** Currently $12. Increase to $15 (+CPI) phased in over next three years.
ranges from $0 - $17.50 based on zone ranges from $5 - $10 based on zone
Other Impact Fees and Excise Taxes (Excludes Affordable Housing)
Source: TischlerBise
3. Total Development Costs
KMA estimated the total development cost associated with five prototypical building types and examined fee levels in the context of total costs. This facilitates an evaluation of whether the amount is likely to affect development decisions. The prototypes include flex commercial / light industrial, hotel, retail, lower density office, and higher density office. All cost summaries assume lower density surface-parked projects with the exception of the higher density office project which includes the cost of structured parking and higher land costs associated with a downtown or other higher density location.
The results are summarized below:
One useful way to evaluate alternative fee levels is to examine them as a percent of total development costs. Boulder’s adopted fees are currently in the range of 2.5% - 3% of cost for three of the five building types examined. Cities with exceptionally strong real
Boulder- Current ($/SF) Boulder Draft Update (1) ($/SF) Low - comparisaon cities ($/SF) High - comparison cities ($/SF) Broomfield and Westminster Ft. Collins Office $3.52 $5.63 none $13.05 Retail $3.45 $5.42 none $6.31 Industrial $2.74 $4.13 none $2.47
(1) Based on draft Tischler Bise analysis, uses the "Hybrid" scenario for transportation.
Building Type
Approximate Cost Range
($/Sq.Ft.) Lower Density Office $275 - $325 High Density Office
(Downtown & Vicinity)
$475 - $525
Flex Commercial / Light Industrial
$200 - $225
Retail $250 - $300
estate markets have adopted linkage fees representing up to approximately 5% of costs. The table below identifies fee ranges reflective of benchmarks at 3% and 5% of
development cost:
4. Market Strength
Boulder’s economy and commercial market conditions compare favorably to other submarkets in Boulder County and metro Denver. Within the Denver metro area, Class A office rents in Boulder are a close second to downtown Denver. Boulder exhibits strength in the retail sector with rents that are the third highest in the region and low vacancy rates of approximately 3%. The hotel sector is also demonstrating strength with two new hotels currently under development and healthy growth in room rates. High land costs and significant activity in the development pipeline also indicate a healthy market. In addition, Boulder’s diverse economy and high quality of life have historically made the city a desirable place to live and work and will likely continue to do so for the foreseeable future. Any moderate increase in non-residential impact fees will not alter these
conditions, in our opinion.
More discussion of market conditions is provided in the full report (to follow).
5. Option #4 Recommended Fee Level Range Based on Multiple Factors Including Economic / Market
Given the maximums established by the nexus analysis, the strength of Boulder’s office, retail and hotel markets, and linkage fee examples from other communities, KMA
recommends affordable housing fees in the range of $10 to $15 per square foot for office space, $6 to $10 per square foot for retail, lodging, and hospital uses, $6 to $8 per square foot for light industrial, and $2 to $5 for warehouse. While ranges are also identified for institutional and assisted living, it should be noted that these uses are
Building Type Fees at 3% of Costs ($/Sq.Ft.) Fees at 5% of Costs ($/Sq.Ft.)
Lower Density Office $8 - $10 $14- $16
High Density Office (Downtown & Vicinity)
$14 - $16 $24 - $26
Flex Commercial / Light Industrial
$6 - $7 $10 - $11
Retail $7 - $9 $12 - $15
In recognition of the higher real estate values in Boulder’s downtown and the original structure of the City’s affordable housing fee program as applicable to bonus floor area for commercial projects located downtown, an additional suggestion is that the City consider instituting a higher fee structure in the range of $15 to $25 per square foot for bonus or additional floor area. This suggestion would re-establish a premium or
additional affordable housing fee payment for projects that exceed a base floor area allowance.
Option #4 Recommended Fee Level Range Based on Multiple Factors Including Economic / Market Factors
Building Type
Adopted Fee (per Sq. Ft.)
Office $10 - $15 $9.53 $0 - $5
Office Bonus FAR (1) $15 - $25 $9.53 $5 - $15
Light Industrial $6 - $8 $5.62 $0 - $2 Retail $6 - $10 $6.96 -$1 - $3 Hospital $6 - $10 $8.23 -$2 - $2 Lodging $6 - $10 $1.79 $4 - $8 Warehouse $2 - $5 $3.11 -$1 - $2 Institutional $2 - $6 $2.24 $0 - $4 Assisted Living $2 - $8 $2.19 $0 - $6
Fee Range Based on
Multiple Factors Including Market
(per Sq. Ft.)
Net Increase in Linkage Fee with
Recommended Range (per Sq. Ft.)
(1) Suggestion is for a higher fee applicable to FAR additions in the Dow ntow n similar to the structure of the program before being expanded City-w ide.
Criteria Used to Estimate Fees Reflective of Existing Income Profile
1) 45% of workforce continues to be housed locally (mitigate 45% of housing need)
2) Reflect Boulder's existing income profile (i.e. mitigation that does not reflect a deeper affordability than Boulder has today). 3) Apply a credit for units provided through the Inclusionary Program.
INCOME CATEGORY OFFICE
LIGHT
INDUSTRIAL RETAIL HOSPITAL LODGING WAREHOUSE INSTITUTIONAL
ASSISTED LIVING
Extremely Low (0% - 30% AMI) $173,300 1 $0.10 $2.00 $11.50 $0.00 $4.30 $3.80 $2.50 $9.60
Low Income (31% - 60% AMI) $99,800 1 $3.00 $3.70 $0.00 $6.10 $0.00 $0.00 $0.30 $0.00
Low to Moderate (61% to 76% AMI) $219,900 2 $17.30 $4.70 $2.20 $6.10 $0.80 $1.30 $1.70 $1.80
Middle Income (77% to 120% AMI) $101,700 2 $14.60 $9.40 $10.20 $11.90 $3.50 $3.70 $3.30 $8.50
Total $35.00 $19.80 $23.90 $24.10 $8.60 $8.80 $7.80 $19.90
Less: Existing Excise Tax ($0.51) ($0.51) ($0.51) ($0.51) ($0.51) ($0.51) ($0.51) ($0.51)
Total After Adjustment for Existing Excise Tax $34.49 $19.29 $23.39 $23.59 $8.09 $8.29 $7.29 $19.39
Notes:
(1) Assumes rental units. Affordability Gap reflected is the remaining gap after financing available through 4% tax credits. (2) Assumes ownership unit.
(3)
Calculated by multiplying the number of affordable units at the bottom of Table 2 by the affordability gaps and dividing by 20,000 SF.
Affordability Gap Per Unit
Illustrative Fees Per Sq.Ft. of Building Area --- With Above Criteria(3)
Per 20,000 S.F. Building
OFFICE
LIGHT
INDUSTRIAL RETAIL HOSPITAL LODGING WAREHOUSE INSTITUTIONAL
ASSISTED LIVING A. NUMBER OF HOUSEHOLDS BY INCOME TIER ---AFTER 45% COMMUTE ADJUSTMENT, REFLECT EXISTING INCOME PROFILE
Extremely Low (0% - 30% AMI) 0.4 0.5 1.6 0.3 0.6 0.5 0.4 1.3
Low Income (31% - 60% AMI) 3.0 2.3 1.4 3.2 0.5 0.6 0.6 1.2
Low to Moderate (61% to 76% AMI) 1.7 0.5 0.6 0.7 0.2 0.2 0.2 0.5
Middle Income (77% to 120% AMI) 2.9 1.8 2.0 2.3 0.7 0.7 0.6 1.7
Subtotal - Affordable Categories 8.0 5.2 5.6 6.6 2.0 2.1 1.8 4.7
Above Middle Income (> 120% AMI) 7.8 5.0 5.4 6.4 2.1 2.0 1.8 4.6
Total New Worker Households 15.8 10.2 11.0 12.9 4.1 4.0 3.6 9.2 B. LESS: CREDIT FOR INCLUSIONARY HOUSING PROGRAM (1)
Extremely Low (0% - 30% AMI) (0.4) (0.2) (0.3) (0.3) (0.1) (0.1) (0.1) (0.2)
Low Income (31% - 60% AMI) (2.4) (1.6) (1.7) (2.0) (0.6) (0.6) (0.5) (1.4)
Low to Moderate (61% to 76% AMI) (0.2) (0.1) (0.1) (0.1) (0.0) (0.0) (0.0) (0.1)
Middle Income (77% to 120% AMI) 0.0 0.0 0.0 0.0 0.0 0.0 0.0 0.0
(3.0) (1.9) (2.1) (2.4) (0.8) (0.8) (0.7) (1.7)
C. ADJUSTED HOUSING NEEDS AFTER CREDIT FOR INCLUSIONARY PROGRAM, 45% COMMUTE ADJUSTMENT, REFLECT EXISTING INCOME PROFILE
Extremely Low (0% - 30% AMI) 0.0 0.2 1.3 0.0 0.5 0.4 0.3 1.1
Low Income (31% - 60% AMI) 0.6 0.7 0.0 1.2 0.0 0.0 0.1 0.0
Low to Moderate (61% to 76% AMI) 1.6 0.4 0.2 0.6 0.1 0.1 0.2 0.2
Middle Income (77% to 120% AMI) 2.9 1.8 2.0 2.3 0.7 0.7 0.6 1.7
Subtotal - Affordable Categories 5.0 3.2 3.5 4.1 1.3 1.3 1.1 3.0
Notes:
(1) Based on number of units above 120% AMI (assumed to be market rate) multiplied by the ratio between market rate and affordable units achieved through the inclusionary program as shown on Table 5.
Per 20,000 S.F. Building
OFFICE
LIGHT
INDUSTRIAL RETAIL HOSPITAL LODGING WAREHOUSE INSTITUTIONAL
ASSISTED LIVING PERCENTAGE OF HOUSEHOLDS BY INCOME TIER (No Deeper Affordability Than Current) (1)
Extremely Low (0% - 30% AMI) 2.5% 4.7% 14.4% 2.4% 14.4% 13.3% 10.4% 14.4%
Low Income (31% - 60% AMI) 19.1% 22.6% 12.9% 24.9% 12.9% 14.0% 16.9% 12.9%
Low to Moderate (61% to 76% AMI) 11.0% 5.3% 5.3% 5.4% 5.3% 5.3% 5.3% 5.3%
Middle Income (77% to 120% AMI) 18.2% 18.2% 18.2% 18.2% 18.2% 18.2% 18.2% 18.2%
Subtotal - Affordable Categories 50.8% 50.8% 50.8% 50.8% 50.8% 50.8% 50.8% 50.8%
Above Middle Income (> 120% AMI) 49.2% 49.2% 49.2% 49.2% 49.2% 49.2% 49.2% 49.2%
Total 100% 100% 100% 100% 100% 100% 100% 100%
NUMBER OF HOUSEHOLDS BY INCOME TIER ---AFTER 45% COMMUTE ADJUSTMENT, LIMITED TO CURRENT DEPTH OF AFFORDABILITY IN BOULDER (2)
Extremely Low (0% - 30% AMI) 0.4 0.5 1.6 0.3 0.6 0.5 0.4 1.3
Low Income (31% - 60% AMI) 3.0 2.3 1.4 3.2 0.5 0.6 0.6 1.2
Low to Moderate (61% to 76% AMI) 1.7 0.5 0.6 0.7 0.2 0.2 0.2 0.5
Middle Income (77% to 120% AMI) 2.9 1.8 2.0 2.3 0.7 0.7 0.6 1.7
Subtotal - Affordable Categories 8.0 5.2 5.6 6.6 2.0 2.1 1.8 4.7
Above Middle Income (> 120% AMI) 7.8 5.0 5.4 6.4 2.1 2.0 1.8 4.6
Total New Worker Households 15.8 10.2 11.0 12.9 4.1 4.0 3.6 9.2
Notes:
(1) Based on adjusting the distribution of worker household incomes from the nexus such that the depth of affordability does not exceed current levels in Boulder per Table 4.
(2) Based on applying the above percentages to the housing need per the nexus after a 45% adjustment factor for commuting.
Estimated Income Distribution, City of Boulder, Non-Senior Family Households (1)
Extremely Low (0% - 30% AMI) 14%
Low Income (31% - 60% AMI) 13%
Low to Moderate (61% to 76% AMI) 5%
Middle Income (77% to 120% AMI) 18%
Subtotal - Affordable Categories 51%
Above Middle Income (> 120% AMI) 49%
Total 100%
Note: non-senior family households selected to represent the income profile of Boulder's non-student working age population as closely as possible. Source: U.S. Department of Housing and Urban Development CHAS data, a special tabulation of the American Community Survey data set for 2008-2012.
Notes:
(1) Data for non-family senior households is used as a proxy for non-student households likely to be in the workforce. Income categories utilized in the CHAS data set include 0-30% AMI, 31-50% AMI, 51%-80% AMI, 81% to 100%, and above 100%. Linear interpolation was used to estimate the distribution for the income categories used in the nexus analysis from the income categories available in the CHAS data set.
A. B. C.
With On-Site Compliance With Cash In-Lieu
33% comply on-site 67% comply with CIL
avg. of col B.& C. Table 6, Section A Table 6, Section B.
Extremely Low (0% - 30% AMI) 0.05 - 0.07
Low Income (31% - 60% AMI) 0.31 0.21 0.36
Low to Moderate (61% to 76% AMI) 0.02 0.03 0.02
Middle Income (77% to 120% AMI) - -
-Total 0.38 0.24 0.45
Note: Equates to effective inclusionary percentage of: 27.5% (=.38 affordable units / 1.38 market rate + affordable units)
Source: KMA using data provided by the City of Boulder
Avg. Across Projects Complying On-Site &
with CIL Affordable Units Generated Through Inclusionary Program,
Expressed Per Unit of Market Rate Housing
A. Summary of Inclusionary Units Produced through On-site Compliance by Income Level(2)
Market Rate Units In Projects Complying with IH on-site (1) (2) 658
Affordable Units Provided On-Site Total % Units
Aff Units Per Market Rate Unit (no. Aff Units / 658)
Extremely Low (0% - 30% AMI) 0 0% 0.000
Low Income (31% - 60% AMI) 135 87% 0.205
Low to Moderate (61% to 76% AMI) 20 13% 0.030
Middle Income (77% to 120% AMI) 0 0% 0.000
155 0.236
B. Affordable Units Funded with Contribution from Cash In-Lieu, 2010-2015
Local Funding of Affordable Units, 2010-2015 (3) $26,590,506
Average Cash In-Lieu Generated Per Mkt Rate Unit (4) $21,400
Estimated No. Mkt Rate Units to Generate Funds 1,243
Affordable Units Funded with CIL contribution No. Aff Units % Units
Aff Units Per Market Rate Unit (no. aff units / 1,243)
Extremely Low (0% - 30% AMI) 91 16% 0.073
Low Income (31% - 60% AMI) 452 80% 0.364
Low to Moderate (61% to 76% AMI) 22 4% 0.018
Middle Income (77% to 120% AMI) 0 0% 0.000
565 100% 0.455
Notes:
(1) Not including 100% affordable projects.
(2) Includes 112 market rate units in projects that complied through a combination of CIL and on-site units. (3) Includes CIL and other locally-controlled affordable housing funds.
(4) Based on CIL collections exclusive of small projects totaling $29,062,088 divided by 1,358 market rate units in projects paying CIL from 2010-2015.
Source: Data provided by the City of Boulder, March 2016 and summarized by KMA.
Description Transportation Development Excise Tax
Increase existing
Transportation DET to max voter approval
Adopt new Transportation Impact Fee and suspend current Transportation DET
Adopt new Transportation Impact Fee and retain current Transportation DET Methodology/
Approach
No changes Multimodal, plan-based
approach
Increase DET to maximum voter approved levels for residential
Multimodal, plan-based approach
Create new Transportation Impact Fee
Multimodal, plan-based approach
Retain existing
Transportation DET, with current rates.
Create new Transportation Impact Fee
Estimated
Revenue (Annual)
$1.15m $1.79m before credits $900K before credits $2.14m before credits
What the fee/tax would support
Capital Improvement Program (CIP) and Action Plan enhancements
CIP and Action Plan enhancements
CIP CIP plus Action Plan
enhancements Potential
Credits/Policy Adjustments
None Credits for developments in
areas with high multimodal level of service
Percentage reduction for developments in areas with high multi-modal level of service
Percentage reduction for developments in areas with high multimodal level of service
Considerations None Increased annual revenue
over current Transportation DET
Maintain flexible use of funds Residential portion can be raised to maximum voter approved level without new ballot.
Less Revenue than current Transportation DET
Less flexible use of funds Can be enacted by Council
Increased annual revenue over current Transportation DET
Would need to identify which capital projects would be funded by fee and which by the tax.
Description Capital Facility Impact Fees Updated Capital Facility Impact Fees
Methodology/ Approach
Fire: Incremental Expansion Fire: Incremental Expansion
Human Services: Incremental Expansion Human Services: Incremental Expansion Library: Incremental Expansion, Cost-Recovery Library: Incremental Expansion, Cost-Recovery
Municipal Facilities: Incremental Expansion Municipal Facilities: Incremental Expansion, Plan-Based, Cost-Recovery
Parks & Recreation: Incremental Expansion Parks & Recreation: Incremental Expansion Police: Incremental Expansion, Plan-Based Police: Incremental Expansion, Plan-Based
Fee Level Fire: $102/Person; $143/Job Fire: $165/Person; $244/Job
Human Services: $70/Person Human Services: $70/Person
Library: $215/Person Library: $363/Person
Municipal Facilities: $131/Person; $54/Job Municipal Facilities: $222/Person; $155/Job Parks & Recreation: $1,474/Person Parks & Recreation: $2,270/Person
Police: $138/Person; $19/Job Police: $185/Person; $51/Job
What the fee/tax would support
Expansion of capacity for Buildings, Land, Parks, Library Materials, Fire Apparatus, Police Communications Infrastructure
Expansion of capacity for Buildings, Land, Parks, Library Materials, Fire Apparatus and Police Communications Infrastructure
Potential Credits/Policy Adjustments
None. Credit for Affordable housing could be considered under the
state statute.
Considerations Last completed in 2008, based on capital needs at that time.
Based on 2008 service levels.
This was completed before the city’s Capital Investment Strategy process.
Includes updated capital improvements based on current capital plans.
Based on 2015 service levels