Mind Mapping to Gantt Charts
Devina RastogiSyscom Corporation Ltd
Abstract- In this paper starting with a brief introduction of Mind Mapping and Gantt Charts, it describes preparing Gantt Charts by using a day to day example. Also at last it introduces some automated tools available to prepare Mind Mapping and Gantt Charts.
Index Terms- Gantt chart, Mind Mapping
1 Introduction
Mind Mapping, as the name suggests, is a graphical way of representing ideas, concepts of thoughts of an individual. In simple terms it is pictorial way of representing what is on someone’s mind. Mind mapping structure is the optimum layout for visualizing the scope of your projects and creating a Work Breakdown Structure. Not only we can clearly see and communicate the full scope of our project, but we will also discover links, gaps and insights that a linear list of tasks just can’t provide.
Mind mapping enables every individual to fully understand the project, contribute to planning, follow the project timeline and clearly visualize all tasks in an organized manner
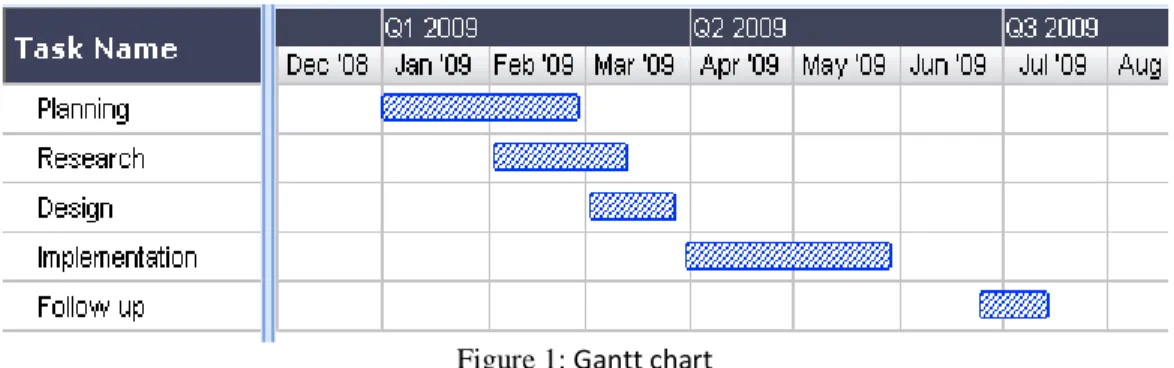
A Gantt chart, on the other hand, is a way of realizing mind mapping for project management purposes. It basically shows activities displayed against time with reference to project management. On the left of the chart is a list of the activities and along the top is a suitable time scale. Each activity is represented by a bar; the position and length of the bar reflects the start date, duration and end date of the activity.
Figure 1: Gantt chart
Now that we have made ourselves familiar with the basic terms, let’s move to the core of this topic i.e. how to effectively map our thoughts and concepts to Gantt charts, so as to use it efficiently in project management purposes.
2. MindMapping: A simple demonstration
As plain text: "Our main revenue comes from machinery sales and service (although the training area is weak), with the North American market being the strongest, while the raw materials supplies division is under-performing against expectations."
Figure 2: Fragment of a mind map
2 Gantt Charts and its Pre-Requisites
A Gantt chart pictorially describes various tasks in relation to each other with a defined timeline view. The first thing we will need before setting up a Gantt chart is a detailed project plan.
Mind mapping encourages creative thinking, will help us to develop a work breakdown structure and ensure that nothing is omitted from the overall project plan. The WBS of the project helps to dissect a project into smaller tasks and their dependency on each other, which are the building units of the Gantt Charts.
• For each task a start, ending date is to be determined along with its relative impact on future tasks. • Set up global resources list and assign resources to tasks.
• Set constraints on the tasks as necessary. • Make final adjustments to the project plan.
Leads and Lags: On the basis of experience, we are able to predict certain time deviations or potential pitfalls that might occur during course of projects. Monitoring and catering the same on GANTT charts can help us to detect potential problems or scheduling conflicts or deviations and make any corrections if required.
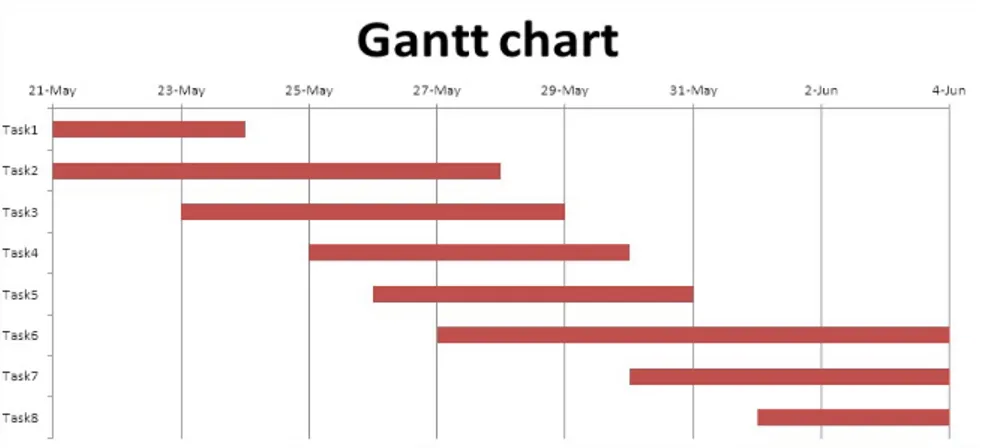
In MSExcel, A simple Gantt chart can be created, putting forth the relative view of the various tasks that are done to accomplish one primary goal.
Mind Mapping Concepts Applied to Create Gantt Charts:
Building up a picture of various inter-relating tasks in our mind that are to be done towards the success of a bigger task/ target and then representing them in the form of relative bar diagram to convey your viewpoint in more coherent and understandable way to the stakeholders.
In reference to a corporate scenario, following process can be a way to achieve the same. Say a meeting is held, to discuss the process and schedule of a project, we have:
1. Taking notes in a meeting.
2. Taking minutes in a brainstorming session for a particular problem. 3. Creating and interpreting schedules.
4. Scoping a new project.
5. Tracking, organizing and grouping “To Do” items.
6. When the brainstorming session is intended to identify a solution to a problem, the end result is often a set of tasks, risks and issues along with probability of their occurrence.
7. The first step would be interpreting realistic schedules of numerous task and representing them in a Gantt chart view against a quantitative timeline, say from 1’Jan’2016 to 15’Feb’2016.
8. Various tasks can be scheduled similarly with independent or overlapping timelines.
9. An in-house or an outsourced tool can be used to import various tasks individually and combine them a common
Gant Chart.
10. Alternatively, a mapped view of can be created centered around a common activity that can be interpreted via a tool to construct a relative view of the activities.
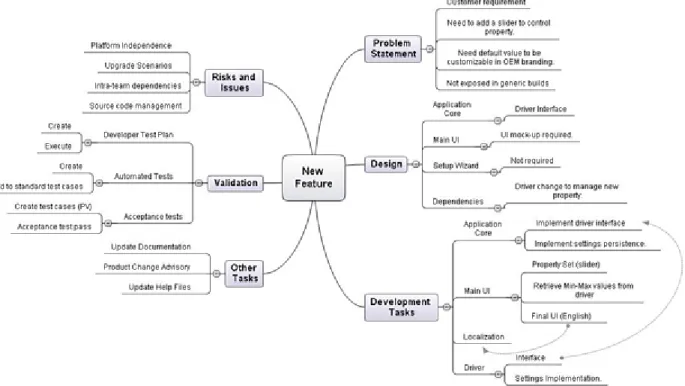
11. Brainstorming, Creating and Interpreting Schedules
Figure 4: Sample view of brainstorming
12. The starting point is typically a blank mind map with the issue in the center. It may start with a couple of leading concepts that are obvious aspects of the problem being solved, or it might start by asking for a problem definition. As there are typically various stakeholders in the room, there are usually a range of viewpoints as to what the key issues might be.
13. After the meeting, it is quite simple to spend a little time “polishing” the organization and then export the results into Microsoft Word to be sent out as minutes.
14. Once every stakeholder or person in the meeting is in sync with regarding the chart created, schedules can be
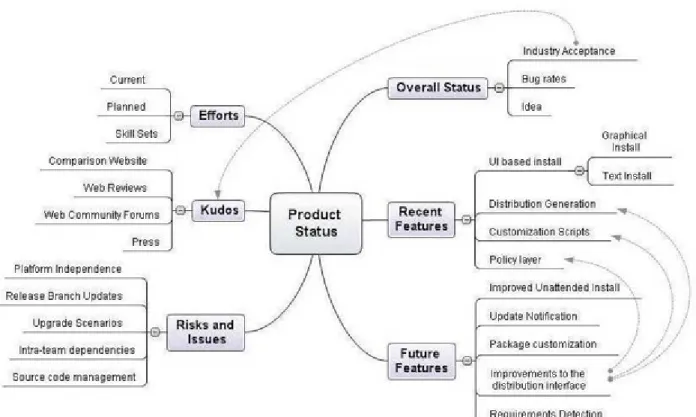
15. Creating and Interpreting Schedules
Figure 5: Sample view of creating schedules 16. Incorporating effort estimates and relative dependencies, voila.
17. Often then, the end result of the brainstorming session is a mind map that includes a plan on how to address the problem and a schedule that covers the efforts involved.
3 TOOLS Available
Mind mapping structure is the optimum layout for visualizing the scope of your projects and creating a Work Breakdown Structure.
There are many computer applications supporting the use of Gantt charts for employee scheduling. There are many dedicated Gantt chart software products (both paid and free) available on the internet. However, it is also possible to use common desktop programs (such as Microsoft Excel) to create simple Gantt charts. We can draw charts by hand or use specialist software, such as Gantto, Matchware, or Microsoft Project. Several Gantt templates have been created for Microsoft Excel, and you can also find free templates with a quick search online.
Lastly, Effective planning is the key: While the tools may aid the process of developing Gantt Charts, it’s the accuracy and creativity in the analysis that is the key to use this mind mapping tool effectively. The more in depth and accurate concepts we have, the more optimized results we produce.
4. Acknowledgment
I would like to acknowledge my co-workers for supporting and encouraging me throughout the course work.
5. References
1. MindView Software distributed by MatchWare. 2. Gantt.com
6. Author
Author Name: Devina Rastogi
Qualification /Experience: Currently working with Syscom Corporation Ltd, a leading telecom companydealing in SIM and
SMART cards.