CCAT-prime
Wall-climbing Robot
Yefei Si
Cornell University Master of Engineering (M.Eng.) Department
of Mechanical and Aerospace Engineering
Table of Contents
Abstract
3
Acknowledgement
3
List of terms
4
Introduction
5
Background
5
Literature Review
5
Theory
6
Design Procedure
7
Results and discussion
12
Conclusion
13
Abstract
This is a final report of the MAE6900 independent research project of Yefei Si. The main
goal of the project is to build a wall-climbing robot used for data measurement on the
CCAT-prime telescope in Cerro Chajnantor, Chile. My job was to build the overall control system and
design the danger loop of the robot. Due to the severe COVID-19 epidemic situation and
quarantine, I had few accesses to the lab, so I converted all design and test on the simulation.
This report mainly focuses on the danger loop control design in the robot system, hardware of
edge detecting and a simulation about the robot’s recognition of an edge and a gap.
Acknowledgement
I’d like to acknowledge all the supports from my project advisor Dimtry
Savransky, the project engineer Stephan, project header Terry and all engineers
from the mechanical group and the control group. Their guidance and efforts are
the key to develop this project and I really enjoy working with them and learn from
them.
List of terms
• Mirror panels: aluminum panels with a size of 0.6 m x 0.7m • Panel gap: small distance between two mirror panels • Edge: the edge of the entire telescope mirror
• Peak: A period of readings of the edge sensor from which the sensor first reaches the gap to which the sensor completely crosses the gap.
Introduction
The robot is designed for performing data measurements on the CCAT-prime telescope and the work environment will require the robot work at heights. Therefore, a control system called “danger loop” that keeps the robot’s safety is necessary. The danger loop control is run parallelly with the main control function and keeps receiving edge sensor readings to warn the robot of the danger of the edge and trigger the tether system to rescue the robot if it accidentally falls from the edge. Another function of the danger loop is to allow users to terminate the robot’s work immediately and command the robot to go back to the starting point. Due to the COVID-19 epidemic situation, the lab and robot are neither accessible and algorithm tests were conducted on Matlab simulator with a toolbox called iRobot. This paper mainly focuses on the hardware setup for edge sensors, the design procedure of logic flowchart of and simulation tests.
Background
CCAT-p telescope located in Cerro Chajnantor, Chile and is designed to operate at submillimeter to millimeter wavelength, 200-3100 μm and it features a “crossed-dragone” optical design with a 6-meter aperture. (Ruohan Gao and Seth McCall, 2019) There is a primary mirror and a secondary mirror, which is made of 77 and 69 aluminum mirror panels respectively. The wall-climbing robot is required to travel around two mirrors, cross the panels with different angles of inclination and perform data measurements.
The wall-climbing robot has been developed for approximately two years and is able to localize itself with a laser measurement system from ETALON AG, which utilizes a reflective puck to reflect lasers and obtain the robot’s location in the telescope frame. The control system of the robot utilizes the Kalman Filter algorithm to track the robot's location and has been simulated to track 9 testing points on a sample aluminum panel successfully. The real robot can track the testing points within an error of 1 cm. According to the constraints of the telescope's surface, the robot cannot cause damage to the wall while climbing. Therefore, the engineers from the mechanical team designed two powerful fans to provide suction power to force the robot stick to the wall. The robot is currently able to move on an aluminum panel with inclination of 60 degrees. However, powerful fans also bring severe vibration problems and all control tests were conducted without adding the fan noise so far. The robot consists of an Arduino board, which is used for collecting all sensor readings and processing low level programming scripted in C, and a Raspberry Pi board, which is used for processing the main integration functions, and other high-level programming scripted in Python. Wenbo, Xiaotian and I have debugged and rebuilt the overall hardware system to improve accuracy of the control system. Xiaotian also built a manually control interface using matlab GUI.
Literature Review
This literature review mainly focuses on the gap detection test conducted by Ruohan Gao and Seth McCall in 2019. They used a QRE1113 Line Sensor to detect a 1-mm gap between two aluminum panels and one Arduino MKR1000 Microcontroller to obtain readings from the line sensor. They put two aluminum panels right next to each other and moved the line sensor manually across the gap with a
constant velocity that is much larger than the maximum velocity of the robot. They tested with two different sampling rates: 1kHz and 1MHz. Figure X shows the result of the sensor reading plot when the sensor was moving with a velocity of 825 mm/s to cross the 1-mm gap with a 100MHz sample rate.
Figure 1. Gap detection results from Ruohan Gao and Seth McCall’s M.Eng Report
Theory
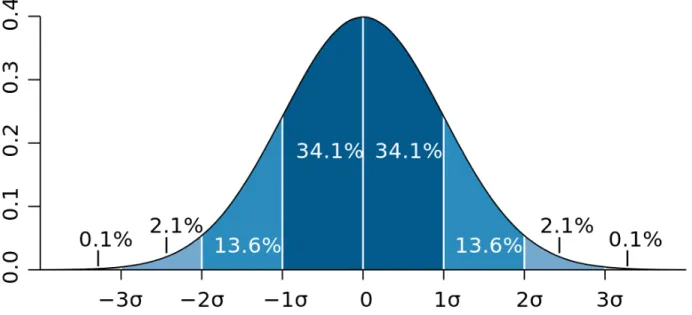
From the gap detection result, the peak of the readings can be generally modeled as a normal distribution. It has the mean 𝜇 equal to the time when the peak is reached and the width of peak equal to 2 times of the standard deviation, 2𝜎. According to the normal distribution, two standard deviations from
the mean account for 95.45%. Figure X shows the relationship between standard deviation and the coverage.
Figure 2. relationship between standard deviation and the coverage probability from wikipedia
This plot shows the time period of 4𝜎contains the majority of gap information needed for detection. The reason why 6𝜎is not chosen for describing the width of the peak is that there are noise around two ends of the peak and period of 6𝜎 does not fit the data well.
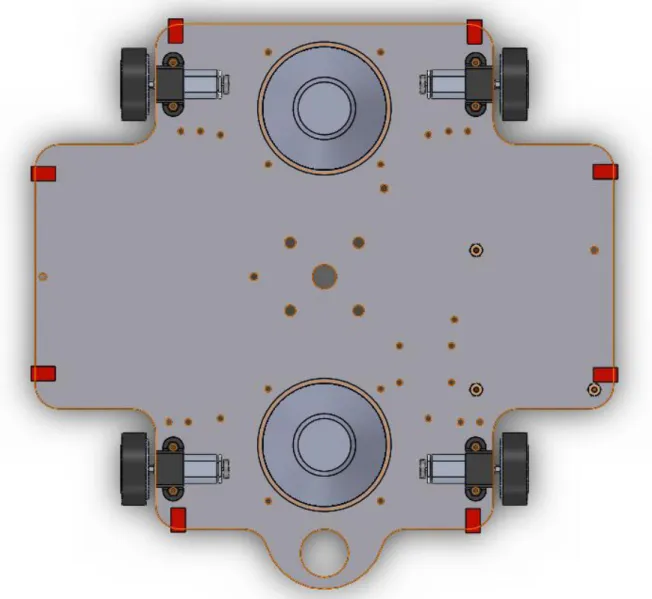
Design Procedure
The danger loop can be divided into two sections: hardware and software. One thing that needs to be considered is the location of the edge sensors on the robot. First, the edge sensors have to be installed on the edge of the robot, because it has to discover a gap or an edge before the robot really reaches there and gives warning to the robot. However, the location must leave enough space for the robot to react to the edge warning. Figure X is the cad screenshot of a car board from the top view. The red rectangles on the board indicate the edge sensors with a size of 1cm x 0.6 cm. There are 8 edge sensors located at the edge of the robot. Figure X and X shows the distance from the edge sensor to the wheel and the distance from edge sensor to inner edge of the car body. These two distances have to be proved enough for the robot to make reactions. Since the lab is not accessible during quarantine, the gap detection data provided by Guohan and Seth was used to calculate the distance for the robot to react. Assume the edge sensor has a sampling rate of 100MHz, the width of peak from the first plot in figure X is approximately 4.5ms. The edge sensor was moving with a velocity of 825mm/s. In the period of detecting the gap, the car made a displacement of 825𝑚𝑚/𝑠 × 4.5𝑚𝑠 = 3.7125𝑚𝑚 = 0.37𝑐𝑚. The readings for edge detection are a little different from ones from gap detection. The readings don’t after the robot reach the edge, so the robot can tell the difference between the gap and the edge just by the shape of readings in a time period of 4𝜎. Therefore, 0.37 is the approximate distance that the robot can
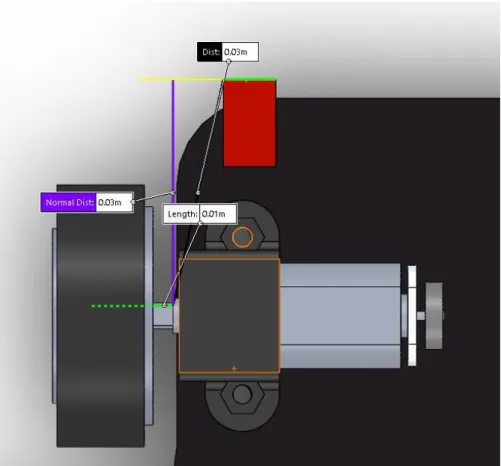
move during the gap and edge detection. The distance between the edge sensor and the wheel and the distance between the edge sensor and inner edge of the robot body are much larger than the 0.37cm, which proves that the location of edge sensors are feasible.
Figure 4. The distance from the edge sensor to the wheel
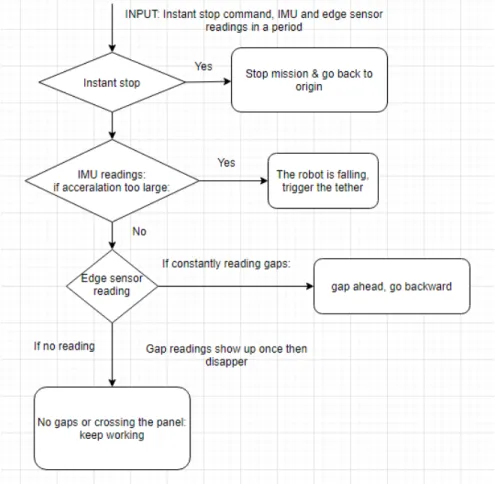
For the software part of the danger loop, it will be run parallelly to the main control function in Raspberry Pi board. Figure X is the logic flowchart of the danger loop. The danger loop takes instant stop command, readings from I.M.U (Inertial Measurement Unit) and a series of readings from edge sensors as inputs. The first condition is to check whether users want to immediately terminate the mission of the robot, which has the highest priority. If yes, the robot will follow its own trajectory and go back to the starting point. This returning function is still not developed yet and will be developed in the integration of the main control function in the future. The second condition is to check whether the robot is falling in the middle of the air by accessing the I.M.U data. I.M.U data is able to show the accelerations of the robot, which will be incredibly high when the robot falls. Ideally, the I.M.U data can show that the acceleration of the robot is approximately 9𝑚/𝑠 2and thus, the threshold for this condition can be set to 6𝑚/𝑠 2. If the readings exceed the threshold, the tether system will be triggered to rescue the robot. The tether system is now still being developed and the trigger function is still not available. The last condition is to check the readings from edge sensors. The robot can tell the difference between the gap and the edge is by checking the shape of the data during a period of time. Therefore, the danger loop will take a series of readings from edge sensors and these readings will be long enough to contain the information from the peak and also a part of information before and after the peak. Assume the sampling rate is 100MHz and the period of reading data is 7.5ms, the length of data obtained by the danger loop in each time step will be 750000, which can be resample to a length of 1000.
According to the relationship between standard deviation and coverage probability, the threshold for reading a gap can be defined as the reading value at time 𝜇 + 2𝜎, in which 𝜇 is the time when maximum reading at and 𝜎 is the covariance.
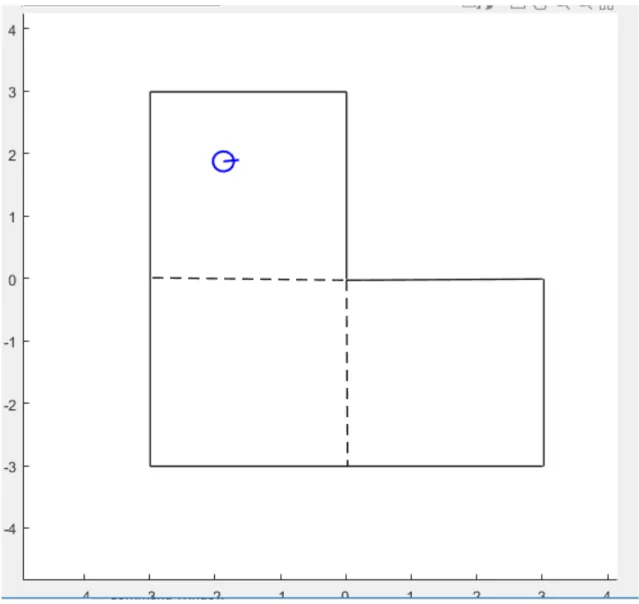
During the COVID-19 quarantine, the lab is closed, and the tests of danger loop were conducted on the Matlab simulation. The toolbox called iRobotCreateSimulator was used. In Figure X, the workspace is defined by three 3x3 mirror panels. The blue circle with a handle represents the robot with an orientation that the handle is pointing to. The edges are defined by black lines and the gap is defined by the dash lines. The robot was traveling with a velocity of 0.1 meter/s. Since the main function that needs to be run in Raspberry Pi and edge sensors are not available at this time, I designed the backup function when the robot detects an edge as the robot travels backwards and turns an angle by 30 degrees. I also defined the signal as a shape of normal distribution when the robot crosses the gap just to check the danger loop is fully functional.
Results and Discussion
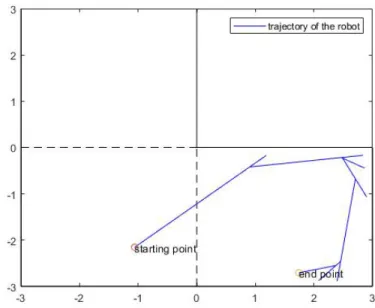
Figure 8 and 9 shows the two trajectories of robots with two different starting positions, in which the robot crossed the gap and bounced back successfully when it hit the edge.
Figure 8. Trajectory of the robot running in the danger loop simulation
The robot successfully told the difference between a simulated edge signal and a simulated gap signal. However, more tests should be done to determine the threshold of gap or edge detections. Since the gap detection from Ruohan and Seth were directly conducted when two aluminum panels were placed horizontally. In the structure of the CCAT-prime telescope, there will be a certain angle between two mirror planes, and this angle might affect the readings of edge sensors. Another fact needs to be taken into consideration is that the vibration caused by fans. All simulations and edge detection tests are done without operating fans, and the vibrations will lead to the offset to the data obtained by sensors.
Conclusion
Without the IMU data, the main integration function, gap detection simulation is the only part that can be done for the danger loop. The robot is able to tell the difference between gaps and the mirror edges. For hardware, the location of edge sensors has been settled. However, the consideration of the location did not include the other electronic units installed on the board. Hence, the mechanical team will need to rearrange the layout of the car board to make room for edge sensors. For future work, more tests need to be done for deciding the gap detection threshold with two fans operating. The danger loop scripted in Python has left space for I.M.U code and real backup functions. Finally, I appreciate the support from all engineers from the mechanical team, the control team and Dr. Savransky.
Reference
● Ccatobservatory.org. 2019. CCAT. http://www.ccatobservatory.org/
● “Normal Distribution.” Wikipedia, Wikimedia Foundation, 18 May 2020, en.wikipedia.org/wiki/Normal_distribution.
● QRE1113, QRE1113GR Miniature Reflective Object Sensor. Fairchild Semiconductor Corporation, 2011, cdn.sparkfun.com/datasheets/Sensors/Proximity/QRE1113.pdf.
● R. Gao, S. McCall, “CCAT-prime Wall-Climbing Robot M.Eng Report”, Cornell University. Accessed on May 22, 2020
● SparkFun Line Sensor Breakout - QRE1113 (DIgital) - ROB-09453 - SparkFun Electronics.Sparkfun.com. https://www.sparkfun.com/products/9453