B-type natriuretic peptide and cardiac troponin I are associated
with adverse outcomes in stable kidney transplant recipients
Petr Jarolim, MD, PhD1, Brian L. Claggett, PhD2, Michael J. Conrad, MLA1, Myra A.
Carpenter, PhD3, Anastasia Ivanova, PhD3, Andrew G. Bostom, MD4, John W. Kusek, PhD5, Lawrence G. Hunsicker, MD6, Paul F. Jacques, DSc7, Lisa Gravens-Mueller, MS3, Peter Finn, MD2, Scott D. Solomon, MD2, Daniel E. Weiner, MD8, Andrew S. Levey, MD8, and Marc A. Pfeffer, MD, PhD2
1Department of Pathology, Brigham and Women’s Hospital, Harvard Medical School, Boston, MA
2Department of Medicine, Brigham and Women’s Hospital, Harvard Medical School, Boston, MA
3Department of Biostatistics, University of North Carolina
4Rhode Island Hospital, Providence, RI
5National Institute of Diabetes and Digestive and Kidney Diseases, Bethesda, MD
6University of Iowa, Iowa City
7US Department of Agriculture, Jean Mayer Human Nutrition Research Center on Aging, Boston,
MA
8Tufts Medical Center, Boston, MA
Abstract
Background—Approximately 200,000 kidney transplant recipients are living in the US; they are at increased risk for cardiovascular and other adverse outcomes. Biomarkers predicting these outcomes are needed. Using specimens collected during the FAVORIT (Folic Acid for Vascular Outcome Reduction In Transplantation) trial, we determined whether plasma levels of B-type natriuretic peptide (BNP) and cardiac troponin I are associated with adverse outcomes in stable kidney transplant recipients.
Methods—510 subjects were selected randomly from the 4110 FAVORIT participants. This cohort was then enriched for all additional subjects with adverse outcomes (death, dialysis-dependent kidney failure and cardiovascular outcomes) for total 1131 participants studied.
Address for correspondence: Petr Jarolim, MD, PhD, Department of Pathology, Brigham and Women’s Hospital, 75 Francis Street, Boston, MA 02115. [email protected], Phone 617-732-6672, Fax 617-731-4872.
Authorship
P.J. and M.A.P. designed the study. P.J. and M.J.C. collected the laboratory data. P.J. wrote the article.
B.L.C., M.A.C., and A.I. performed the statistical analysis.
A.G.B., J.W.K., L.G.H., P.F.J., P.F., S.D.S., D.E.W., A.S.L., and M.A.P. participated in clinical data collection, patient follow-up, and
HHS Public Access
Author manuscript
Transplantation
. Author manuscript; available in PMC 2018 January 01.Published in final edited form as:
Transplantation. 2017 January ; 101(1): 182–190. doi:10.1097/TP.0000000000001080.
A
uthor Man
uscr
ipt
A
uthor Man
uscr
ipt
A
uthor Man
uscr
ipt
A
uthor Man
uscr
Quartiles of BNP and high sensitivity cardiac troponin I (hs-cTnI) were included in adjusted models. Combinations of normal and elevated hs-cTnI (>26.2 ng/L) and BNP (>100 pg/mL) were also studied.
Results—Median concentrations and interquartile ranges were 5.6 (3.3, 10.5) ng/L for hs-cTnI and 39 (15, 94) pg/mL for BNP. Hazard ratios for each adverse outcome were higher with higher quartiles of BNP after adjustment and remained statistically significant after adding hs-cTnI to the model. The highest quartile hazard ratio for dialysis dependent kidney failure was 2.47 (95% CI 1.21–5.05). Simultaneous elevations of BNP and hs-cTnI over clinical cutoffs were strongly associated with adverse outcomes with hazard ratios 8.8 (3.4–23.1) for dialysis dependent kidney failure and 6.3 (2.7–15.0) for cardiovascular outcomes.
Conclusions—Higher BNP is associated with mortality and cardiovascular and kidney
outcomes in stable kidney transplant recipients. Elevated BNP and hs-cTnI identify candidates for targeted risk reduction.
INTRODUCTION
Approximately 17,000 kidney transplants are performed annually in the United States1 and about 70,000 annually worldwide.2 Currently, there are approximately 200,000 living kidney transplant recipients in the US (144,180 in 20093). Despite decreased glomerular filtration rate (GFR) in most kidney transplant recipients, mean 10-year graft survival ranges from 34% to 48% in US patients and is as high as 56% in Europeans.4 Increasing graft survival underlies the fact that other chronic complications are increasingly important in this population. Both cardiovascular disease (CVD) and failure of the kidney transplant are common and have substantial impact on morbidity and mortality in this population. Biomarkers to identify kidney transplant recipients at increased risk for adverse outcomes may lead to improved management of these patients.
Natriuretic peptide and cardiac troponin I and T immunoassays have demonstrated remarkable ability not only to diagnose myocardial infarction and heart failure but also to predict multitude of adverse outcomes. The B-type natriuretic peptide (BNP) and the N-terminal pro-B-type natriuretic peptide (NT-proBNP) have become established biomarkers of heart failure5 and cardiac troponins I (cTnI) and T are used for the diagnosis of acute myocardial infarction. However, elevations of cardiac troponins are not unique to acute myocardial infarction; they have been described in a number of additional acute and chronic conditions.6,7
Since BNP and NT-proBNP respond to volume overload, they are elevated in chronic kidney disease (CKD).8–10 Increased cTn levels have also been described in patients with CKD11, which can limit diagnostic utility of cTn assays for acute myocardial events in patients with decreased GFR12 but, at the same time, may underlie the reported predictive value of cTn for cardiac events and mortality in patients with CKD.13
However, whether these findings can be applied to kidney transplant recipients is not known. We conducted a case-cohort study of specimens collected from stable kidney transplant recipients during their participation in a clinical trial of homocysteine lowering, the Folic
A
uthor Man
uscr
ipt
A
uthor Man
uscr
ipt
A
uthor Man
uscr
ipt
A
uthor Man
uscr
Acid for Vascular Outcome Reduction In Transplantation (FAVORIT) trial, to assess whether levels of BNP and hs-cTnI are associated with adverse outcomes.
METHODS
Subjects in the parent study
The FAVORIT trial was a randomized, multi-center, double-blind controlled trial conducted in stable kidney transplant recipients to evaluate whether a homocysteine-lowering vitamin intervention reduced the risk of cardiovascular events. The design and primary outcome of the trial has been described previously.14–16 Briefly, a total of 4110 stable kidney transplant recipients were enrolled from 2002 to 2007 and randomized to treatment with either a multivitamin with a high dose of folic acid (5.0 mg), vitamin B6 (pyridoxine, 50 mg), and vitamin B12 (cyanocobalamin, 1.0 mg) or a multivitamin with lower doses of vitamin B6 (1.4 mg) and B12 (2.0 µg) and no folic acid. Individuals age 35–75 years who lived with a transplanted kidney for at least 6 months were screened for eligibility at 30 transplant centers located in the US, Canada, and Brazil. Inclusion criteria were an elevated serum homocysteine level (> 11 µmol/L for women and > 12 µmol/L for men) and stable kidney function (creatinine clearance of >30 mL/min in men and >25 mL/min in women).
Exposures
Risk of adverse outcomes was evaluated based on biomarker results categorized by two different methods; first, as quartiles of BNP and high sensitivity cardiac troponin I (hs-cTnI), and second, using clinically utilized cutoffs for hs-cTnI and BNP. Both methods were included in models adjusted for baseline age, gender, race, treatment assignment, history of smoking, coronary heart disease, diabetes, urine albumin/creatinine ratio (ACR), eGFR, BMI, blood pressure, lipid levels, graft vintage and donor type. Most of these variables were determined at baseline.
Outcomes
Cardiovascular outcomes studied were MI, hemorrhagic or non-hemorrhagic stroke, resuscitated sudden death, or cardiovascular death. These events were reviewed and
adjudicated centrally, blinded to treatment group assignment. In our analysis, we considered these outcomes as a composite. Secondary outcomes were all-cause death and dialysis-dependent kidney failure (DDKF), defined by a requirement for maintenance dialysis for at least 3 months or until a transplant is received. These outcomes were evaluated alone and combined with the cardiovascular composite outcome. Follow-up in-clinic visits were scheduled every 6 months and events of interest were ascertained through June 24, 2009. Cardiovascular death, MI, resuscitated sudden death and stroke were centrally reviewed and adjudicated by the Clinical Endpoints Committee; the remaining outcomes were identified through medical record abstraction. Over median follow-up of 3.9 years, there was no difference in the primary outcome between the two treatment groups, facilitating use of FAVORIT trial data for cohort analyses.16
A
uthor Man
uscr
ipt
A
uthor Man
uscr
ipt
A
uthor Man
uscr
ipt
A
uthor Man
uscr
Selection of cases and subcohort
A case-cohort design is an efficient approach for analyzing failure times in a population where exposure information is not readily available for all subjects and clinically outcomes are relatively rare, and is considered more flexible than a case-control design.24 From the 3530 FAVORIT participants with complete baseline data, including serum creatinine and lipid studies as well as urine albumin to creatinine ratio, we selected a random sample of 530 (15%) stratified by treatment group assignment. The random sample included 136 FAVORIT participants who had at least one study outcome. This random sample was supplemented by ‘cases’, specifically adding all additional 601 FAVORIT participants with adverse outcomes for a total of 737 subjects having one or more adverse outcome.
Baseline patient data
Baseline data included age, gender, race, treatment group, country, smoking status, medical history (CVD, hypertension, diabetes mellitus), transplant characteristics (living donor kidney, time since transplant), physical examination findings (body mass index (BMI), systolic and diastolic blood pressure), and laboratory variables (serum creatinine, homocysteine, serum total cholesterol, high density lipoprotein (HDL) cholesterol, low density lipoprotein (LDL) cholesterol, triglycerides, and urine albumin and creatinine). Previous CVD was defined as prior myocardial infarction, coronary artery revascularization, stroke, carotid artery revascularization, abdominal or thoracic aneurysm repair and/or lower extremity arterial revascularization based on participant self-report and medical records, if available. Serum creatinine was assayed in 2011 from frozen sera stored at −80° C obtained at the baseline study visit participants using an alkaline picrate kinetic method on an Olympus AU 400e (Olympus America Inc., Center Valley, PA) analyzer that was calibrated to an isotope dilution mass spectrometry (IDMS) traceable standard. GFR was estimated with the CKD-EPI (Chronic Kidney Disease Epidemiology Collaboration) 2009 creatinine equation.17 Self-reported race was categorized as white, black, or other; individuals who identified as “other” and the 27 individuals who had missing information were classified as white to estimate GFR. BMI was calculated as weight (kg)/height (m)2. Mean baseline eGFR of all study participants was 48.8 ± 16.2 mL/min/1.73 m2. Blood pressure was measured twice in a rested seated position and the values averaged. Hypertension was defined either by a systolic blood pressure >140 mmHg, diastolic >90 mmHg, or use of antihypertensive medication at study enrollment. LDL cholesterol was estimated using the Friedewald equation at triglyceride levels below 400 mg/dL and measured in the 234 participants with triglyceride levels above 400 mg/dL. Diabetes was defined by patient medical history or the use of insulin or oral hypoglycemic medications.
Biomarker testing
Cardiac biomarkers were measured in previously unthawed baseline EDTA-anticoagulated plasma samples that had been stored at −80°C prior to assay. These specimens were thawed and centrifuged in batches immediately prior to testing on the Abbott Architect i2000SR immunoanalyzer (Abbott Diagnostics, Lake Forest, IL). Cardiac troponin was measured using an investigational high sensitivity cTnI (hs-cTnI) assay (Abbott ARCHITECT STAT High Sensitive Troponin-I). The reported limit of detection is 1.5 ng/L to 3 ng/L with
A
uthor Man
uscr
ipt
A
uthor Man
uscr
ipt
A
uthor Man
uscr
ipt
A
uthor Man
uscr
reported coefficient of variation (CV) of 10% from 5.6 ng/L18 to 7 ng/L.19 Recent analytic characterizations identified 99th percentiles ranging from 14.8 ng/L to 27.0 ng/L.18–21 We used the 99th percentile threshold of 26.2 ng/L, which is recommended in the assay package insert22, to define elevated hs-cTnI. BNP concentrations were measured using the
commercially available Abbott ARCHITECT BNP assay. The assay range is 10–5,000 pg/mL, with a CV of 4.4% at 92 pg/mL and 1.7% at 3,572 pg/mL. Although the reference range for BNP varies with sex and age, we used the commonly accepted single diagnostic cutoff of 100 pg/mL.23
Statistical Analyses
Statistical analyses accounted for the case-cohort design using the Barlow method for robust variance estimation.24,25 BNP and cTnI values for individuals in the random sample were categorized into quartiles for reporting baseline characteristics and for weighted proportional hazards modeling. The association of BNP and hs-cTnI concentrations with clinical
outcomes was assessed with unadjusted and adjusted Cox regression models. Adjusted models included age, sex, race, multivitamin allocation, country, smoking, history of cardiovascular disease, diabetes mellitus, ACR, eGFR, BMI, blood pressure, lipid levels, graft vintage and donor type. These associations were examined for each cardiac biomarker alone and after adjustment for the other biomarker.
To determine the prognostic importance of simultaneous elevations of both biomarkers, we evaluated the highest quartiles of BNP and hs-cTnI combined with the three lowest quartiles. In addition, since clinical intervention is likely to be based on the detection of elevations of BNP or cTnI above the cut points of 100 pg/mL for BNP and 26.2 ng/L for hs-cTnI in use by most clinical laboratories, we evaluated combinations of low and elevated BNP and hs-cTnI. We also tested for interaction between clinically elevated BNP and cTnI
concentrations by including an interaction term in the Cox models denoting the
simultaneous elevation of both biomarkers. P-values <0.05 were considered statistically significant. All analyses were conducted in SAS, Version 9.2 (SAS Institute Inc., Cary, NC).
RESULTS
Study subjects
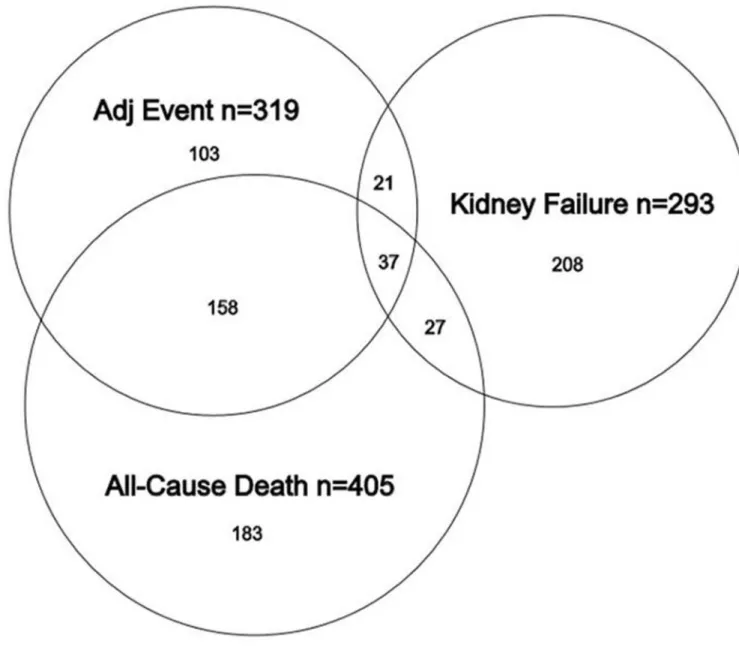
From 3530 participants potentially eligible for this case-cohort cohort substudy, 737 were identified as having one or more outcomes of interest, including 405 deaths, 293 DDKF events and 319 cardiovascular events. Among the randomly selected 530 participant sub-cohort, 136 had at least one clinical outcome and, by definition were also included among the 737 participants with events, resulting in a total study population of 1,131 participants (Table 1 and Figure 1)
Baseline characteristics
Of the randomly selected 530 participant sub-cohort, 510 had complete data regarding hs-cTnI, BNP, demographic information, and CVD history. Mean age of participants was 51.6 ± 9.2 years; 38% were women, 37% had diabetes, 19% had CVD, 42% received a living
A
uthor Man
uscr
ipt
A
uthor Man
uscr
ipt
A
uthor Man
uscr
ipt
A
uthor Man
uscr
donor kidney, and mean eGFR was 45.9 ± 18.2 ml/min/1.73 m2. Follow-up ranged from 0 to 82 months with a mean of 4.0 ± 1.5 years.
Baseline characteristics by quartiles of hs-cTnI and BNP are summarized in Tables 2 and 3, respectively. The median (interquartile range) concentrations in the random cohort (n= 510) were 5.6 (3.3–10.5) ng/L for hs-cTnI and 39.4 (15.3–93.6) pg/mL for BNP. Of the total of 1131 patients studied, 1111 (98.2%) had detectable cTnI concentrations. BNP was measurable in all participants. Of the 510 randomly sampled patients, 6% had cTnI concentrations greater than the recommended 99th percentile of 26.2 ng/L and 24% had values greater than the single-value cutoff of 100 pg/mL. Within the random cohort, higher BNP and hs-cTnI levels were significantly associated with older age, unrelated donor type, history of CVD and diabetes mellitus, higher systolic BP, lower eGFR and higher urine ACR. There was no association of sex, race, graft vintage, smoking, or BMI with either BNP or hs-cTnI within the subcohort.
BNP
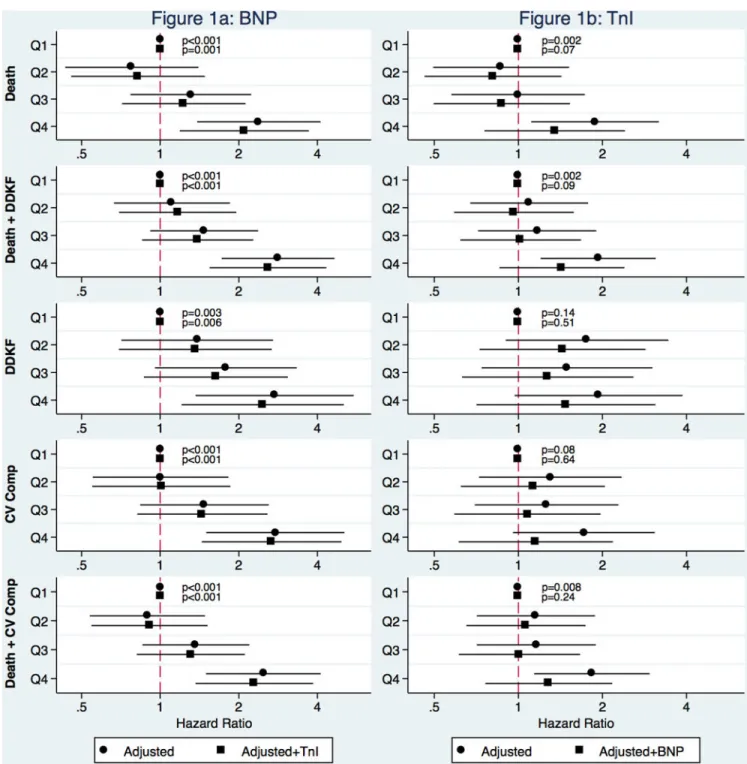
Figure 1a shows the hazard ratios (HRs) for quartiles of BNP in the fully adjusted model and in the same model with an additional adjustment for the hs-cTnI. HRs for each fatal and nonfatal outcome were significantly higher with higher quartiles of BNP after adjustment and remained significant in the model which also included hs-cTnI.
hs-cTnI
The associations of outcomes with hs-cTnI quartiles (Figure 1b) were not as strong as those for BNP. Compared to BNP with a significant trend for all outcomes in the fully adjusted model, the trend for hs-cTnI across quartiles was significant for all-cause death either alone or in combination the cardiovascular composite outcome, or DDKF but not for DDKF and cardiovascular composite alone. The trend was no longer significant for either of the outcomes after adjustment for BNP concentrations.
BNP and hs-cTnI Combined – Quartile Approach
Sixty-three patients (12%) from the random cohort of 510 had both BNP and hs-cTnI in the highest quartile. HRs for adverse outcomes for these patients ranged from 2.46 (1.38–4.36) for cardiovascular outcomes to 3.34 (2.04–5.48) for mortality and DKKF. HRs for all four patient cohorts and for additional adverse outcomes are shown in the Supplemental Table 1.
BNP and hs-cTnI Combined – Diagnostic Cutoff Approach
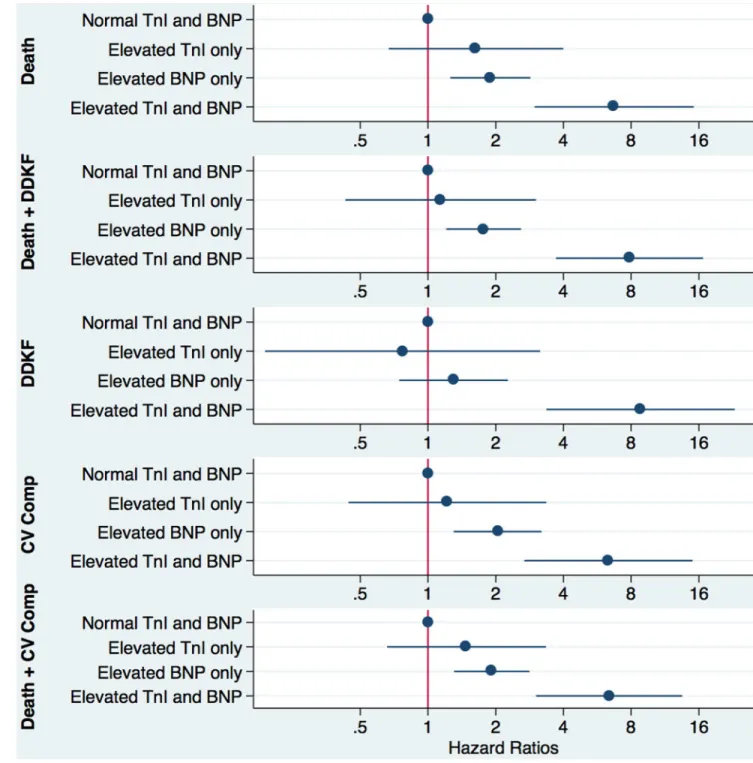
A total of 17 patients (3%) from the random sample had both BNP and hs-cTnI levels which exceeded the clinically accepted thresholds. This number increased to 72 patients (6%) in the enriched population. In the adjusted models, point estimates suggested synergistic effects for all outcomes with significant interactions for DDKF (p=0.013) and the composite of all-cause mortality and DDKF (p=0.03). Participants with both biomarker levels above the clinical cutoffs had an 8.8-fold increased risk of DDKF (HR 8.8; 3.4–23.1) compared to those with both biomarker values in the normal range. The hazard ratios for other adverse outcomes were all statistically significant and ranged from 6.3 to 7.9 (Figure 2 and Supplemental Table 2).
A
uthor Man
uscr
ipt
A
uthor Man
uscr
ipt
A
uthor Man
uscr
ipt
A
uthor Man
uscr
Discussion
Despite the burden of CVD among kidney transplant recipients, few studies have examined the utility of biomarkers in these patients26. Using a case-cohort study design we found a statistically significant association of BNP and cTnI concentrations with clinical outcomes among stable kidney transplant recipients enrolled in a clinical trial of homocysteine lowering. Of note, BNP was more strongly associated with clinical outcomes than cTnI. The combinations of the two markers, either the highest quartiles, or a combination of clinically abnormal levels, were strongly associated with adverse outcomes.
In contrast to cTnI levels seen in patients after acute events27, cTnI concentrations in our population are similar to those observed in patients with stable CAD. Using the same assay as the one used in this study, Omland and coworkers assessed the prognostic value of cTnI in low-risk patients with stable CAD by measuring hs-cTnI levels at baseline in 3,623 patients with stable CAD. Similar to our results, 98.5% of their patients had detectable cTnI concentrations. After adjustment for conventional risk markers, hs-TnI levels in the fourth compared with the 3 lower quartiles were associated with an increased risk of cardiovascular death or HF (HR 1.84; 95% CI 1.30 to 2.61; p < 0.001).28
We and others have reported cTnI elevations in additional disease categories such as diabetes mellitus and CKD.10,29,30 Although these studies used assays different from the hs-cTnI assay used by us, a clear trend towards higher risk of adverse events with higher cTnI levels was observed.
We found that in our population of stable kidney transplant recipients the elevations above the diagnostic cutoff were more common for BNP. While 6% of randomly selected patients had elevated hs-cTnI levels, 24% of patients had BNP concentrations higher than the commonly used single cutoff of 100 pg/ml. This is not surprising since an increase in BNP in both early and advanced stages of CKD has been repeatedly described.31–33
We showed BNP to be a more consistent predictor of outcomes than hs-cTnI. This is most likely due to the fact that volume overload and circulatory stress lead to an earlier release of BNP from stretched cardiac myocytes, while the onset of ischemia and necrosis that elevate hs-cTnI concentrations may follow considerably later. Not surprisingly, the combined usage of BNP with hs-cTnI allowed for the identification of an even higher risk subgroup, with the patients with both biomarkers in the highest quartiles having HRs for adverse outcomes in the 2.46 to 3.34 range depending on the outcome studied.
The most informative result for clinicians is the prognostic information relating to elevation of biomarkers over diagnostic cutoffs. While elevated BNP alone is associated with increased risk for clinical events, simultaneous elevation of both BNP and cTnI increased hazard ratios for adverse outcomes 6.3–8.8 fold depending on the adverse outcomes studied, though the relatively small proportion of patients exceeding both thresholds results in wider confidence intervals.
Additional insight into event-free survival of our patients might be obtained by measuring BNP and cTnI concentrations in serial specimens and by correlating the annual rate of
A
uthor Man
uscr
ipt
A
uthor Man
uscr
ipt
A
uthor Man
uscr
ipt
A
uthor Man
uscr
change with outcomes. However, earlier work did not demonstrate a significant improvement of risk classification over the baseline levels. Roberts et al. followed BNP levels in 48 patients with CKD, in 102 dialysis patients, and in 73 kidney transplant recipients for over five years and concluded that while temporal changes in BNP were predictive of survival in CKD, they did not predict survival in dialysis patients and kidney transplant recipients.34 Similarly, Bodlaj et al. measured NT-proBNP in 76 kidney transplant recipients before, shortly after and 2–3 weeks after transplant and found that NT-proBNP levels measured 2–3 weeks after transplantation were significantly correlated with eGFR at 1 year after transplantation.35 However, these two patient populations differ from our patients who are more remote from the actual kidney transplantation with a median graft vintage of 4.0 years. Both reports also study cohorts considerably smaller than our sample of 1131 patients from a cohort of 3510; however both suggest that baseline levels of BNP may have the highest predictive value and that adding additional time points may be of limited additional benefit.
Continuing monitoring of kidney function has been and will remain the standard of care in kidney transplant recipients. At the same time, improved ability to predict increased risk of adverse outcomes may substantiate more frequent patient visits and monitoring, diet modification, tighter blood pressure control with earlier adjustment of vasodilators and diuretics, as well as adjustment of additional medications and other interventions aimed at improving graft and patient survival. Based on our data we suggest that an elevation in either BNP or cTnI concentration signals a moderately increased risk of adverse outcomes, while simultaneous elevation of both biomarkers is associated with a marked increase in risk and should potentially trigger more aggressive evaluation for and treatment of modifiable cardiovascular risk factors and manifestations.
Limitations and strengths
This is an observational study with a relatively small number of events; however, use of the case-cohort design enriched the population for clinically important outcomes while still allowing estimates of baseline prevalence of abnormal biomarker levels. Furthermore, we used single diagnostic cutoffs for both biomarkers instead of age- and gender-specific reference ranges. Finally, we only studied the baseline specimens and not the additional time points. We do not specifically know whether worsening HF manifestations or subclinical cardiac ischemia potentially identified by abnormal biomarker levels would be modifiable or were on the causal pathway to participant events. However, use of these biomarkers to identify high risk subsets within the kidney transplant population may facilitate future research and targeted interventions to reduce adverse outcomes in this group, which represents the largest cohort of stable kidney transplant recipients studied to date. In addition, our study evaluates the same outcomes as the FAVORIT trial itself.
Conclusions
Baseline BNP and hs-cTnI concentrations were associated with increased risk of adverse outcomes in stable kidney transplant recipients. Baseline BNP concentrations were associated with all-cause death, cardiovascular outcomes, as well as renal outcomes. BNP
A
uthor Man
uscr
ipt
A
uthor Man
uscr
ipt
A
uthor Man
uscr
ipt
A
uthor Man
uscr
was more strongly associated with adverse events in this particular patient population than cTnI, which had stronger association with all-cause mortality. Simultaneous elevation of both BNP and cTnI over the common diagnostic cutoffs was strongly associated with clinical outcomes.
Supplementary Material
Refer to Web version on PubMed Central for supplementary material.
Acknowledgments
Funding/Support: The FAVORIT study was supported by cooperative agreement U01 DK61700-01 from the National Institute of Diabetes and Digestive and Kidney Diseases and additional financial support from the Office of Dietary Supplements, National Institutes of Health, Department of Health and Human Services. Vitamins were provided by Pamlab, Inc. BNP and high sensitivity troponin I reagents were provided by Abbott Diagnostics.
ABBREVIATIONS
ACR albumin-to-creatinine ratio
BMI body mass index
BNP B-type natriuretic peptide
CKD chronic kidney disease
CVD cardiovascular disease
cTnI cardiac troponin I
DDKF dialysis-dependent kidney failure
GFR glomerular filtration rate
HDL high density lipoprotein
HR hazard ratio
hs high sensitivity
LDL low density lipoprotein
NT-proBNP N-terminal pro-B-type natriuretic peptide
REFERENCES
1. Organ Donation and Transplantation Statistics. [Accessed July 31, 2015] Natl Kidney Found. https:// www.kidney.org/news/newsroom/factsheets/Organ-Donation-and-Transplantation-Stats
2. [Accessed July 31, 2015] GKT1 Activity and Practices. WHO. http://www.who.int/ transplantation/gkt/statistics/en.
3. [Accessed July 31, 2015] Kidney Transplant Life Expectancy Statistics & Survival Rate. Nazih Zuhdi Transpl Inst. http://integrisok.com/nazih-zuhdi-transplant-institute-oklahoma-city-ok-kidney-transplant-kidney-transplant-life-expectancy-statistics.
A
uthor Man
uscr
ipt
A
uthor Man
uscr
ipt
A
uthor Man
uscr
ipt
A
uthor Man
uscr
4. Gondos A, Döhler B, Brenner H, Opelz G. Kidney graft survival in Europe and the United States: strikingly different long-term outcomes. Transplant J. 2013; 95:267–274.
5. Rehman SU, Mueller T, Januzzi JL. Characteristics of the novel interleukin family biomarker ST2 in patients with acute heart failure. J Am Coll Cardiol. 2008; 52:1458–1465. [PubMed: 19017513] 6. Mahajan VS, Jarolim P. How to interpret elevated cardiac troponin levels. Circulation. 2011;
124:2350–2354. [PubMed: 22105197]
7. Jarolim P. High sensitivity cardiac troponin assays in the clinical laboratories. Clin Chem Lab Med. 2015; 53:635–652. [PubMed: 25252753]
8. Beatty AL, Ku IA, Christenson RH, DeFilippi CR, Schiller NB, Whooley Ma. High-sensitivity cardiac troponin T levels and secondary events in outpatients with coronary heart disease from the Heart and Soul Study. JAMA Intern Med. 2013; 173:763–769. [PubMed: 23568589]
9. Saunders JT, Nambi V, de Lemos JA, et al. Cardiac troponin T measured by a highly sensitive assay predicts coronary heart disease, heart failure, and mortality in the Atherosclerosis Risk in
Communities Study. Circulation. 2011; 123:1367–1376. [PubMed: 21422391]
10. Yiu K-H, Lau K-K, Zhadverse outcomes C-T, et al. Predictive value of high-sensitivity troponin-I for future adverse cardiovascular outcome in stable patients with type 2 diabetes mellitus. Cardiovasc Diabetol. 2014; 13:63. [PubMed: 24661773]
11. Apple FS, Murakami MM, Pearce LA, Herzog CA. Predictive value of cardiac troponin I and T for subsequent death in end-stage renal disease. Circulation. 2002; 106:2941–2945. [PubMed: 12460876]
12. Pfortmueller CA, Funk G-C, Marti G, et al. Diagnostic performance of high-sensitive troponin T in patients with renal insufficiency. Am J Cardiol. 2013; 112:1968–1972. [PubMed: 24091183] 13. Hassan HC, Howlin K, Jefferys A, et al. High-sensitivity troponin as a predictor of cardiac events
and mortality in the stable dialysis population. Clin Chem. 2014; 60:389–398. [PubMed: 24185551]
14. Bostom AG, Carpenter MA, Kusek JW, et al. Rationale and design of the Folic Acid for Vascular Outcome Reduction In Transplantation (FAVORIT) trial. Am Heart J. 2006; 152:e1–e7. [PubMed: 16923411]
15. Bostom AG, Carpenter MA, Hunsicker L, et al. Baseline characteristics of participants in the Folic Acid for Vascular Outcome Reduction in Transplantation (FAVORIT) Trial. Am J Kidney Dis. 2009; 53:121–128. [PubMed: 19022547]
16. Bostom AG, Carpenter MA, Kusek JW, et al. Homocysteine-lowering and cardiovascular disease outcomes in kidney transplant recipients: primary results from the Folic Acid for Vascular Outcome Reduction in Transplantation trial. Circulation. 2011; 123:1763–1770. [PubMed: 21482964]
17. Levey AS, Stevens LA, Schmid CH, et al. A new equation to estimate glomerular filtration rate. Ann Intern Med. 2009; 150:604–612. [PubMed: 19414839]
18. Krintus M, Kozinski M, Boudry P, et al. European multicenter analytical evaluation of the Abbott ARCHITECT STAT high sensitive troponin I immunoassay. Clin Chem Lab Med. 2014; 52:1657– 1665. [PubMed: 24897400]
19. Collinson PO, Gaze D, Goodacre S. The clinical and diagnostic performance characteristics of the high sensitivity Abbott cardiac troponin I assay. Clin Biochem. 2014; 48:275–281. [PubMed: 25549978]
20. Apple FS, Ler R, Murakami MM. Determination of 19 cardiac troponin I and T assay 99th percentile values from a common presumably healthy population. Clin Chem. 2012; 58:1574– 1581. [PubMed: 22983113]
21. Zeller T, Ojeda F, Brunner FJ, et al. High-sensitivity cardiac troponin I in the general population – defining reference populations for the determination of the 99th percentile in the Gutenberg Health Study. Clin Chem Lab Med. 2015; 53:699–706. [PubMed: 25283141]
22. ARCHITECT STAT High Sensitive Troponin-I. Package insert. Abbott Diagnostics. 2012:1–12. 23. McCullough PA, Nowak RM, McCord J, et al. B-type natriuretic peptide and clinical judgment in
emergency diagnosis of heart failure: analysis from Breathing Not Properly (BNP) multinational study. Circulation. 2002; 106:416–422. [PubMed: 12135939]
A
uthor Man
uscr
ipt
A
uthor Man
uscr
ipt
A
uthor Man
uscr
ipt
A
uthor Man
uscr
24. Barlow WE, Ichikawa L, Rosner D, Izumi S. Analysis of case-cohort designs. J Clin Epidemiol. 1999; 52:1165–1172. [PubMed: 10580779]
25. Barlow WE. Robust variance estimation for the case-cohort design. Biometrics. 1994; 50:1064– 1072. [PubMed: 7786988]
26. Arroyo, D.; Quiroga, B.; Panizo, N., et al. Transplantation Proceedings. Vol. 44. Elsevier Inc; 2012. High-sensitivity troponin T levels in kidney transplant recipients; p. 2545-2547.
27. May EAB, Bonaca MP, Jarolim P, et al. Prognostic performance of a high-sensitivity cardiac troponin i assay in patients with Non-ST-Elevation acute coronary syndrome. Clin Chem. 2014; 60:158–164. [PubMed: 24052087]
28. Omland T, Pfeffer MA, Solomon SD, et al. Prognostic value of cardiac troponin i measured with a highly sensitive assay in patients with stable coronary artery disease. J Am Coll Cardiol. 2013; 61:1240–1249. [PubMed: 23414791]
29. Desai AS, Toto R, Jarolim P, et al. Association between cardiac biomarkers and the development of ESRD in patients with type 2 diabetes mellitus, anemia, and CKD. Am J Kidney Dis. 2011; 58:717–728. [PubMed: 21820220]
30. McMurray JJV, Uno H, Jarolim P, et al. Predictors of fatal and nonfatal cardiovascular events in patients with type 2 diabetes mellitus, chronic kidney disease, and anemia: an analysis of the Trial to Reduce cardiovascular Events with Aranesp (darbepoetin-alfa) Therapy (TREAT). Am Heart J. 2011; 162:748–755. [PubMed: 21982669]
31. Yasuda K, Kimura T, Sasaki K, et al. Plasma B-type natriuretic peptide level predicts kidney prognosis in patients with predialysis chronic kidney disease. Nephrol Dial Transplant. 2012; 27:3885–3891. [PubMed: 23114906]
32. Voroneanu L, Siriopol D, Nistor I, et al. Superior predictive value for NTproBNP compared with high sensitivity cTnT in dialysis patients: a pilot prospective observational study. Kidney Blood Press Res. 2014; 39:636–647. [PubMed: 25571877]
33. Spanaus K-S, Kronenberg F, Ritz E, et al. B-type natriuretic peptide concentrations predict the progression of nondiabetic chronic kidney disease: the Mild-to-Moderate Kidney Disease Study. Clin Chem. 2007; 53:1264–1272. [PubMed: 17478561]
34. Roberts, Ma; Hare, DL.; Sikaris, K.; Ierino, FL. Temporal trajectory of B-Type Natriuretic Peptide in patients with CKD stages 3 and 4, dialysis, and kidney transplant. Clin J Am Soc Nephrol. 2014; 9:1024–1032. [PubMed: 24721887]
35. Bodlaj G, Hubmann R, Saleh K, et al. Serum levels of N-terminal pro-B-type natriuretic peptide are associated with allograft function in recipients of renal transplants. Wien Klin Wochenschr. 2009; 121:631–637. [PubMed: 19921130]
A
uthor Man
uscr
ipt
A
uthor Man
uscr
ipt
A
uthor Man
uscr
ipt
A
uthor Man
uscr
Figure 1. Distribution of clinical outcomes in the 3530 patients with complete data sets
Venn diagram showing the distribution of adverse outcomes in 737 patients who experience at least one adverse outcome. Some patients experienced more than one clinical outcome.
A
uthor Man
uscr
ipt
A
uthor Man
uscr
ipt
A
uthor Man
uscr
ipt
A
uthor Man
uscr
Figure 2. Quartiles of BNP and cTnI and adverse outcomes
BNP and cTnI concentrations were stratified by quartiles and hazard ratios for individual adverse outcomes were calculated before (circles) and after (squares) adding the other biomarker to the model.
A
uthor Man
uscr
ipt
A
uthor Man
uscr
ipt
A
uthor Man
uscr
ipt
A
uthor Man
uscr
Figure 3. Adjusted hazard ratios for combinations of normal and elevated BNP and cTnI
Patients were stratified by BNP and hs-cTnI values below and above the clinical cutoff, i.e. 100 pg/mL for BNP and 26.2 ng/L for hs-cTnI. Hazard ratios and their 95% confidence intervals for adverse outcomes are shown.
A
uthor Man
uscr
ipt
A
uthor Man
uscr
ipt
A
uthor Man
uscr
ipt
A
uthor Man
uscr
A
uthor Man
uscr
ipt
A
uthor Man
uscr
ipt
A
uthor Man
uscr
ipt
A
uthor Man
uscr
ipt
Table 1
Case-cohort design–number of subjects and events available for each clinical outcome
Clinical Outcome Subjects Outcomes
All-cause mortality 862 405
All-cause mortality and DDKF 1046 634
DDKF 766 293
CV outcomes (CV death, MI, RSD, stroke) 792 319
Mortality and CV outcomes 963 529
A
uthor Man
uscr
ipt
A
uthor Man
uscr
ipt
A
uthor Man
uscr
ipt
A
uthor Man
uscr
ipt
T ab le 2 Patient characteristics by quartiles of baseline hs-cTnI (sho
wn for patients from the random sample)
TnI Quartiles (pg/mL)
Characteristics Ov erall (N=510) 1st Quartile 0.05–3.3 pg/mL (N=132)
2nd Quartile 3.3–5.6 pg/mL
(N=128) 3rd Quartile 5.6–10.5 pg/mL (N=123) 4th Quartile 10.5–354.6 pg/mL (N=127) p-v alue Age (yr)
51.6 ± 9.2
47.3 ± 8.6
51.9 ± 8.4
52.8 ± 9.0
54.5 ± 9.3
<0.001 W omen 195(38%) 61(46%) 48(38%) 46(37%) 40(31%) 0.11 Race 0.11 White 388(76%) 107(81%) 100(78%) 95(77%) 86(68%) Black 89(17%) 16(12%) 24(19%) 19(15%) 30(24%) Other 33(6%) 9(7%) 4(3%) 9(7%) 11(9%) T reatment gr oup 0.97 High f olate 254(50%) 64(48%) 63(49%) 62(50%) 65(51%) No f olate 256(50%) 68(52%) 65(51%) 61(50%) 62(49%) Location 0.44 United States 351(69%) 95(72%) 83(65%) 85(69%) 88(69%) Canada 68(13%) 16(12%) 15(12%) 21(17%) 16(13%) Brazil 91(18%) 21(16%) 30(23%) 17(14%) 23(18%)
Graft vintage (yr), median (25
th, 75 th)
4.0 (1.7, 7.3)
3.6 (2.0, 7.7)
3.8 (1.6, 7.1)
4.1 (1.8, 7.8)
3.8 (1.4, 6.9)
0.75
Li
ving donor kidney
213(42%) 74(56%) 44(34%) 45(37%) 50(40%) 0.002
History of cardio
v ascular disease 97(19%) 14(11%) 16(13%) 24(20%) 43(34%) <0.001
History of diabetes mellitus
188(37%) 38(29%) 36(28%) 49(40%) 65(51%) <0.001 Smoking 0.33 Ne v er 256(50%) 76(58%) 62(48%) 58(48%) 60(48%) Curr ent 58(11%) 14(11%) 19(15%) 10(8%) 15(12%) F ormer 193(38%) 42(32%) 47(37%) 53(44%) 51(40%)
Systolic blood pr
essur
e (mm Hg)
135.6 ± 20.3
127.3 ± 17.4
135.8 ± 18.3
137.8 ± 17.6
142.2 ± 24.2
<0.001
Diastolic blood pr
essur
e (mm Hg)
79.1 ± 12.5
77.5 ± 11.7
80.5 ± 12.5
78.4 ± 11.6
80.0 ± 14.2
0.18
Body mass index (kg/m
2)
28.9 ± 5.9
28.0 ± 6.4
29.4 ± 5.6
28.9 ± 5.9
29.5 ± 5.5
0.16
HDL cholester
ol (mg/dL)
46.9 ± 14.4
47.9 ± 13.4
46.2 ± 11.7
48.9 ± 18.2
44.6 ± 13.5
0.09
LDL cholester
ol (mg/dL)
103.7 ± 33.3
104.3 ± 32.8
105.1 ± 32.9
104.8 ± 33.6
100.5 ± 34.1
A
uthor Man
uscr
ipt
A
uthor Man
uscr
ipt
A
uthor Man
uscr
ipt
A
uthor Man
uscr
ipt
TnI Quartiles (pg/mL)
Characteristics
Ov
erall (N=510)
1st Quartile
0.05–3.3 pg/mL
(N=132)
2nd Quartile 3.3–5.6 pg/mL
(N=128)
3rd Quartile
5.6–10.5 pg/mL
(N=123)
4th Quartile
10.5–354.6 pg/mL
(N=127)
p-v
alue
T
riglycerides (mg/dL)
199.4 ± 140.0
178.2 ± 113.5
198.8 ± 127.2
212.8 ± 146.8
208.9 ± 166.9
0.19
Serum cr
eatinine (mg/dL)
1.8 ± 0.6
1.6 ± 0.6
1.8 ± 0.6
1.8 ± 0.7
2.0 ± 0.7
<0.001
eGFR (mL/min/1.73m
2)*
45.9 ± 18.2
51.7 ± 19.1
45.6 ± 16.4
43.9 ± 17.7
42.1 ± 18.4
<0.001
Alb
umin Cr
eatinine Ratio (mcg/mg), median (25
th, 75 th)
24.7 (9.5, 110.7)
16.5 (6.4, 36.6)
18.7 (8.0, 98.4)
26.0 (10.5, 106.4)
57.4 (15.7, 277.9)
<0.001
* Based on CKD-EPI eGFR formula Note: V
alues e
xpressed as N(%), mean ± standard de
viation or median (25th, 75th percentiles)
P-v
alue comparisons across BNP quartiles are based on chi-square test for cate
gorical v
ariables, Kruskal-W
allis test, and analysis of v
ariance for means of continuous v
A
uthor Man
uscr
ipt
A
uthor Man
uscr
ipt
A
uthor Man
uscr
ipt
A
uthor Man
uscr
ipt
T ab le 3 Patient characteristics by quartiles of baseline BNP (sho
wn for patients from the random sample)
BNP Quartiles (pg/mL)
Characteristics
Ov
erall
(N=510)
1st Quartile 9–15.3 pg/mL (N=128)
2nd Quartile 15.3–39.4 pg/mL (N=127) 3rd Quartile 39.4–93.6 pg/mL (N=128) 4th Quartile 93.6–4930.9 pg/mL (N=128) p-v alue Age (yr)
51.6 ± 9.2
47.0 ± 7.6
51.2 ± 9.5
52.0 ± 8.2
56.0 ± 9.3
<0.001 W omen 195(38%) 45(35%) 44(35%) 51(40%) 55(43%) 0.44 Race 0.74 White 388(76%) 92(72%) 96(76%) 97(76%) 103(81%) Black 89(17%) 27(21%) 23(18%) 23(18%) 16(13%) Other 33(6%) 9(7%) 8(6%) 8(6%) 8(6%) T reatment gr oup 0.46
High dose f
olate 254(50%) 56(44%) 65(51%) 66(52%) 67(53%) No f olate 256(50%) 72(56%) 62(49%) 62(48%) 60(47%) Location 0.003 United States 351(69%) 72(56%) 86(68%) 94(73%) 99(78%) Canada 68(13%) 19(15%) 21(17%) 17(13%) 11(9%) Brazil 91(18%) 37(29%) 20(16%) 17(13%) 17(13%)
Graft vintage (yr), median (25
th, 75 th)
4.0 (1.7, 7.3)
4.0 (1.8, 6.7)
3.8 (1.7, 6.7)
4.0 (1.7, 7.1)
4.1 (1.8, 8.4)
0.86
Li
ving donor kidney
213(42%) 65(51%) 61(49%) 50(39%) 37(29%) 0.002
History of cardio
v ascular disease 97(19%) 8(6%) 21(17%) 24(19%) 44(35%) <0.001
History of diabetes mellitus
188(37%) 33(26%) 48(38%) 50(39%) 57(45%) 0.01 Smoking 0.55 Ne v er 256(50%) 73(57%) 59(47%) 61(48%) 63(50%) Curr ent 58(11%) 15(12%) 17(13%) 15(12%) 11(9%) F ormer 193(38%) 40(31%) 50(40%) 52(41%) 51(41%)
Systolic blood pr
essur
e (mm Hg)
135.6 ± 20.3
132.4 ± 17.0
133.6 ± 20.8
135.4 ± 20.1
141.2 ± 21.9
0.003
Diastolic blood pr
essur
e (mm Hg)
79.1 ± 12.5
82.0 ± 12.6
78.9 ± 13.5
77.7 ± 11.8
77.8 ± 11.8
0.02
Body mass index (kg/m
2)
28.9 ± 5.9
29.4 ± 6.0
28.8 ± 6.4
29.2 ± 5.7
28.4 ± 5.3
0.56
HDL cholester
ol (mg/dL)
46.9 ± 14.4
46.5 ± 12.5
46.8 ± 13.1
46.4 ± 12.5
47.9 ± 18.6
0.84
LDL cholester
ol (mg/dL)
103.7 ± 33.3
111.7 ± 34.6
98.8 ± 29.6
106.0 ± 33.4
98.2 ± 33.8
A
uthor Man
uscr
ipt
A
uthor Man
uscr
ipt
A
uthor Man
uscr
ipt
A
uthor Man
uscr
ipt
BNP Quartiles (pg/mL)
Characteristics
Ov
erall
(N=510)
1st Quartile 9–15.3 pg/mL (N=128)
2nd Quartile
15.3–39.4 pg/mL
(N=127)
3rd Quartile
39.4–93.6 pg/mL
(N=128)
4th Quartile
93.6–4930.9 pg/mL
(N=128)
p-v
alue
T
riglycerides (mg/dL)
199.4 ± 140.0
220.9 ± 173.8
174.2 ± 114.4
209.5 ± 125.7
192.5 ± 135.9
0.04
Serum cr
eatinine (mg/dL)
1.8 ± 0.6
1.7 ± 0.5
1.7 ± 0.6
1.8 ± 0.7
1.9 ± 0.7
0.07
eGFR (mL/min/1.73m
2)*
45.9 ± 18.2
49.6 ± 18.9
47.5 ± 17.1
46.0 ± 19.5
40.6 ± 16.2
<0.001
Alb
umin Cr
eatinine Ratio (mcg/mg), median (25
th, 75 th)
24.7 (9.5, 110.7)
18.5 (7.5, 85.5)
18.8 (7.2, 84.2)
21.6 (8.3, 58.7)
57.4 (14.8, 229.0)
<0.001
* Based on CKD-EPI eGFR formula Note: V
alues e
xpressed as N(%), mean ± standard de
viation or median (25
th, 75 thpercentiles)
P-v
alue comparisons across BNP quartiles are based on chi-square test for cate
gorical v
ariables, Kruskal-W
allis test, and analysis of v
ariance for means of continuous v