THE INFLUENCE OF ISOMETRIC STRENGTH SPECIFICTY ON FUNCTIONAL TASK ABILITIES
Pinyu Chen
A thesis submitted to the faculty of the University of North Carolina at Chapel Hill in partial fulfillment of the requirements for graduation with honors in the Department of Exercise and
Sport Science.
Chapel Hill 2020
Approved by: Eric D. Ryan
© 2020 Pinyu Chen
ABSTRACT
Pinyu Chen: The Influence of Isometric Strength Specificity on Functional Task Abilities (Under the direction of Eric Ryan)
Single-joint measurements of leg extension strength may not reflect the biomechanical and neuromuscular specificity of functional tasks. The purpose was to determine if multi-joint, leg press assessments of muscle strength is more strongly associated with functional [i.e., stair climb assessment (SC), countermovement vertical jump test (CMJ), and star excursion balance tests (SEBT)] task performance than single-joint measures of leg extension strength. Forty-one participants performed isometric leg extension and leg press strength testing and completed the SC, CMJ, and SEBT. Pearson’s product moment correlation coefficients showed significant relationships (P < 0.05) between absolute and normalized strength with SC time (r = 0.519 – -0.599) and CMJ height (r = 0.526 – 0.735), average power (r = 0.383 – 0.817), and average velocity (r = 0.428 – 0.451), but not SEBT distanced reached. Steiger Z analyses demonstrated no significant difference (P 0.141) between the relationships of the measures of strength and each
ACKNOWLEDGEMENTS
TABLE OF CONTENTS
LIST OF TABLES ... vii
LIST OF ABBREVIATIONS ... viii
CHAPTER I ... 1
Impact ... 3
Research Question ... 3
Research Hypothesis ... 3
CHAPTER II ... 4
The role of strength on health and performance ... 4
Functional task performances ... 8
Factors that influence muscle strength ... 10
Multi- vs single-joint strength assessments ... 14
Literature Synopsis ... 18
CHAPTER III ... 19
Participants... 19
Experimental Design... 19
Single-joint Isometric Strength Testing ... 20
Multi-joint Isometric Strength Testing ... 21
Weighted Stair Climb Assessment ... 22
Countermovement Vertical Jump Test ... 23
Star Excursion Balance Test ... 23
Statistical Analysis ... 24
CHAPTER IV ... 25
Partictipant Characteristics ... 25
Weighted Stair Climb Assessment ... 25
Countermovement Vertical Jump Test ... 26
Star Excursion Balance Test ... 26
CHAPTER V ... 28
LIST OF TABLES
Table 1. Participant Demographics ... 32
Table 2. Mean and Standard Deviation of Strength
Variables and Functional Task Outcomes ...32
Table 3. Relationship of Functional Task Outcomes and
Measures of Strength ...32
Table 4. Relationship of Functional Task Outcomes and
LIST OF ABBREVIATIONS
MVC Maximum Voluntary Contraction
RTD50 Rate of Torque Development at 0-50 ms of Torque-Time Curve RTD200 Rate of Torque Development at 0-200 ms of Torque-Time Curve
PT Peak Torque
PF Peak Force
CHAPTER I
INTRODUCTION
Muscle strength is the maximum amount of force or torque that a muscle can produce during a single contraction.1 Muscle strength is one of the most commonly examined measures of function, as previous authors have suggested it is associated with mortality, the ability to perform activities of daily living, and athletic performance.2–7 For example, declines in quadriceps and grip strength in both men and women are strongly associated with mortality, with women exhibiting a slightly higher association.5,6 In a group of healthy men between 45-68 years, grip strength can also predict the development of functional limitations and disability 25 years later.3 Furthermore, previous studies have indicated that muscle strength is significantly associated with the ability to perform activities of daily living (e.g. walking, ascending stairs, or avoiding falls).2– 4,8,9 Previous authors have demonstrated that weaker older adults have an increased risk of having functional task deficiencies with activities, such as walking 0.8 km or walking up 10 steps, and a dependency on others.3 Lastly, muscle strength is considered to be an important predictor of performance in various athletic settings, particularly for sports that rely on high levels of velocity, speed, and power.7,10
evaluate the influence of exercise training interventions19,20, detraining21, dietary habits22, and clinical conditions23,24 on muscle strength.
While single-joint assessments of muscle strength allow for sensitive and accurate measurements of muscle function, they may not necessarily reflect the biomechanical and neuromuscular specificity of activities of daily living and functional tasks.25 Recently, previous studies have suggested that strength measured during multi-joint movements, such as isometric squats, are associated with activities of daily living.26–28 Specifically, various measures of explosive strength (i.e., rate of torque development at 0-50 ms of force-time curve (RTD50) and rate of torque development at 0-200 ms of force-time curve (RTD200)) measured during a multi-joint isometric squat at 90 of knee flexion more strongly predicted performance in the 10m and
400m walk than the single-joint strength test.28 Another study reported correlations between the explosive force produced during an isometric squat and performance during a 5m sprint, 20m sprint, and a countermovement jump.26 In addition, peak torque measured through the isometric squat was moderately correlated with 10m and 400m walk performance.28
Impact
Traditional measurements of muscle strength (e.g. single joint leg extension) may not reflect the biomechanical and neuromuscular specificity seen in many functional tasks. Multi-joint strength assessments may overcome these limitations and be more strongly associated with activities of daily living and measures of performance. These findings will be critical to future researchers when identifying strength measurements that are most closely related to more functionally relevant tasks.
Research Question
Are multi-joint isometric leg press measures of strength more strongly associated with functional measures of performance than a traditional single-joint assessment of isometric leg-extension muscle strength?
Research Hypothesis
It is hypothesized that the multi-joint strength assessment will be more strongly associated with functional measures of performance than the single-joint strength assessment.
a. The multi-joint strength assessment will be more strongly associated with countermovement vertical jump performance than the single-joint strength assessment. b. The multi-joint strength assessment will be more strongly associated with weighted stair
climb performance than the single-joint strength assessment.
CHAPTER II
LITERATURE REVIEW
The role of strength on health and performance
García-Hermoso, Cavero-Redondo, Ramírez-Vélez, Ruiz, Ortega, Lee, and Martínez-Vizcaíno (Archives of Physical Medicine and Rehabilitation 2018)
Through the use of a systematic review and meta-analysis, the purposes of this study were to determine the role of the handgrip strength test and other measures of muscular strength (e.g. leg extension strength) on all-cause mortality risk and determine the sex-specific impacts of strength on all-cause mortality. Key words such as ‘muscular’ or ‘strength’ and ‘mortality’ or ‘survival rate’ or ‘cause of death’ were systematically searched in MEDLINE, EMBASE, and
for women. In summary, when examined with the handgrip strength test, adults with higher muscular strength had 31% lower risk of all-cause mortality when compared to adults with lower muscular strength, therefore, muscle strength was considered to be a risk factor for all-cause mortality in adults. High muscle strength in women appeared to have a stronger influence on mortality when compared to men. While both lower and upper limb muscle strength were associated with mortality, declines of strength in the lower limb had a stronger relationship with mortality.29
Leong, Teo, Rangarajan, Lopez-Jaramillo, Avezum, Orlandini, Seron, Ahmed, Rosengren, Kelishadi, Rahman, Swaminathan, Iqbal, Gupta, Lear, Oguz, Yusoff, Zatonska, Chifamba, Igumbor, Mohan, Anjana, Gu, Li, and Yusuf (Lancet 2015)
and injuries from falls. The hazard ratio per standard deviation reduction in grip strength was 1.37 for mortality and 1.45 for cardiovascular-related mortality. In summary, while grip strength served as a predictor for both cardiovascular mortality as well as non-cardiovascular mortality, it had a stronger association with cardiovascular mortality. Among those that developed cardiovascular or non-cardiovascular diseases, individuals that possessed low grip strength were at a higher risk of morbidity from the disease.30
Avlund, Schroll, Davidsen, Løvborg, and Rantanen (Scandinavian Journal of Medicine & Science in Sports 1994)
respectively. However, a lack of trunk extension strength indicated an increased dependence in activities of daily living and mobility function as well as increased tiredness in mobility function. In summary, hand grip, knee extension, body extension, and arm flexion strength all influenced functional ability.4
Suchomel, Nimphius, and Stone (Sports Medicine 2016)
Functional task performances
Hertel, Braham, Hale, and Olmsted-Kramer (Journal of Orthopaedic and Sports Physical Therapy 2006)
The purposes of this study were to reduce the number of star excursion balance test reach directions needed to detect balance deficits and to determine the relationships between the performance in each of the eight directions of the balance test. A total of 48 subjects with chronic ankle stability and 39 subjects without chronic ankle stability participated in the study. Subjects from both groups performed three trials in all eight directions (anterolateral, anterior, anteromedial, medial, posteromedial, posterior, posterolateral, and lateral) of the star-excursion balance test, with the distance reached measured in centimeters. The distanced reached was normalized to each subject’s leg length and the mean of all three trials was used for statistical analysis. Preliminary
findings of the study indicated that the posteromedial reach direction was the strongest predictor of star-excursion balance test performance in individuals with and without chronic ankle instability and there was redundancy between the performance in each of the eight reach directions. In summary, the anteromedial, medial, and posteromedial reach directions were sensitive to differences in functional abilities in individuals with and without chronic ankle stability, which suggest that not all eight reach directions are needed to assess functional deficits.31
Kleinberg, Ryan, Tweedell, Barnette, and Wagoner (Journal of Strength and Conditioning Research 2016)
Forty-six male career (full-time) firefighters between the ages of 24 to 50 years volunteered to be in this study. Ultrasound images were taken at 50% of the length of the right limb (when measured from greater trochanter to femoral condyle). The time firefighters took to ascend and descend a set of stairs (26 steps) four times while wearing a 22.73 kg vest (to simulate the weight of firefighter protective equipment) was recorded. A partial correlation analysis performed to account for age and Body Mass Index revealed that muscle cross-sectional area (r = -0. 324) and echo intensity (r = 0.413) were significantly associated with stair-climb time. In addition, a stepwise regression analysis revealed that muscle cross sectional area and echo intensity significantly predicted stair-climb performance (r= 0.560). The significant negative relationship between echo intensity and stair climb performance might be because of an increase in fat or fibrous tissue in the muscle. In summary, both muscle size and quality were significantly associated with stair-climb performance and accounted for 31% of the variance in stair-climb performance.32
Fatouros, Jamurtas, Leontsini, Taxildaris, Aggelousis, Kostopoulos, and Buckenmeyer (Journal of Strength and Conditioning Research 2000)
no significant difference found within the control group. For example, in the plyometric training group, pre-training vertical jump height was 52.9 2.4 cm (mean SD) and 58.9 2.3 cm
post-training. In the weight training group, pre-training vertical jump height was 58.1 1.4 cm and
63.5 1.8 cm post-training. In the plyometric and weight training group, pre-training vertical jump height was 58.8 3.0 cm and 67.4 2.8 cm post-training. In the control group, vertical jump
height was initially 54.5 1.5 cm and 54.9 1.9 cm when post-tested. In summary, the primary
results indicated plyometric training was effective in improving various aspects of vertical jump performance, but it was more effective when plyometric training was combined with weight training to focus on developing strength as well as power output.33
Factors that influence muscle strength
Aagaard, Dyhre-Poulsen, Simonsen, Andersen, Leffers, Wagner, and Halkjaer-Kristensen (Journal of Physiology 2001)
of the muscle length. Maximal voluntary contractions of the knee extensors were measured through a dynamometer and the highest recorded value was used in the analyses. From pre- to post-training, there was an increase in vastus lateralis muscle fiber pennation angle (35.5 8.3 %
change), increase in physiological muscle fiber cross-sectional area (15.5 5.1% change), increase
in anatomical cross-sectional area (10.2 2.2% ), increase in muscle volume (10.3 2.2% ), and
increase in maximal muscle strength (16.2 3.0% ). The disproportionate changes in anatomical
cross-sectional area and physiological muscle fiber cross-sectional area may be explained by the increase in muscle fiber pennation angle. Despite the fact that the two measurements did not have any associations with each other after, the changes in values from resistance training were correlated. In summary, after 14 weeks of resistance training, the increase in pennation angle of the quadriceps muscle led to a higher increase in physiological muscle cross-sectional area and maximal strength then anatomical cross-sectional area and volume.34
Maganaris, Baltzopoulos, Ball, and Sargeant (Journal of Applied Physiology 2001)
and B for all of the measured parameters except muscle volume, which consequently led to a difference in the calculated values. When compared to data set A, data set B overestimated both Achilles and tibialis anterior tendon forces by 39% and 189%, respectively. Soleus and tibialis anterior muscle forces were respectively 13% and 175% larger in data set B than data set A. Soleus physiological cross-sectional area was overestimated by 63% and underestimated by 36% for the tibialis anterior when data set B was used. The specific tension for the soleus was underestimated by 31% and overestimated by 325% for the tibialis anterior when calculated by data set B and compared to data set A. There was no significant difference found between the specific tension of the soleus and tibialis anterior when calculated through data set A, however, there was a six-fold difference between the two muscles when calculated through data set B. In summary, muscle strength can be accurately estimated from measurements through in vivo conditions.35
Stebbings, Morse, Williams, and Day (Muscle Nerve 2014)
physiological cross-sectional area and stature (r2 = 0.674). There was no significant difference in the relationship between vastus lateralis anatomical cross-sectional area and isometric knee extension torque and the relationship between vastus lateralis physiological cross-sectional area and vastus lateralis fascicle force. In summary, there is inter-individual variability in muscle specific force and isometric maximum voluntary contraction torque; fascicle force and physiological cross-sectional area provide a more stringent measurement of muscle size and strength.36
McPhee, Cameron, Maden-Wilkinson, Piasecki, Yap, Jones, and Degens (Journal of Gerontology – Series A Biological Sciences and Medical Sciences 2018)
population was 28% smaller than the young subjects. In summary, the main reason for the difference in strength between the younger and older subjects was because of the 28% difference in muscle mass between the younger and older subjects.37
Multi- vs single-joint strength assessments
Tillin, Pain, and Folland (Journal of Sports Science 2012)
Nuzzo, McBride, Cormie, and McCaulley (Journal of Strength and Conditioning Research 2008) The purpose of this study was to determine the relationships between countermovement vertical jumps and strength as measured through multi-joint isometric and dynamic strength tests. Twelve Division I-AA male athletes volunteered to participate in this study. The dynamic strength tests included 1 repetition maximum during the squat and power clean. The rate of force development and peak force during an isometric mid-thigh pull and maximal isometric squat were recorded. Variables from the countermovement vertical jump tests were recorded through a force place and linear position transducer. There was a significant correlation between isometric squat peak force, squat 1RM, and power clean 1RM with countermovement vertical jump peak force (r = 0.639, 0.791, and 0.840, respectively). There was no significant correlation between isometric mid-thigh pulls peak and countermovement vertical jump peak force (r= 0.538). Countermovement vertical jump peak power had a significant correlation with isometric squat peak force, isometric mid-thigh pulls peak force, squat 1RM, and power clean 1RM (r = 0.706, 0.750, 0.836, and 0.856, respectively). However, all the measures of absolute strength had no significant correlations with countermovement vertical jump peak velocity and height. In summary, relative measures of strength measured through multi-joint strength tests were better correlated with countermovement jump performance than absolute measures of strength.27
vertical jumps, and the jump height was recorded. They were also instructed to walk as fast as they can to complete a 10 m and 400 m walk, and the time taken to complete the task was recorded. Maximal voluntary contractions of the leg flexors and extensors were performed on the single-joint dynamometer at 90, 60, and 20 of knee flexion. Maximal voluntary contractions while
squatting was performed on an isokinetic squat machine. Analysis of variance revealed that the single-joint strength test had significantly lower peak torque for the 20 angle when compared to
the 60 and 90 angles (154.1 42.9, 198.7 58.3, 188.8 62.2 Nm for the 20, 60, and 90
angles, respectively). For the multi-joint strength test, the peak torque for 20 and 60 of knee
flexion was greater than the 90 angle (627.4 245.8, 558.3 202.3, 446.7 158.0 Nm for the
20, 60, and 90 angles, respectively). Pearson’s product-moment correlation coefficients
analysis was done between the strength variables and jump and walk performance. RTD50 and RTD200 for the multi-joint strength test at 90 best predicted 10 m walk time, and the
countermovement jump height best predicted 400 m walk time (r = -0.73 and -0.81, respectively). In summary, there was a strong, significant correlation for maximal strength as measured through 20, 60, and 90 joint angles on the multi- and single-joint strength tests and the time taken to
complete both the 10 m and 400 m walk.28
product-moment correlation coefficients were used to analyze the relationships between sprint performance and the various strength variables. The only statistically significant relationship was the concentric force produced at 150 of leg flexion at 30 ms of the squat and sprint performance
(r = -0.616). In summary, there is a poor relationship between force-time variables during isometric strength tests with sprint performance, however, concentric strength tests were determined to be more correlated with sprint performance.38
Brownstein, Ansdell, Škarabot, Frazer, Kidgell, Howatson, Goodall, and Thomas (Experimental
Physiology 2018)
The purpose of this study was to determine the relationship between the corticospinal and intracortical activity of the leg extension and isometric squats. Eleven young, male adults volunteered to participate in this study. Participants performed maximal voluntary contractions during isometric knee extensions and isometric squats. Transcranial magnetic stimulations were applied to the motor cortex, and percutaneous stimulations were applied to the right femoral nerve. Short-interval cortical inhibition in the vastus lateralis (70 14, 63 12% in the vastus lateralis
for isometric squat and knee extension, respectively) and rectus femoris (58 19, 71 19% in the
values, ranging from poor to poor-to-good. In summary, the intracortical and corticospinal activity during isometric squats and knee extension had a poor level of agreement.12
Literature Synopsis
CHAPTER III
METHODOLOGY
Participants
Forty-one healthy men and women (mean ± SD: age = 24 ± 5 years, BMI = 23.1 ± 3.1 kg/m2) that participate in less than one hour of consistent aerobic exercise per week and has not participated in lower-body resistance training within the past three months volunteered for this investigation. All demographic data are represented in Table 1. Participants were free of neuromuscular, metabolic, renal, and/or cardiovascular disorders, recent injuries to the lower extremities (≤ 6 months), and have not had any lower extremity surgeries. Female participants
were required to be eumenorrheic for at least 6 months.
Experimental Design
Protocol: Each participant visited the Neuromuscular Assessment Laboratory on three
contractions (MVCs), participants were asked what leg they would use to kick a soccer ball.47 Prior to data collection, the female participants were asked to undergo a pregnancy test. For all strength assessments and functional tasks, the participants received thorough instructions prior to undergoing the testing. For visit one and visit two, they were asked to abide by the following pre-testing guidelines: arrive eight hours fasted, abstain from alcohol, tobacco, and exercise within 24 hours of testing, and avoid caffeine consumption within eight hours of testing. They were given a standardized meal (Carnation Breakfast Essentials High Protein Nutritional Drink 8 fl oz, Nestlé Healthcare Nutrition Inc., Florham Park, NJ) upon arrival. During visit two, participants performed the multi-joint isometric muscle strength assessment with the same protocol and leg press settings as visit one, followed by the weighted stair climb assessment. On visit three, participants performed the single-joint isometric muscle strength assessment with the same protocol and chair settings as visit one. The participants then performed the countermovement vertical jump test and star-excursion balance test.
Single-joint Isometric Strength Testing
Leg extension peak torque (Nm) was measured during an isometric MVC while participants were seated in a calibrated isometric dynamometer (HUMAC NORM, Computer Sports Medicine Inc., Stoughton, MA) in accordance with the manufacturer instructions. Their dominant leg was secured to the padded lever arm through Velcro straps and placed approximately 5 cm above the medial and lateral malleolus. The limb was extended to 60 below the horizontal
period.48 Instructions were given to the participants to "push" with their dominant leg as hard and as fast as they can against a lever arm for 3-4 seconds while receiving strong verbal encouragement. If pretension or countermovement was detected, an additional MVC was performed. The highest peak torque (PT) value of the 3 MVCs was used for statistical analysis.
Multi-joint Isometric Strength Testing
Peak force (N) was collected from a custom-built, isometric, leg press dynamometer. The participants placed the distal end of the metatarsals of the dominant foot (without their shoe) directly over the load cell located in the middle of the force plate. The foot was secured to the plate through the use of Velcro straps, so the participants could fully relax the leg while keeping the foot in place. The nondominant leg remained fully relaxed on the ground with instructions given to not push their foot against the ground during contractions. Participants sat in the leg press so that their hip, knee, and ankle joints were located within the same plane, with the knee joint set to 60 of knee flexion. The hip joint (90) was adjusted accordingly so that the participant was
sitting upright at a position optimized for pushing against the force plate, while the ankle joint remained at 0 of plantarflexion and 0 of dorsiflexion. Seatbelts were secured across the waist to
Signal Processing
Force (N) from the multi-joint dynamometer and torque (Nm) from the commercial dynamometer was sampled at 2kHz with a Biopac data acquisition system (MP150WSW, Biopac Systems Inc., Goleta, CA) and stored on a personal computer. Custom-written software (LabVIEW 18, National Instruments, Austin, TX) was used to process all the signals offline. The force and torque signals were corrected for baseline passive tension and filtered using a fourth order, zero phase shift low pass (150 Hz) Butterworth filter.49 Isometric peak force and torque were calculated as the highest 500 ms epoch during the MVC plateau.
Weighted Stair Climb Assessment
Countermovement Vertical Jump Test
Maximum jump height (in), average velocity (m/s), and average power (W) output of each countermovement vertical jump (CMJ) were recorded. A linear position transducer (Tendo Sports Machines, Trencin, Slovak Republic) was used to measure average velocity and average power along with a contact mat (Just Jump or Run, Probiotics, Inc., Huntsville, AL, USA) used to assess vertical jump height.50 The linear position transducer was attached to a belt that was tightened across the participant’s waist. They were asked to stand with their feet shoulder width apart in the
center of the mat, place hands on their hips, and squat down prior to jumping up. Instructions were given to maximally jump as high as possible in the vertical direction. Following 3 sub-maximal warmup jumps, participants were asked to perform three maximum vertical jumps separated by 1 minute of rest in between each jump. If participants were displaced horizontally or laterally while in midair, an additional jump was performed. The highest recorded value for each variable (i.e., jump height, average velocity, and average power) from the 3 maximum vertical jumps was used for statistical analysis.
Star Excursion Balance Test
reaching in the anterior direction, followed by three trials on the left foot reaching in the anterior direction. This procedure was repeated for the posteromedial and posterolateral reach directions. Testing began on one side and proceeded to the other leg when all trials were completed. A trial was successful when the participant was able to maintain balance and control while standing on one leg for the entire duration of a trial and keeping the heel planted on the ground. Right and left leg lengths were measured from the anterior superior iliac spine down to the medial malleolus to normalize reach distance to leg length.52 The composite distance reached for each trial with each leg was calculated, and the highest composite value for each leg was then normalized to leg length for statistical analysis.53
Statistical Analysis
All descriptive statistics were presented as means standard deviation (SD). The Pearson’s
product-moment correlation coefficient was used to evaluate the relationships between isometric muscle strength (single-joint and multi-joint) and each outcome of each functional measure of performance (i.e., weighted stair-climb, countermovement vertical jump, and star excursion balance test). The Pearson’s product-moment correlation coefficient was also used to evaluate the relationships between both raw and normalized isometric muscle strength and each outcome of each functional measure of performance. The Steiger Z calculation and Cohen’s q were used to determine if there was a significant difference and the difference between the relationships for each respective functional task.54,55 The alpha level was set at P 0.05 for statistical analysis. All
CHAPTER IV
RESULTS
Participant Characteristics
Forty-six participants enrolled in this study, however, two participants dropped prior to the familiarization session and three dropped after completing the familiarization session. Participants withdrew because of time conflicts or the inability to comply with the testing guidelines. Forty-one healthy men and women (58.5% females; mean ± SD: age = 24 ± 5 years, stature = 170.6 ± 10.6 cm, mass = 67.7 ± 13.6 kg, BMI = 23.1 ± 3.1 kg/m2) completed all the testing. Demographic data and strength and performance variables are presented in Tables 1 and 2, respectively.
Weighted Stair Climb Assessment
Countermovement Vertical Jump Test
A significant relationship (P < 0.01) existed between the single- (r = 0.735) and multi- (r = 0.551) joint measures of strength with jump height. When strength was normalized, there was a significant relationship (P < 0.01) for both the single- (r = 0.727) and multi- (r = 0.526) joint measures of strength. For both raw and normalized strength, no significant difference (Steiger Z 1.472, P 0.141; Cohen’s q 0.338) existed (Tables 3 and 4).
A significant relationship (P < 0.01) existed between average power with both the single- (r = 0.756) and multi- (r = 0.817) joint measures of strength. When strength was normalized, a significant relationship existed for both the single- (r = 0.383, P = 0.013) and multi- (r = 0.516, P < 0.01) joint measures of strength. For both raw and normalized strength, there was no significant difference (Steiger Z 0.729, P 0.466; Cohen’s q 0.167) overall (Tables 3 and 4).
There was a significant relationship (P < 0.01) between both the single- (r = 0.541) and multi- (r = 0.503) joint measures of strength with average velocity. When strength was normalized, there was a significant relationship (P < 0.01) for both the single- (r = 0.446) and multi- (r = 0.428) joint measures of strength. For both raw and normalized strength, a significant difference (Steiger Z 0.228, P 0.820; Cohen’s q 0.052) did not exist (Tables 3 and 4).
Star Excursion Balance Test
normalized strength, there was no significant difference (Steiger Z 0.843, P 0.399; Cohen’s q
0.196) (Tables 3 and 4).
No significant relationships existed between both the single- (r = 0.139, P = 0.391) and multi- (r = -0.018, P = 0.912) joint measures of strength with the distance reached by the right leg. When strength was normalized, there were no significant relationships for the single- (r = 0.265, P = 0.098) and multi- (r = 0.054, P = 0.739) joint measures of strength. For both raw and normalized strength, a significant difference (Steiger Z 0.935, P 0.350; Cohen’s q 0.217) did
CHAPTER V
DISCUSSION
The primary findings of this study suggest that performance in the weighted SC assessment (i.e., time) and countermovement vertical jump test (i.e., height, average power, and average velocity) were moderately correlated to the single- and multi-joint measures of strength, while performance in the star excursion balance test (i.e., normalized composite distance reached) for both legs were not associated with both of the strength assessments. It was hypothesized that the multi-joint strength assessment would be more strongly associated with all the functional task outcomes, however, the results indicated that there was no significant difference in the relationships between each respective functional task and the strength assessments.
The methods used by Laffan et al. closely matched the ones in the current study, with the exception that the study was conducted in career firefighters.61 These contrasting findings may be because of how strength was expressed (absolute vs relative) and/or the training status of the participants. For example, previous literature has indicated the importance of accounting for body mass when studying the relationship of strength to movements that require propelling body mass like in the SC.62,63 In addition, it is important to note that the current participants in the current study were untrained with low levels of physical activity, whereas the study by Laffan et al. included participants with a wide range of training backgrounds.61
The results of the current study demonstrated that both absolute and normalized leg extension PT and leg press PF were significantly related to vertical jump height (r = 0.526 – 0.735), average power (r = 0.383 – 0.817), and average velocity (r = 0.428 – 0.541). In general, possessing greater lower body strength increases the power to propel the body mass during jumping, which in turn influences CMJ performance outcomes.64 These findings for jump height are similar but a little higher than what was reported in previous studies (r = 0.42 – 0.57) in male postgraduate students, junior basketball players, and professional soccer players at various knee joint angles (90 – 120).25,65,66 Marcora et al. specifically examined the effects of leg extension PF measured
at different knee angles on its relationship to countermovement jump height and concluded that the non-significant correlation value at 90 but not 120 was the result of the lack of similarity to
performance may be more related to relative measures of strength that account for body mass than absolute strength.27,62,63,67,68 However, other literature also suggests that body mass has no confounding impact on jump performance variables, such as velocity and height, while having a minor influence on power output.69,70 The discrepancies across these findings may be because of the differing biomechanical specificity in different measurement modalities (i.e., extension peak torque and peak force, midthigh pull 1-Repetition Max, and extension RTD) to predict CMJ performance.25,27,63,67 In addition, the different training status of each of the populations examined may influence these relationships.71
group within the same study reported no significant associations between quadriceps strength and SEBT performance.77
The results of the current study suggested that there is no significant difference between the single- and multi-joint relationships to each respective functional task outcome (i.e., SC time, CMJ height, CMJ average power, CMJ average velocity, and SEBT composite distance reached). It was originally hypothesized that the multi-joint measure of leg press isometric strength would be more strongly associated with performance on the functional tasks because of a greater degree of resemblance to the biomechanical specificity of the tasks.11,25 However, the lack of significant differences between these two muscle strength assessments may be because they do not require participants to support one’s body mass in the upright position and because isometric strength is
most influenced by knee joint angles, which was 60º for both methods in this study for optimal quadriceps strength.11,28,78 Furthermore, it is possible that differences between strength testing modalities may be more apparent when examining explosive strength variables, such as the rate of force development. For example, Thompson et al. demonstrated that when measuring the rate of torque development through different strength testing modalities, one assessment would sometimes be able to better predict performance in a particular functional task.28
Table 1. Participant Demographics
Subjects Age (years) Stature (cm) Mass (kg) BMI (kg/m2) Male (n=17) 25 ± 6 180.4 ± 6.8 77.7 ± 14.1 23.77 ± 3.37 Female (n=24) 23 ± 4 163.8 ± 6.6 60.7 ± 7.7 22.66 ± 2.81 Overall (n=41) 24 ± 5 170.6 ± 10.6 67.7 ± 13.6 23.12 ± 3.07
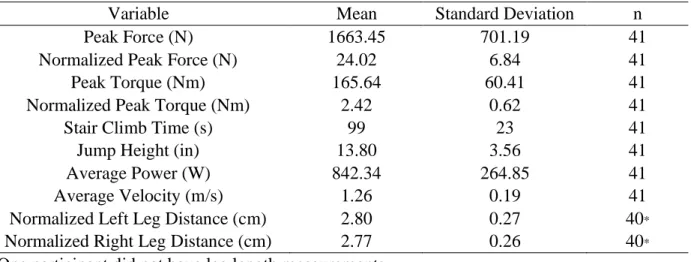
Table 2. Mean and Standard Deviation of Strength Variables and Functional Task Outcomes
Variable Mean Standard Deviation n
Peak Force (N) 1663.45 701.19 41
Normalized Peak Force (N) 24.02 6.84 41
Peak Torque (Nm) 165.64 60.41 41
Normalized Peak Torque (Nm) 2.42 0.62 41
Stair Climb Time (s) 99 23 41
Jump Height (in) 13.80 3.56 41
Average Power (W) 842.34 264.85 41
Average Velocity (m/s) 1.26 0.19 41
Normalized Left Leg Distance (cm) 2.80 0.27 40*
Normalized Right Leg Distance (cm) 2.77 0.26 40*
* One participant did not have leg length measurements.
Table 3. Relationship of Functional Task Outcomes and Measures of Strength
Variable Peak
Force
Peak
Torque Steiger Z P value Cohen’s q Stair Climb Time -0.599* -0.592* 0.047 0.962 0.011
Jump Height 0.551* 0.735* 1.394 0.163 0.320
Average Power 0.817* 0.756* 0.701 0.483 0.161
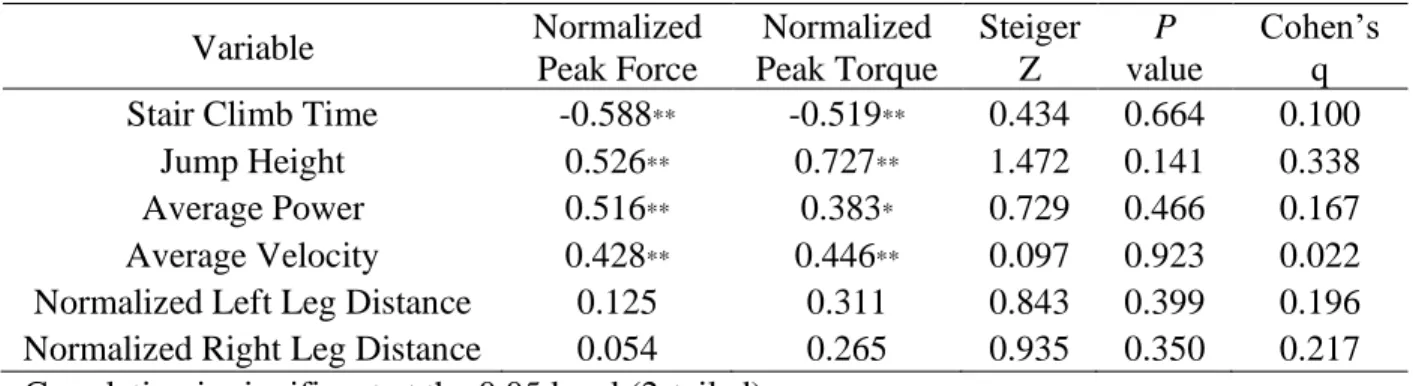
Table 4. Relationship of Functional Task Outcomes and Normalized Measures of Strength
Variable Normalized
Peak Force
Normalized Peak Torque
Steiger Z
P value
Cohen’s q Stair Climb Time -0.588** -0.519** 0.434 0.664 0.100
Jump Height 0.526** 0.727** 1.472 0.141 0.338
Average Power 0.516** 0.383* 0.729 0.466 0.167 Average Velocity 0.428** 0.446** 0.097 0.923 0.022 Normalized Left Leg Distance 0.125 0.311 0.843 0.399 0.196 Normalized Right Leg Distance 0.054 0.265 0.935 0.350 0.217 * Correlation is significant at the 0.05 level (2-tailed).
REFERENCES
1. Enoka RM. Muscle Strength and Its Development: New Perspectives. Sport Med An Int J Appl Med Sci Sport Exerc. 1988;6(3):146-168. doi:10.2165/00007256-198806030-00003
2. Hyatt RH, Whitelaw MN, Bhat A, Scott S, Maxwell JD. Association of muscle strength with functional status of elderly people. Age Ageing. 1990;19(5):330-336.
doi:10.1093/ageing/19.5.330
3. Rantanen T, Guralnik JM, Foley D, et al. Midlife hand grip strength as a predictor of old age disability. J Am Med Assoc. 1999;281(6):558-560. doi:10.1001/jama.281.6.558 4. Avlund K, Schroll M, Davidsen M, Løvborg B, Rantanen T. Maximal isometric muscle
strength and functional ability in daily activities among 75‐year‐old men and women. Scand J Med Sci Sports. 1994. doi:10.1111/j.1600-0838.1994.tb00403.x
5. Newman AB, Kupelian V, Visser M, et al. Strength, but not muscle mass, is associated with mortality in the health, aging and body composition study cohort. Journals Gerontol - Ser A Biol Sci Med Sci. 2006;61(1):72-77. doi:10.1093/gerona/61.1.72
6. Metter EJ, Talbot LA, Schrager M, Conwit R. Skeletal muscle strength as a predictor of all-cause mortality in healthy men. Journals Gerontol - Ser A Biol Sci Med Sci.
2002;57(10):B359-B365. doi:10.1093/gerona/57.10.B359
7. Ronnestad BR, Kvamme NH, Sunde A, Raastad T. Short-term effects of strength and plyometric training on sprint and jump performance in professional soccer players. J Strength Cond Res. 2008. doi:10.1519/JSC.0b013e31816a5e86
8. Bento PCB, Pereira G, Ugrinowitsch C, Rodacki ALF. Peak torque and rate of torque development in elderly with and without fall history. Clin Biomech. 2010;25(5):450-454. doi:10.1016/j.clinbiomech.2010.02.002
9. Katz S. Studies of Illness in the Aged. JAMA. 1963. doi:10.1001/jama.1963.03060120024016
10. Suchomel TJ, Nimphius S, Stone MH. The Importance of Muscular Strength in Athletic Performance. Sport Med. 2016;46(10):1419-1449. doi:10.1007/s40279-016-0486-0 11. Baker D, Wilson G, Carlyon B. Generality versus specificity: a comparison of dynamic
and isometric measures of strength and speed-strength. Eur J Appl Physiol Occup Physiol. 1994;68(4):350-355. doi:10.1007/BF00571456
13. Aagaard P, Simonsen EB, Andersen JL, Magnusson P, Dyhre-Poulsen P. Increased rate of force development and neural drive of human skeletal muscle following resistance
training. J Appl Physiol. 2002;93(4):1318-1326. doi:10.1152/japplphysiol.00283.2002 14. Leggin BG, Neuman RM, Iannotti JP, Williams GR, Thompson EC. Intrarater and
interrater reliability of three isometric dynamometers in assessing shoulder strength. J Shoulder Elbow Surg. 1996;5(1):18-24. doi:10.1016/S1058-2746(96)80026-7
15. Wang CY, Olson SL, Protas EJ. Test-retest strength reliability: Hand-held dynamometry in community-dwelling elderly fallers. Arch Phys Med Rehabil. 2002;83(6):811-815. doi:10.1053/apmr.2002.32743
16. Mentiplay BF, Perraton LG, Bower KJ, et al. Assessment of lower limb muscle strength and power using hand-held and fixed dynamometry: A reliability and validity study. PLoS One. 2015;10(10):1-18. doi:10.1371/journal.pone.0140822
17. Hayes K, Walton JR, Szomor ZL, Murrell GAC. Reliability of 3 methods for assessing shoulder strength. J Shoulder Elb Surg. 2002;11(1):33-39. doi:10.1067/mse.2002.119852 18. Toonstra J, Mattacola CG. Test-retest reliability and validity of isometric knee-flexion and
-extension measurement using 3 methods of assessing muscle strength. J Sport Rehabil. 2013;Technical(7):1-5.
19. Scholtes VA, Becher JG, Comuth A, Dekkers H, Van Dijk L, Dallmeijer AJ.
Effectiveness of functional progressive resistance exercise strength training on muscle strength and mobility in children with cerebral palsy: A randomized controlled trial. Dev Med Child Neurol. 2010;52(6):107-113. doi:10.1111/j.1469-8749.2009.03604.x
20. Yarasheski KE, Zachwieja JJ, Campbell JA, Bier DM. Effect of growth hormone and resistance exercise on muscle growth and strength in older men. Am J Physiol - Endocrinol Metab. 1995;268(2 31-2). doi:10.1152/ajpendo.1995.268.2.e268
21. Kubo K, Ikebukuro T, Yata H, Tsunoda N, Kanehisa H. Time course of changes in muscle and tendon properties during strength training and detraining. J Strength Cond Res. 2010. doi:10.1519/JSC.0b013e3181c865e2
22. Thompson BJ, Ryan ED, Sobolewski EJ, Smith-Ryan AE. Dietary protein intake is associated with maximal and explosive strength of the leg flexors in young and older blue collar workers. Nutr Res. 2015;35(4):280-286. doi:10.1016/j.nutres.2015.02.003
23. Andersen H, Schmitz O, Nielsen S. Decreased isometric muscle strength after acute hyperglycaemia in Type 1 diabetic patients. Diabet Med. 2005;22(10):1401-1407. doi:10.1111/j.1464-5491.2005.01649.x
25. Marcora S, Miller MK. The effect of knee angle on the external validity of isometric measures of lower body neuromuscular function. J Sports Sci. 2000;18(5):313-319. doi:10.1080/026404100402377
26. Tillin NA, Pain MTG, Folland J. Explosive force production during isometric squats correlates with athletic performance in rugby union players. J Sports Sci. 2012;31(1):66-76. doi:10.1080/02640414.2012.720704
27. Nuzzo JL, Mcbride JM, Cormie P, Mccaulley GO. Relationship between
countermovement jump performance and multijoint isometric and dynamic tests of strength. J Strength Cond Res. 2008. doi:10.1519/JSC.0b013e31816d5eda
28. Thompson BJ, Whitson M, Sobolewski EJ, Stock MS. Effects of Age, Joint Angle, and Test Modality on Strength Production and Functional Outcomes. Int J Sports Med. 2018;39(2):124-132. doi:10.1055/s-0043-121149
29. García-Hermoso A, Cavero-Redondo I, Ramírez-Vélez R, et al. Muscular Strength as a Predictor of All-Cause Mortality in an Apparently Healthy Population: A Systematic Review and Meta-Analysis of Data From Approximately 2 Million Men and Women. Arch Phys Med Rehabil. 2018;99(10):2100-2113.e5. doi:10.1016/j.apmr.2018.01.008
30. Leong DP, Teo KK, Rangarajan S, et al. Prognostic value of grip strength: Findings from the Prospective Urban Rural Epidemiology (PURE) study. Lancet. 2015;386(9990):266-273. doi:10.1016/S0140-6736(14)62000-6
31. Hertel J, Braham RA, Hale SA, Olmsted-Kramer LC. Simplifying the star excursion balance test: Analyses of subjects with and without chronic ankle instability. J Orthop Sports Phys Ther. 2006. doi:10.2519/jospt.2006.36.3.131
32. Kleinberg CR, Ryan ED, Tweedell AJ, Barnette TJ, Wagoner CW. Influence of Lower Extremity Muscle Size and Quality on Stair-Climb Performance in Career Firefighters. J Strength Cond Res. 2016. doi:10.1519/JSC.0000000000001268
33. Fatouros IG, Jamurtas AZ, Leontsini D, et al. Evaluation of Plyometric Exercise Training, Weight Training, and Their Combination on Vertical Jumping Performance and Leg Strength. J Strength Cond Res. 2000;14(4):470-476. doi:10.1519/00124278-200011000-00016
34. Aagaard P, Dyhre-Poulsen P, Simonsen EB, et al. A mechanism for increased contractile strength of human pennate muscle in response to strength training: Changes in muscle architecture. J Physiol. 2001;534(2):613-623. doi:10.1111/j.1469-7793.2001.t01-1-00613.x
36. Stebbings GK, Morse CI, Williams AG, Day SH. Variability and distribution of muscle strength and its determinants in humans. Muscle and Nerve. 2014;49(6):879-886. doi:10.1002/mus.24075
37. McPhee JS, Cameron J, Maden-Wilkinson T, et al. The Contributions of Fiber Atrophy, Fiber Loss, in Situ Specific Force, and Voluntary Activation to Weakness in Sarcopenia. Journals Gerontol - Ser A Biol Sci Med Sci. 2018;73(10):1287-1294.
doi:10.1093/gerona/gly040
38. Wilson GJ, Lyttle AD, Ostrowski KJ, Murphy AJ. Assessing dynamic performance: A comparison of rate of force development tests. J Strength Cond Res. 1995.
doi:10.1519/00124278-199508000-00010
39. Moritani T, DeVries H. Neural factors versus hypertrophy in the time course of muscle strength gain. Am J Phys Med. 1979;58(3):115-130.
40. Nisell R, Németh G, Ohlsén H. Joint forces in extension of the knee: Analysis of a mechanical model. Acta Orthop. 1986;57(1):41-46. doi:10.3109/17453678608993213 41. Tsaopoulos DE, Baltzopoulos V, Maganaris CN. Human patellar tendon moment arm
length: Measurement considerations and clinical implications for joint loading assessment. Clin Biomech. 2006;21(7):657-667. doi:10.1016/j.clinbiomech.2006.02.009
42. Choi SJ, Files DC, Zhang T, et al. Intramyocellular lipid and impaired myofiber
contraction in normal weight and obese older adults. Journals Gerontol - Ser A Biol Sci Med Sci. 2016;71(4):557-564. doi:10.1093/gerona/glv169
43. Rahemi H, Nigam N, Wakeling JM. The effect of intramuscular fat on skeletal muscle mechanics: Implications for the elderly and obese. J R Soc Interface. 2015;12(109). doi:10.1098/rsif.2015.0365
44. De Luca CJ, Hostage EC. Relationship between firing rate and recruitment threshold of motoneurons in voluntary isometric contractions. J Neurophysiol. 2010;104(2):1034-1046. doi:10.1152/jn.01018.2009
45. Maughan RJ, Watson JS, Weir J. Strength and cross‐sectional area of human skeletal muscle. J Physiol. 1983. doi:10.1113/jphysiol.1983.sp014658
46. Carolan B, Cafarelli E. Adaptations in coactivation after isometric resistance training. J Appl Physiol. 1992;73(3):911-917. doi:10.1152/jappl.1992.73.3.911
47. Hunter SK, Thompson MW, Adams RD. Relationships among age-associated strength changes and physical activity level, limb dominance, and muscle group in women. Journals Gerontol - Ser A Biol Sci Med Sci. 2000;55(6):264-273.
48. Jeon S, Ye X, Miller WM. Sex comparisons of agonist and antagonist muscle
electromyographic parameters during two different submaximal isometric fatiguing tasks. Physiol Rep. 2019;7(5):1-10. doi:10.14814/phy2.14022
49. Thompson BJ. Influence of signal filtering and sample rate on isometric torque – time parameters using a traditional isokinetic dynamometer. J Biomech. 2019;83:235-242. doi:10.1016/j.jbiomech.2018.12.006
50. Ryan ED, Everett KL, Smith DB, et al. Acute effects of different volumes of dynamic stretching on vertical jump performance, flexibility and muscular endurance. Clin Physiol Funct Imaging. 2014;34(6):485-492. doi:10.1111/cpf.12122
51. Hertel J, Miller SJ, Denegar CR. Intratester and intertester reliability during the star excursion balance tests. J Sport Rehabil. 2000. doi:10.1123/jsr.9.2.104
52. Gribble PA, Hertel J. Considerations for normalizing measures of the Star Excursion Balance Test. Meas Phys Educ Exerc Sci. 2003;7(2):89-100.
doi:10.1207/S15327841MPEE0702_3
53. Gribble PA, Hertel J, Plisky P. Using the star excursion balance test to assess dynamic postural-control deficits and outcomes in lower extremity injury: A literature and systematic review. J Athl Train. 2012;47(3):339-357. doi:10.4085/1062-6050-47.3.08 54. Steiger JH. Tests for comparing elements of a correlation matrix. Psychol Bull. 1980.
doi:10.1037/0033-2909.87.2.245
55. Cohen J. Statistical Power Analysis for the Behavioural Science (2nd Edition). In: Statistical Power Anaylsis for the Behavioral Sciences. ; 1988:110-116.
56. Tiedemann AC, Sherrington C, Lord SR. Physical and psychological factors associated with stair negotiation performance in older people. Journals Gerontol - Ser A Biol Sci Med Sci. 2007;62(11):1259-1265. doi:10.1093/gerona/62.11.1259
57. Bean JF, Leveille SG, Kiely DK, Bandinelli S, Guralnik JM, Ferrucci L. A Comparison of Leg Power and Leg Strength Within the InCHIANTI Study: Which Influences Mobility More? Journals Gerontol Ser A Biol Sci Med Sci. 2003;58(8):M728-M733.
doi:10.1093/gerona/58.8.m728
58. Michaelides MA, Parpa KM, Henry LJ, Thompson GB, Brown BS. Assessment of
physical fitness aspects and their relationship to firefighters’ job abilities. J Strength Cond Res. 2011. doi:10.1519/JSC.0b013e3181cc23ea
59. Sheaff AK, Bennett A, Hanson ED, et al. Physiological determinants of the Candidate Physical Ability Test in firefighters. J Strength Cond Res. 2010.
60. von Heimburg ED, Rasmussen AKR, Medbø JI. Physiological responses of firefighters and performance predictors during a simulated rescue of hospital patients. Ergonomics. 2006;49(2):111-126. doi:10.1080/00140130500435793
61. Laffan M. The Neuromuscular Contributions to Stair Climb Performance in Career Firefighters. 2019.
62. Nuzzo JL, Cavill MJ, Triplett NT, McBride JM. A descriptive study of lower-body strength and power in overweight adolescents. Pediatr Exerc Sci. 2009;21(1):34-46. doi:10.1123/pes.21.1.34
63. Thompson BJ, Ryan ED, Sobolewski EJ, et al. Relationships between rapid isometric torque characteristics and vertical jump performance in division i collegiate American football players: Influence of body mass normalization. J Strength Cond Res. 2013. doi:10.1519/JSC.0b013e318281637b
64. Jiménez-Reyes P, Samozino P, Cuadrado-Peñafiel V, Conceição F, González-Badillo JJ, Morin JB. Effect of countermovement on power–force–velocity profile. Eur J Appl Physiol. 2014;114(11):2281-2288. doi:10.1007/s00421-014-2947-1
65. Ugarkovic D, Matavulj D, Kukolj M, Jaric S. Standard anthropometric, body composition, and strength variables as predictors of jumping performance in elite junior athletes. J Strength Cond Res. 2002. doi:10.1519/1533-4287(2002)016<0227:SABCAS>2.0.CO;2
66. Requena B, González-Badillo JJ, Saez De Villareal ES, et al. Functional
performance,maximal strength, and power characteristics in isometric and dynamic actions of lower extremities in soccer players. J Strength Cond Res. 2009.
doi:10.1519/JSC.0b013e3181a4e88e
67. Kraska JM, Ramsey MW, Haff GG, et al. Relationship between strength characteristics and unweighted and weighted vertical jump height. Int J Sports Physiol Perform. 2009;4(4):461-473. doi:10.1123/ijspp.4.4.461
68. Stone MH, Stone ME, Sands WA. Principles and practice of resistance training. In: Human Kinetics; 2007:169.
69. Markovic S, Mirkov DM, Nedeljkovic A, Jaric S. Body size and countermovement depth confound relationship between muscle power output and jumping performance. Hum Mov Sci. 2014. doi:10.1016/j.humov.2013.11.004
70. Jaric S. Role of body size in the relation between muscle strength and movement
performance. Exerc Sport Sci Rev. 2003;31(1):8-12. doi:10.1097/00003677-200301000-00003
72. Thorpe JL, Ebersole KT. Unilateral balance performance in female collegiate soccer athletes. J Strength Cond Res. 2008. doi:10.1519/JSC.0b013e31818202db
73. Filipa A, Byrnes R, Paterno M V., Myer GD, Hewett TE. Neuromuscular training improves performance on the star excursion balance test in young female athletes. J Orthop Sports Phys Ther. 2010;40(9):551-558. doi:10.2519/jospt.2010.3325
74. Robinson R, Gribble P. Kinematic predictors of performance on the star excursion balance test. J Sport Rehabil. 2008;17(4):347-357. doi:10.1123/jsr.17.4.347
75. Hansson EE, Beckman A, Håkansson A. Effect of vision, proprioception, and the position of the vestibular organ on postural sway. Acta Otolaryngol. 2010.
doi:10.3109/00016489.2010.498024
76. Earl JE, Hertel J. Lower-extremity muscle activation during the star excursion balance tests. J Sport Rehabil. 2001;10(2):93-104. doi:10.1123/jsr.10.2.93
77. Clagg S, Paterno M V., Hewett TE, Schmitt LC. Performance on the modified star excursion balance test at the time of return to sport following anterior cruciate ligament reconstruction. J Orthop Sports Phys Ther. 2015;45(6):444-452.
doi:10.2519/jospt.2015.5040
78. Narici M V., Hoppeler H, Kayser B, et al. Human quadriceps cross-sectional area, torque and neural activation during 6 months strength training. Acta Physiol Scand.