An RNA structure-mediated, posttranscriptional model
of human
α
-1-antitrypsin expression
Meredith Corleya,b, Amanda Solema, Gabriela Phillipsa, Lela Lackeya, Benjamin Ziehrc,d, Heather A. Vincentc,d, Anthony M. Mustoee, Silvia B. V. Ramosf, Kevin M. Weekse, Nathaniel J. Moormanc,d, and Alain Laederacha,b,1
aDepartment of Biology, University of North Carolina at Chapel Hill, Chapel Hill, NC 27599;bCurriculum in Bioinformatics and Computational Biology,
University of North Carolina at Chapel Hill, Chapel Hill, NC 27599;cDepartment of Microbiology and Immunology, University of North Carolina at Chapel
Hill, Chapel Hill, NC 27599;dLineberger Comprehensive Cancer Center, University of North Carolina at Chapel Hill, Chapel Hill, NC 27599;eDepartment of
Chemistry, University of North Carolina at Chapel Hill, Chapel Hill, NC 27599; andfDepartment of Biochemistry and Biophysics, University of North Carolina
at Chapel Hill, Chapel Hill, NC 27599
Edited by Rachel Green, Johns Hopkins University, Baltimore, MD, and approved October 19, 2017 (received for review April 20, 2017)
Chronic obstructive pulmonary disease (COPD) affects over 65 million individuals worldwide, where α-1-antitrypsin deficiency is a major genetic cause of the disease. The α-1-antitrypsin gene, SERPINA1, expresses an exceptional number of mRNA isoforms generated en-tirely by alternative splicing in the 5′-untranslated region (5′-UTR). Although allSERPINA1mRNAs encode exactly the same protein, ex-pression levels of the individual mRNAs vary substantially in different human tissues. We hypothesize that these transcripts behave un-equally due to a posttranscriptional regulatory program governed by their distinct 5′-UTRs and that this regulation ultimately deter-mines α-1-antitrypsin expression. Using whole-transcript selective 2′-hydroxyl acylation by primer extension (SHAPE) chemical probing, we show that splicing yields distinct local 5′-UTR secondary structures inSERPINA1transcripts. Splicing in the 5′-UTR also changes the in-clusion of long upstream ORFs (uORFs). We demonstrate that disrupt-ing the uORFs results in markedly increased translation efficiencies in luciferase reporter assays. These uORF-dependent changes suggest that α-1-antitrypsin protein expression levels are controlled at the posttranscriptional level. A leaky-scanning model of translation based on Kozak translation initiation sequences alone does not adequately explain our quantitative expression data. However, when we incorpo-rate the experimentally derived RNA structure data, the model accu-rately predicts translation efficiencies in reporter assays and improves
α-1-antitrypsin expression prediction in primary human tissues. Our results reveal that RNA structure governs a complex posttranscriptional regulatory program ofα-1-antitrypsin expression. Crucially, these find-ings describe a mechanism by which genetic alterations in noncoding gene regions may result inα-1-antitrypsin deficiency.
translation efficiency
|
RNA secondary structure|
uORFs|
SERPINA1|
α-1-antitrypsin deficiencyH
umanα-1-antitrypsin is of particular clinical interest becausedeficiencies in this protein are associated with chronic ob-structive pulmonary disease (COPD), liver disease, and asthma
(1–4). Smoking is the major environmental factor that
contrib-utes to COPD risk, although the inconsistency of COPD rates among smokers points to additional genetic factors that
modu-late risk (5–7). Multiple genetic variants in the gene encoding
α-1-antitrypsin, SERPINA1, cause the disease α-1-antitrypsin
deficiency (8–10), which can result in COPD, liver failure, and
inflammatory conditions like panniculitus, vasculitis, and
glo-merulonephritis (9, 11, 12).α-1-Antitrypsin is a protease inhibitor
that specifically targets neutrophil elastase, which is present at
chronic low levels in the lungs (1). Deficiency of α-1-antitrypsin
thus results in higher levels of neutrophil elastase, which in turn degrades elastin (especially in the lungs), resulting in COPD (13).
Thus, the role ofSERPINA1in COPD etiology is well described at
the protein level; however, little is known aboutSERPINA1at the
transcript level and whether alteration of potential
post-transcriptional controls can contribute to α-1-antitrypsin
de-ficiency and ultimately COPD. Genome-wide association studies
identified COPD-associated variants that map to the SERPINA1
untranslated regions (UTRs), introns, and promoter region (5, 14).
Furthermore, genetic variants shown to alterSERPINA1 splicing
patterns were identified in theSERPINA1introns of patients with
COPD (15, 16). The presence of disease-associated variants in noncoding regions suggests that posttranscriptional regulation of
SERPINA1 mRNA is an important component of disease risk.
Nevertheless, variants in noncoding regions ofSERPINA1comprise
only a small fraction of its disease-associated variants discovered to date, which may reflect the tendency of variant discovery studies to focus exclusively on coding exons (10, 17).
Several features ofSERPINA1 emphasize the importance of
its transcripts and their regulation. The SERPINA1gene is
ex-ceptionally complex; 11 different splicing isoforms occur in human tissues (18). While alternative splicing occurs in 95% of human
multiexon genes (19, 20), the 11SERPINA1 transcripts are
ex-treme, placing SERPINA1 in the top 0.5% of human genes in
terms of transcriptional complexity (18). A particularly salient
feature ofSERPINA1alternative splicing is that all variants differ
only within their 5′-UTRs (21). Therefore, allSERPINA1mRNA
isoforms code for the sameα-1-antitrypsin protein; however, their
Significance
Protein and mRNA expression are in most cases poorly corre-lated, which suggests that the posttranscriptional regulatory program of a cell is an important component of gene expres-sion. This regulatory network is still poorly understood, in-cluding how RNA structure quantitatively contributes to translational control. We present here a series of structural and functional experiments that together allow us to derive a quantitative, structure-dependent model of translation that accurately predicts translation efficiency in reporter assays and primary human tissue for a complex and medically important protein, α-1-antitrypsin. Our model demonstrates the im-portance of accurate, experimentally derived RNA structural models partnered with Kozak sequence information to explain protein expression and suggests a strategy by which α -1-antitrypsin expression may be increased in diseased individuals.
Author contributions: M.C., A.S., G.P., A.M.M., K.M.W., N.J.M., and A.L. designed research; M.C., A.S., G.P., L.L., B.Z., H.A.V., and S.B.V.R. performed research; M.C. and A.S. analyzed data; and M.C., A.S., B.Z., A.M.M., K.M.W., N.J.M., and A.L. wrote the paper.
The authors declare no conflict of interest.
This article is a PNAS Direct Submission.
This open access article is distributed underCreative Commons Attribution-NonCommercial-NoDerivatives License 4.0 (CC BY-NC-ND).
Data deposition: The data reported in this paper have been deposited in the Gene Ex-pression Omnibus (GEO) database,https://www.ncbi.nlm.nih.gov/geo(accession no.
GSE81525). SHAPE data are also available in SNRNASM format athttps://docs.google.com/ spreadsheets/d/1_RpB9Jto1-UEmK-ocd9pGMOYrtet1ALuaA7XTyqI8ZA/edit?usp=drive_web. 1To whom correspondence should be addressed. Email: [email protected].
differing 5′-UTRs likely determine transcript-specific differences in posttranscriptional processes such as mRNA translation effi-ciency, subcellular localization, and stability (22, 23). Importantly, the SERPINA1 transcript isoforms are differentially expressed across tissue types (24), suggesting that posttranscriptional
regula-tory mechanisms adjust α-1-antitrypsin production based on the
transcripts expressed in each tissue. The presence of up to three
upstream ORFs (uORFs) in the SERPINA1 5′-UTRs (25, 26)
suggests a potentially important yet unstudied mechanism for the translation efficiency regulation of these transcripts. In addition to
the sequence-based differences between SERPINA1 transcripts,
RNA secondary structure differences in the 5′-UTR could also
determine their regulation (27–29).
We propose here that noncoding features of SERPINA1
transcripts make up a posttranscriptional regulatory program
that ultimately determines α-1-antitrypsin expression. We
de-scribe a complex interplay between alternative splicing and translation efficiency mediated by uORFs and RNA structure,
which together control tissue-specific expression of α
-1-anti-trypsin in humans. Our quantitative and predictive model reveals
an important and overlooked aspect ofα-1-antitrypsin deficiency
and suggests RNA-based targets for therapeutic consideration.
Results
Transcript Complexity inSERPINA1.As a clinically important gene
harboring numerous COPD and α-1-antitrypsin
deficiency-associated variants (30) (Fig. 1A), SERPINA1 is of additional
interest for the exceptional number of transcript isoforms it produces. Two transcription start sites (TSSs), six splicing donor (SD), and three acceptor (SA) sites yield a total of 11 transcript
isoforms (21) (Fig. 1AandFig. S1), which placesSERPINA1in
the top 0.5% of transcriptionally complex human genes (18). Remarkably, all of the alternative splicing occurs in the
5′-UTR of SERPINA1 mRNA (Fig. 1A). Thus, in healthy
adults,α-1-antitrypsin exists as a single protein isoform that is
produced from 11 different mRNAs. We sought to determine whether the mRNAs are functionally different and how any
dif-ferences relate toα-1-antitrypsin production or deficiency.
We therefore began this investigation by quantifying the
ex-pression of the variousSERPINA1transcripts in human tissues. Using
data from the Illumina BodyMap 2.0 transcriptome-wide RNA-seq
project, we quantified the relative amount of totalSERPINA1
tran-scripts in 16 human tissues (Fig. 1B) and we show the relative amount
of eachSERPINA1transcript in the form of a heat map (Fig. 1C).
There are clear differences in the total amount ofSERPINA1present
in each tissue. Liver noticeably yields the highest totalSERPINA1
read counts (Fig. 1B), reflecting thatα-1-antitrypsin is primarily
expressed by hepatocytes and secreted into the bloodstream
(1, 31). While the lungs are thought to acquireα-1-antitrypsin from
the bloodstream (1, 32), we found that lung tissue transcribes
non-trivial amounts ofSERPINA1(Fig. 1B), thus potentially producing its
ownα-1-antitrypsin. Although someSERPINA1transcript isoforms
are more prevalent than others, we detected all of the transcripts,
with some tissues like liver expressing every transcript (Fig. 1C). To
verify these findings with greater specificity, we designedSERPINA1
5′-UTR–specific primers and amplified RNA extracted from liver
and lung epithelial cells (HepG2 and A549 cell lines, respectively). All 11 transcripts were expressed in HepG2 cells, and all save 1 in
A549 cells (Fig. 1C,Bottom). The varied expression of theSERPINA1
transcript isoforms across the tissues suggests that eachSERPINA1
transcript has a distinct posttranscriptional function. Given that these
transcripts vary only in their 5′-UTR, we hypothesize that the splicing
complexity in the 5′-UTR ofSERPINA1plays an important role
in its posttranscriptional regulation, especially, as detailed next, inSERPINA1mRNA translation.
Translation Efficiency Analysis.The 5′-UTR in an mRNA regulates translation of the coding sequence and ultimately controls the
expression of protein products (22). To test the effect of different
SERPINA1 5′-UTRs on mRNA translation, we measured the
translation efficiencies of six representativeSERPINA15′-UTRs
with luciferase assays. Strikingly, we found significant differences
in translation efficiency for the sixSERPINA15′-UTRs (Fig. 2A).
Alternative splicing determines the inclusion (or exclusion) of up
to three uORFs in the final SERPINA1 transcript isoform (26)
(Figs. 1Aand 2B, andFig. S1). Because uORFs can affect
trans-lation efficiency (33, 34), the uORFs inSERPINA1may modulate
translation of the different transcripts [an idea acknowledged decades ago (25) but untested until now]. To evaluate the effect of
uORFs onSERPINA1translation, we mutated the start codon of a
single uORF in each luciferase construct from“AUG”to“AAG”
(Fig. 2B). In this group of mutants, we mutated every possible
SERPINA1uORF in at least one construct. Although it is possible that translation initiation at the mutated start codons could still
occur (35), the initiation efficiency of an“AAG”start codon is
very low—between 0 and 3% (36).
Mutating the uORF start codon(s) resulted in large increases in the translation efficiency of three of the six transcripts (Fig.
2C), suggesting that these uORFs typically inhibit translation.
The three transcripts with inhibitory uORFs are NM_000295.4, NM_001002236.2, and NM_001127705.1, and their mutated
uORFs were uORFγ, uORFδ, and uORFδ′, respectively (Fig.
2B). Interestingly, uORFγis too close to the mRNA 5′-terminus
to be translated based on canonical understanding of translation initiation (37). However, our luciferase assays clearly suggest that it is functional, as it both significantly represses translation of
Pi*S Pi*Z
A
TSS1
E3 E4 E5
E2 E1c.2
E1a.1 E1b.1
uORFα uORFβ uORFδ
SD3 SA3 SD2a SA2a SA1 SD1a
SD3 SA3
TSS2 E2 E3 E4 E5
uORFγ TSS1
E3 E4 E5
E2 E1c.1
E1a.2 E1b.2
uORFα uORFβ uORFγ|δ
start uORFδ'
SD1b SA1 SD2a SA2b SD3 SA3
log(TPM)
log(total TPM) skeletal muscle
kidney lung liver thyroid
testis heart
lymphnode prostate breast ovary brain adrenal
adiposecolon leukocyte
A549 HepG2
NM_000295 NM_001002235
NM_001
127700
NM_001
127707
NM_001
127704
NM_001
127705
NM_001
127706
NM_001
127702
NM_001
127703
NM_001002236
NM_001
127701
B
C
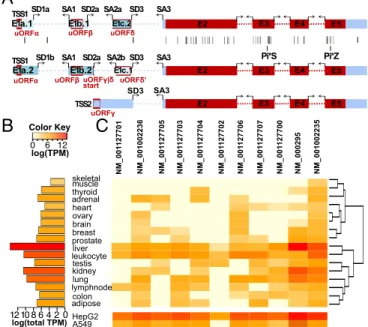
Fig. 1. TheSERPINA1gene produces 11 splice isoforms, all encoding the same protein. (A) All exons inSERPINA1. Coding sequence (CDS) exons are shown in red, and untranslated regions (UTRs) in blue. Each exon, splice donor (SD), and splice acceptor (SA) is identified by a unique name. The twoSERPINA1TSSs are labeled TSS1 and TSS2. Disease-associated variants, as cataloged by the Human Gene Mutation Database, are indicated with black lines, including the common α-1-antitrypsin deficiency-associated Pi*S and Pi*Z alleles. Upstream ORFs (uORFs) are indicated by red boxes and named. uORFδ/δ′spans a splice junction and is present only in isoforms with exon E1b.2. (B) The total amount of expressed SERPINA1 differs across 16 human tissue types. Total SERPINA1
transcript amounts were estimated from the Illumina BodyMap 2.0 project and are shown in log relative transcripts per million (TPM). (C) TheSERPINA1 tran-script isoforms are expressed, with different frequencies, across different tissues. Transcripts are specified with their NCBI names. The log(TPM) of eachSERPINA1
transcript is shown for each tissue and for A549 and HepG2 cells. TPMs are relative to liver, which expresses the mostSERPINA1and is set to a total of 106.
SYST
EMS
BIOLOGY
PNAS
transcript NM_000295.4 relative to other single-uORF
tran-scripts (Fig. 2A), and relieves translational inhibition when it is
mutated (Fig. 2C). The use of an alternate upstream TSS in the
luciferase reporter construct likely accounts for the translation of
uORFγin our assays (38). 5′-RACE indicates variability of start
site usage in the constructs, including transcripts with additional
5′sequence (Fig. S3).
Modeling Translation Efficiency.The inhibitory uORFγ, uORFδ,
and uORFδ′uORFs identified above all have different sequences.
However, closer inspection revealed that uORFγ, uORFδ, and
uORFδ′share highly similar Kozak sequences (Fig. 2A), the
well-characterized sequence element that determines translation
initia-tion efficiency (39, 40). Indeed, uORFγ, uORFδ, and uORFδ′have
much stronger Kozak sequences compared with the SERPINA1
uORFs determined to be nonfunctional in our luciferase assays (40)
(grayscale in Fig. 2C).
Confident that uORFs and their Kozak sequences play an important role in regulating translation, we next used uORF Kozak sequence strengths (40) to model the differences in
translation efficiency between the SERPINA1 transcripts. We
first modeled translation efficiency with a previously derived
“leaky-scanning”model of translation (34), which we expanded
to accommodate multiple nonoverlapping uORFs (Methodsand
Eq. 1). The model assumes the scanning mechanism of
trans-lation, whereby ribosomes migrate along the 5′-UTR until
en-countering a start codon, and calculates the probability that
ribosomes“leak through”any uORF to ultimately translate the
primary coding sequence (41). The leaky-scanning model is based solely on the strength of the Kozak sequence of each ORF. The leaky-scanning model moderately predicted the translation
efficiencies given by our luciferase assay data (r2=0.40; Fig. 2D).
To control for potential inaccuracies in the Kozak sequence strengths (40), we repeated the leaky-scanning model analysis
strength, but this adjustment only increased the r2 value to
0.46 at most. Other features in theSERPINA1transcripts beyond
Kozak sequence thus heavily influence their translation. As an alternative model that may explain our translation ef-ficiency measurements, we considered the variable TSS usage
in-dicated by 5′-RACE (Fig. S3). A significantly shorter 5′-UTR could
remove uORFγ and potentially uORFα. If we adjust predictors in
the leaky-scanning model (Eq.1) to ignore these uORFs, we see no
improvement in fit (r2=0.42,Table S1). Another factor that could
affect translation efficiency is reinitiation after uORF translation (42).
We therefore fit a“reinitiation leaky-scanning”model (Eq.2) to the
experimental translation efficiencies, but observed no
im-provement (r2=0.33,Table S1). The rules that govern uORF
reinitiation are admittedly poorly understood (43). It is
possi-ble that uORFα, which has a strong Kozak sequence (Fig. 2B
and Dataset S1), nevertheless fails to inhibit coding sequence (CDS) translation (Fig. 2) due to efficient reinitiation after
uORFα translation. Adjusting uORFα Kozak strength in the
leaky-scanning model to reflect this idea, we observe a moderate
improvement in fit (r2=0.60,Table S1). An additional factor that
can modulate translation efficiency is mRNA secondary structure. Evidence for the effect of secondary structure on translation has
been conflicting (27–29, 34, 40), but such studies have typically
re-lied on theoretical structure prediction, which falls far short of the accuracy achieved with direct chemical probing experiments (44, 45). We next sought to predict translation efficiency for the
SERPINA1 transcripts using secondary-structure features derived from chemical structure probing.
Secondary Structure ofSERPINA1Transcripts.Recent advances in RNA structural mapping techniques, in particular selective
2′-hydroxyl acylation by primer extension and mutational profiling
(SHAPE-MaP) (46), have enabled accurate, high-throughput,
whole-transcript structural interrogation of RNA (47–49). SHAPE-MaP
interrogates the reactivity of each 2′-hydroxyl in an RNA
to-ward the reagent 1-methyl-7-nitroisatoic anhydride where the relative reactivity estimates the tendency of each nucleotide to be structured (i.e., base paired) or unstructured (i.e., unpaired). To
measure structure differences between theSERPINA1transcripts, we
performed SHAPE-MaP separately on the sixSERPINA1transcript
isoforms whose 5′-UTRs were examined in luciferase assays. The
resulting data are highly correlated between replicates (Fig. S4), with
average correlation coefficients of 0.89 or more. Our experimental SHAPE-MaP data provide SHAPE reactivity profiles at nucleotide
resolution for each of the sixSERPINA1transcripts. Regions with
lower median SHAPE values (low SHAPE reactivities) consist of
largely unreactive nucleotides (Fig. 3A), whereas regions with higher
median SHAPE values indicate the reverse (Fig. 3B). The
median-centered SHAPE reactivities of each transcript illustrate the relative reactivity of regions in the transcripts and indicate structured regions
(Fig. 3C). The high-reproducibility of SHAPE-MaP is immediately
apparent in the median-centered SHAPE profiles: the reactivity patterns in the coding sequences (CDSs) are nearly identical across
the six transcripts, corresponding to the transcripts’ identical CDS
sequences (Fig. 3CandFig. S5). In addition, shared exons in the 5′
-UTRs also exhibit comparable SHAPE reactivities despite existing in
unique contexts in the different transcripts (Fig. S5).
We next used our SHAPE-MaP data to derive minimum
free-energy structure models for the sixSERPINA1transcripts (44, 50).
SHAPE reactivities were incorporated as pseudo–free-energy terms to
guide RNA structure modeling with RNAfold (51). Importantly, this approach has been extensively validated and generally yields structure models with accuracies above 90% (44, 46, 51, 52). Even in the case where there is not SHAPE data for the entirety of an RNA (as is common at the ends of transcripts), incorporating available SHAPE data still greatly improves the accuracy of structure predictions (53, 54). As an internal control, we initially compared the structure
Number of uORFs
Mut vs WT TE
WT vs Control TE
Kozak sequence score (%)
0 100
A
α β δ
NM_001002236.2
α β δ'
NM_001
127705.1
α β
NM_001
127704.1
α
NM_001
127700.1
* γ
NM_000295.4
α
NM_001002235.2
Control
firefly luciferase
=
0 1 1 1 2 3 3
B
C
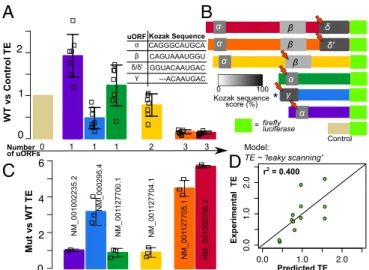
D
r2 = 0.400Experimental TE
Predicted TE Model:
TE ~ 'leaky scanning' uORF Kozak Sequence
CAGGGCAUGCA α
β
γ δ/δ'
CAGUAAAUGGU GGUACAAUGAC ---ACAAUGAC
Fig. 2. Translation efficiency (TE) differs betweenSERPINA1transcripts and is affected by uORFs. (A) The TEs of sixSERPINA15′-UTRs and their SDs, as measured by luciferase reporter assays. Replicate TE values are shown as open squares. Transcripts are labeled by NCBI name. Measurements are relative to the luciferase assay control. The number of uORFs in each tran-script is indicated (Bottom). The Kozak sequence of each uORF is listed. (B) Schematic of theSERPINA1luciferase constructs and empty vector con-trol. Luciferase CDS not to scale. uORFs in each transcript are indicated with Greek letters and shaded by Kozak sequence score (see color scale). Red arrows indicate uORFs selected for mutation. (C) TEs of the sixSERPINA1
models derived for the CDS regions of different transcripts. Consistent with the high correlation observed between SHAPE-MaP profiles, the secondary-structure models are highly similar in
the CDS regions, supporting the robustness of the models (Fig.
S6). However, we were most interested in the structures around
the uORFs and the beginning of the CDS, and how this in-formation could be used to model translation efficiency.
Modeling Translation Efficiency with Structure.We next sought to gain a quantitative understanding of the contribution of RNA structure to translation. The interplay of transcript structural elements with the translational machinery is not well understood, although studies in bacterial and mammalian systems suggest that secondary structures near start codons are most likely to affect mRNA translation (27, 28, 55, 56). We established above
that the uORFs inSERPINA1affect translation efficiency and
found that a model that incorporates only Kozak sequence strength did not quantitatively explain a large portion of the
translation efficiency differences (Fig. 2D). We hypothesized
that, in addition to Kozak sequence strength, the model requires structural data encompassing the Kozak sequence to accurately capture the probability of the ribosome initiating at a given ORF. SHAPE-MaP data provided us with a high-confidence structure
of each transcript (Fig. 3DandFig. S6), including the structures
surrounding each Kozak sequence (Fig. 4AandBandFig. S5).
Studies in prokaryotes suggest that translation initiation occurs
in proportion to the exponent of the free energy (ΔG) of
unfolding of the local structure (57), which is the energy required
to“unfold”a region of RNA (and is thus a positive value). We
modified the leaky-scanning model from Eq.1to include theΔG
of unfolding around the Kozak sequence (Methodsand Eq.3).
The SHAPE data-driven“structure leaky-scanning”model
dra-matically improves the predictive power of the model to 94%
(Fig. 4C). The structural terms in the model weigh each Kozak
sequence by its accessibility in addition to its strength. From their
location in uORF secondary structures, it is immediately clear that not all of the uORF Kozak sequences are equally accessible
(Fig. 4AandB). For example, the Kozak sequence for uORFδ
resides in a single-stranded loop, while the Kozak sequence for
uORFαis engaged in a based-paired stem structure. It appears
that uORFsδ,δ′, andγare the only uORFs that have a Kozak
sequence that is both strong and structurally accessible (Figs. 2C
and 4AandB, andFig. S7), potentially explaining why only these
uORFs inhibitSERPINA1translation in our assays. The specific
ΔGof unfolding associated with each uORF Kozak sequence is
important: permuting theΔGvalues’assignments and refitting the
structure leaky-scanning model never producesr2values reaching
0.94 (value of P < 0.001). Furthermore, refitting the structure
leaky-scanning model usingΔGvalues predicted without SHAPE
data yields a lower correlation (r2=0.79;Dataset S1), supporting
the importance of using accurate SHAPE-based structure models. Finally, we also varied the size of the unfolding region around the
Kozak sequence used for calculating ΔG of unfolding values.
Supporting the physical relevance of our structure leaky-scanning model, the optimal predictive power was obtained for an unfold-ing window size of 30 nt, consistent with the known size of the eukaryotic ribosomal footprint (58, 59). Either smaller or larger unfolding regions exhibited significantly worse agreement with the
translation efficiency data (Table S2).
It is important to note that our structure models for the
SERPINA1 transcripts focus on local structures (Methods). Al-though long-range interactions in large RNAs can occur, local structure is thought to dominate the folding of mRNAs (60, 61). To explore the possibility of longer-range secondary structures, we
recalculated the ΔG of unfolding values, allowing for greater
pairing distances in RNA structure predictions and refit our
structure leaky-scanning model in each case (Table S3). Predictive
A
Unstructured Structured δ SHAPE reactivity −0.5 0.0 0.5 1.0 1.5 2.0 −0.5 0.0 0.5 1.0 1.5 2.0 SHAPE reactivity .4 .85 SERPINA1codingexons UGGG C A GG AACU GG G C A CUGUGCCCAGGGCAUGCA CUGCCUCCA
C
G
C
A
GCAACCCUCAGAGUCCUG
A GCUGA A CCA AG A AG G AGGAG GGGGU CGGG CCU
C
CGAG
GAA GGC CU A GC CG C UGCUGCU GCCAG
GA
A
UUC
CAGUGUGGAGG G GCGGCACCA
UCCU G
C
CAGCCUUCAGGC CACUCUCC
U GU GCC U G C C A GA
AGAGACAGAGCUUG AGGAGAGCUUGAG G A GA GC A G G AA
AGGGCGGCAGUGUCUUCAA A G C AU C AGGC AUUUUGGGGUGA
C
UCAGUAAAU
GGU
A
G AUCUUG CUACCA
GU
GG
AACAG
CCA
C
UACACUGGGAUU
A
G
UGAGAG
CAGA
G
GG
CCAGCUAAGUGG
U
A CUCUCCC
AG
A
GACUG UCUGACUCA C
GCCACCCCCUCCACCUUGGACACAGGAC
GC U GUG G U U U C
UGAGCCAGGU ACAAUG
ACU
C
CUUUC
G
CAGCC
UCCCCCGUU GCCC C UC U GG AUCC A C UG CUUAAACGGACGUA
AGGA CA GGGCCC U G U CU
CCUCAGUUC CAGGCACCACCACUGACC
UGGGACAGU G
A
AUCCGUCUUCGUUGAUUCCAAUGGGGCGCGC
A U CUCCCGCUGUACUGGGCCCUGGCCUGU
GGUCCC
U
GUCUCCCUGG
C
UGAGGAUCCCCAGGGAGA
U
GCUGC C CAGAA
GA
C
A
GAUACAUCCCACCAUGAUCAGGAACCCAAUCCCUUCAA CA A
G
AUC
A
CCCCCAACCUGGCUGA
G
UUCGUCCU CAGCCUAUACCGCCAGCUGGCACACC
AGUC
C
AACAGCACCAAUAUCUUCUUCUCCCCAGUG AGC AU C G C U A C
AGCCUUU GCAAUG CUCUCC
CUGGGG
A
CCCUAAGGCUGACA CA
C
GAUGAACUGGAUC
A
GG
G
CC
U
GAAUUUCAACCUCACGG A G A UU CC GG A GG C UC A G A U CC AUG AAGGCUUCCAGGAACUC
CU
C
C GUACCCUCAACCAGCCAGACA
G
C C
A
GCUCAC GCUGACCACCG GCA A UGGCC U G U UCCUCAGCGA
GGGCCUGAAGCU
AGUGGAUAAG
UUU UU G G A G G A U G U U AAAAAGUUGUACCACUGAAGCCCAUUCACUGUCAACUUCGGG
GACA CCGAA
GACAAAUAGAAAGACGGACCCGAUUAC
G UGG A G AA G GGU
ACUCAAGGG AAAAUUGUG G AU UU GG UCA AGGAGCUU GAC AGAGAC AC AGUUU U
UGCUCUUAAGGGUUACAUCUUCUUUAAAGGC A A A U G G G A G A G ACCCUU UGAAGUCAAGG
A C A C C GA GGA AGA G GAC U UCCAC GUGGA CCAGGUG
ACCACCGUG
A A G GU G CC UAUGAUGAAGCGUUUA
GGCAUGUUUAACAUCC A GC AC UG U A AGAAGC
U
GUCCAG C U G GGUG CUGCU GAU
GAAAUACCUGGGAAUCGCCACC GCC
A
UCUUCUUCC UGCCUGAUAGG
GGGA
AACAAUACUGGCAGCAC A A UG
AACCACCUCACGA
UAUCAUCA C CA A GU U CCUG GAAAAUGAAGA
CA G AA GG U C U G CC A
GCUUACAUAUUCCCAAACU
GUC
CAUAUCUGGAACCUAUGCGGGUAAGGUCGCACUGAUUCAACU GGGC
AU
CACUA
A GGUC
UUCAGC A AU GGGG CU G ACCUC
UCCGGGGGGGAUACAC AG GCAC CCCUAGCUCUCCAGAA
GGCC
G
U
GCAUAAGGCUG U
GC UG
ACCAUCGACGAGAAAGGG A
C
UG
A
ACGUGCACCCUAGGGGUUGAUC CCCG GCUAGAAUGAUCUUUUUCCCCC
CGAGG U CAA
G
UUCAACCUCACAA UUGUCUUCUUAAUGAUUGAACAAAAUACCAAG
UCUCCCCUCUUCA U G GGAAAAG UG GUGAAUCCC ACCCAAAAAUAA G U GGG C C G C C G C G A U GG C G C G U A GG C G C G CC G CG C GU A U C G C G U A C G C G C G U A C G A U G C G C G C G U G C G C U G G C G C A U A U C G C G U A G C C G G C C G G C G C U G G C G C A U G C G C G C C G C G U A C G U A C G C G U A G C CC G CG UA GC G CG G C C G U G U A G C A U G C G C AA U GC GG CG UG UGC GC
U A G C G U GG C U A G C G C U A A U G C G C U A G C G C G C G C UU G UU A CC G U A GG CG C G G C U A G C G C U G CC G AA U GG CUA U U A C G C G G C G C A U G CC G U A G C U G G C G C U G U AA UG CG C
G C C G C G C G UUGG CCG UA GC U A CC GG CC G C G C G U A G C U G G C G U G C A U C G A U G C C GC AU AUCCG G C G C G C G U C G C G C G C GAU GG C G CCCG G U U A C G U A C G C G C G U A G C G CC G CA UA U
C G U A G C CC G G C A U U A C G G C G C C G U A G C A U G U C G U A G C G C U A C G C G C G C G A U G C GC GC AU GC CG CG AU AU UA C GC CCG A U G C G C C G U G CC G AA U C G G C G C A U G C A UAA UA CG CG GC GC GCU A U GGU G C G C CCG U G U G CACC GUU A U G C C G C G C G A U C G G U G C C G G C G C G C G C C G C G C G C G U G U G G C U G U A U A U G A U A C GG C GGC AU GU UUG C G U A U A C G G C G C G U C G C G C G A U G C G U A U A U A U A U U G U A G C U A G C U A U G UUU A GG CUU A C G AA UAA UG CGG G C G C U AC GUU ACGAUAUGCCGUUG
G C G C G C G AA U CC G G C G C G C A U A U G C A U G C G C U G AA UC GGC G G C C GGCGCGCGAUC GA UU AC GCGCG
U AU CG CG UG A U G C C GU A G C G C C G U A U A C G C G CGCGAUUA C G A U G CU A UG C G U A GG C G C A UU A CC G G C A U C G A U G C C G C C G C U A U A G C A U U G C G U A C GG CU AA U G C U G C G C G G C G C C G G C G C G C GG C GG C U A GG CCCGGCGUUACGGUUGCCGGGC
U A C G C G A U G U G C C G C G G C G C G C GGC CC G G U A U G C G C U A C G C G C G G CC GG CG C U A G C
α β δ
.4 .85
980 940
90 110 0
5 70
+1
0 1 30
B
C
D
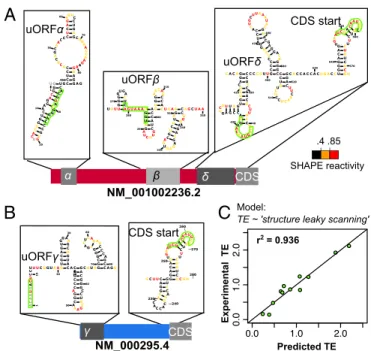
Fig. 3. SHAPE-MaP structure probing data for SERPINA1 transcripts. (A) SHAPE reactivity of each nucleotide in a region of low median SHAPE values around the start codon of transcript NM_001002236.2. Each value is shown with its SE and colored by SHAPE reactivity according to the color scale. Nucleotides are numbered by their relative position within the tran-script; the start codon is labeled+1. (B) SHAPE reactivity of each position in a region of high median SHAPE values in the coding sequence of transcript NM_001002236.2. (C) The windowed, median-centered SHAPE profiles of six
SERPINA1transcripts ordered by length. Higher SHAPE values indicate un-structured (unpaired) regions, while lower SHAPE values indicate un-structured (base-paired) regions. uORFs are indicated with gray shaded regions and named with Greek letters. Vertical bars separate exons. (D) The minimum free-energy (MFE) secondary structure of transcript NM_001002236.2, modeled by computational folding with SHAPE reactivity information.
B
U G G G C A G G A AC U G G G C A CUGUGC CC
AGG G CAU GC
A C U G CC
U C C A C G C A GC AA
C CC
U
C
A G AG UC
C U G A GCUG AA C C A A G A A G G A G G A G
U U 1 10 20 30 40 50 60 70 80 A uORFα uORFβ
UUU UG
G G GU GA
C U C
A G U A A AU G G U A G A UCUU
G C U A C C AGU
G G AA CAG
C C A CUAAG
G A U U C U G C A G UG AGA
GC AG AG
GG
C CAGCU A A A 270 280 290 300 310 320 330 340 350 NM_001002236.2 uORFδ CDS start
CA CAG G A CG C U G U G G U U U C UG A G C CA
G G U
A CA
A UGA C U C C UU U C G C A G CC U C C C CC GUUGC
C C C U C U G G A U C C A C U GC
UUAAA U A C G G A CG AG G U U A 410 430 440 450 460 470 490 C C G U C U G AC A G G G C 500 C C U G U C U CCU C AG
C U U C A G
G CAC C A C C A CU G ACCUG G G A C A G U G AAU
CGA CAA UCGC
G U C U U C U G U C U C G U
CUGG
510 560 570 520 530 540 5505 5 0
α β δ CDS
.4 .85 SHAPE reactivity
C
A
NM_000295.4 uORFγUU UCGG UAAGU G C A G U GG AGA
C U G U A C A C
U G C C C AG G C AA AGC G U CC G G G C A G CGUAGG
C G G G C G A CUCAG AU
CC CA G C C A GU A U C C ACA A U G A CU CC 11 0 20 30 40 50 60 70 80 90 C γ CDS
r2 = 0.936
Experimental TE
Predicted TE
Model:
TE ~ 'structure leaky scanning'
GCU UC A G G C A C CA C CAC
UG A C C U G GG
A C A G U G AAU
C GAC AA UG C C G U C U U C U G U C UCG U
CU G G 230 240 250 260 270 2808 0 2 A C C C 2 CDS start
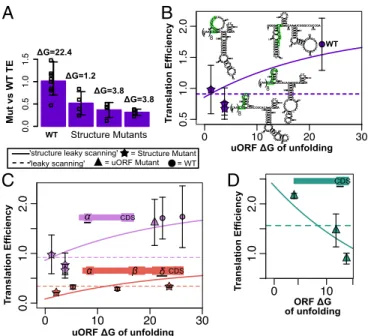
Fig. 4. Structural data greatly improve the leaky-scanning model of trans-lation efficiency (TE). (A) SHAPE-based predicted structures around the uORFs and coding sequence start in transcript NM_001002236.2. uORFs are labeled by name. Bases are colored according to their SHAPE reactivity, as measured by SHAPE-MaP. Bases with unknown SHAPE data are colored gray. Kozak sequences are outlined in green. (B) SHAPE-based predicted structures around the uORF and coding sequence start in transcript NM_000295.4. (C) TEs of wild type and uORF mutantSERPINA1constructs predicted with the structure leaky-scanning model of translation (Eq.3) fit to experimental TEs, as measured by luciferase assays (r2=0.936,n=12). SYST
EMS
BIOLOGY
PNAS
distance increases (Table S3), suggesting that local structure is most important in determining translation of these transcripts (Table S3). However, we cannot exclude the possibility of long-range interactions. While a few recent structure probing methods can directly detect long-range interactions (62, 63), SHAPE-directed modeling accuracy decreases for long-range interac-tions, which could also contribute to the decreased performance as max pairing distance increases.
Based on this analysis, we propose that the Kozak sequence determines the likelihood of initiating translation, but the secondary structure determines whether the Kozak sequence can in fact be
accessed. Thus, the translation efficiency of eachSERPINA1
tran-script is a combination of the initiation strength and structure of its CDS Kozak sequence, attenuated by the translation efficiency of any uORFs as governed by the same parameters.
Mutating Secondary Structure to Change Translation Efficiency.While our luciferase assays suggest that little to no translation occurs at
uORFα (Fig. 2), available ribosomal profiling data (64) show
minimal yet detectable signal at uORFα(Fig. S8). This indicates
that uORFαis capable of translation and is thus capable of being
translationally regulated, including by structural manipulation. To further assess the role of secondary structure in controlling uORF
function, we designed structure mutants for uORFα(in transcript
NM_001002235.2). We designed three mutants with low free en-ergies of unfolding to be predominantly single stranded within 30 nt of the uORF Kozak sequence. Mutants contained altered sequences upstream and downstream of the Kozak sequence, without altering the Kozak sequence itself. The wild-type structure
of uORFα has an unfolding energy of 22.4 kcal/mol, while the
three mutants have unfolding energies below 4 kcal/mol and are
expected to enhance the activity of uORFα, thus diminishing
translation of the CDS. The translation efficiency of each structure mutant was measured by luciferase assays relative to wild type. As expected, the mutants show reduced translation efficiencies (of
the CDS) relative to wild type (Fig. 5A) that are consistent with
predictions from the structure leaky-scanning model (Fig. 5B).
In transcript NM_001002236.2, which contains uORFδ, we
designed four mutants with increased energies of unfolding within 30 bases of the uORF Kozak sequence and an additional
mutant with greatly decreasedΔGof unfolding. As with uORFα, a
reduction in the ΔG of unfolding causes a reduction in overall
translation efficiency relative to wild type (Fig. 5C and Fig. S9).
Conversely, increasing theΔGof unfolding around uORFδincreases
translation efficiency in one structure mutant, but as the
structure-mutant energies of unfolding increase above∼25 kcal/mol, overall
translation efficiency begins to decrease (Fig. S9). These results could
be interpreted to indicate that theΔGof unfolding is not a significant
factor controlling uORFδ translation initiation. Alternatively, the
overall decrease in translation efficiency as hairpin sizes increase exactly replicates multiple experiments in which hairpins of increasing
size added to the 5′-UTR progressively reduce translation efficiency
(39, 65–67). Thus, increasing theΔGof unfolding around a uORF
may increase overall translation efficiency up to a point (56), beyond which strong secondary structures begin to impede ribosomal scan-ning altogether (65).
Overall, our data fromSERPINA1wild type, uORF mutant,
and structure mutant luciferase assays strongly support that theΔG
of unfolding around the Kozak sequence is an important determinant of translation efficiency. Including the additional structure mutants, the leaky-scanning model moderately predicts translation efficiencies
(r2 = 0.55), but most of the variation in translation efficiency is
explained by the structure leaky-scanning model (r2=0.83).
Chang-ing theΔGof unfolding around a single Kozak sequence in a given
5′-UTR leads to changes in translation efficiency that are well
pre-dicted by the structure leaky-scanning model, but unanticipated by
the leaky-scanning model (Fig. 5CandD).
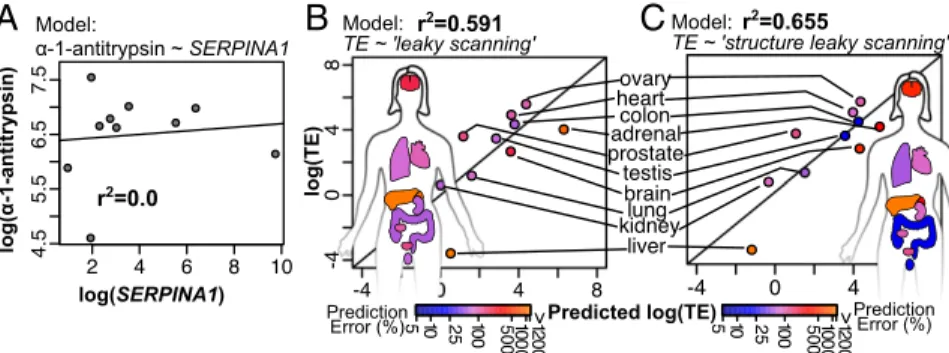
Modeling α-1-Antitrypsin Expression in Tissue. A goal of scriptomics is to develop models that accurately describe tran-script dynamics and expression in living tissue. As we have seen
from tissue-specific transcriptome data,SERPINA1 transcription is
not limited to the liver, and different tissues express different
com-binations of theSERPINA1transcript isoforms (24) (Fig. 1BandC).
Thus, optimized combinations ofSERPINA1transcripts could
regu-late the amount ofα-1-antitrypsin protein produced in each tissue.
Based on available protein quantification data (68), we calculated the
overallSERPINA1translation efficiency in each tissue as the ratio of
α-1-antitrypsin protein toSERPINA1transcript totals. If the
trans-lation efficiency of SERPINA1mRNA were equal in every tissue,
then we expect to observe that α-1-antitrypsin amounts and total
SERPINA1transcript amounts are correlated. However, we observed
no such correlation (Fig. 6A), indicating that different tissues have
different netα-1-antitrypsin translation rates, potentially due to their
unique combinations of SERPINA1 transcript isoforms. Assuming
that the overall translation efficiency in a tissue is the average of the
translational efficiencies of all itsSERPINA1transcripts weighted by
abundance, we can use the two scanning models described above to
predictSERPINA1translation efficiency in tissues (Eq.4). While our
luciferase assays show uORFγ to repress translation in transcript
NM_000295.4 (Fig. 2C), it is likely that this uORF is not functional in
vivo given its close proximity to the transcript 5′termini and lack of a
canonical translation initiator of short 5′-UTR (TISU) sequence (37).
Indeed, when we assessed our ability to model translation efficiency
treating the uORFγas functional (Fig. S10) or nonfunctional (Fig. 6
BandC), the nonfunctional assumption yielded better prediction of
ΔG=22.4
ΔG=1.2
ΔG=3.8 ΔG=3.8
CDS
α β δCDS
α CDS
Mut vs WT TE
Structure Mutants
'structure leaky scanning'
'leaky scanning' = WT
= Structure Mutant = uORF Mutant
uORF ΔG of unfolding
ORF ΔG of unfolding
T
ranslation Efficiency
uORF ΔG of unfolding
CAGGGCA UGCAUC
G C G CACACACC C U C C U C G C A A GAUCCGU GAGCGAUA
CCAAG A A G G A G G A G G GGGU C GAC G G U A U A G 30 40 50 60 70 80 90 G G C G G C C C G A A U C G C G C G U A C G C G U A C G G C U A G C G C G G GCCCU
C GA C100 C G GC GC CAA C 1) ( 8
CAGGG C A U GCCAAAAC
CAC U G C C U C C U C A G AGUCCU
G AGCUGGAACCAA A A G G A G G A G GG G G UC C C A G A A U A G GGG 30 50 60 70 80 90 G C G C A U C G U G C G C G U A C G C G U A C G A U UA CG UGACC G G GCCCU
C GA C100 C G GC GC CAA C 1) ( 8
CAGGGC A U GCAUGC
CG CAACCGCACACC
U C C U C A GAGU CCU GAG UGAAGAAGAACC G A G G A G G G G G UC G U C GAA G G C A U U A AA G 30 40 50 60 70 80 90 G C G CC G A U A U C G C G U G C G C G U A C G A UCAGCGUA GGGG
UUAA G G GCCUCC
GA C100 C G GC GC CAA C 1) ( 8
UGGGGAACCAG U G G G C A CUGUGC
C C A GGG CA U G CACU
GCA GCAACC
C U C A GAGUCCU G AGCUGAAGGAAGACCA A G G A G G G G G UCGGGCCUCCGA U A A G G C A U U A G C 1 10 20 50 60 70 80 90 100 G C C G A U G C C G U A G C G C G C C G A U C G U A G C A U C G C G C G U G C GA U UAGCGGCGAUA WT
A
C
D
B
WT
T
ranslation Efficiency T
ranslation Efficiency
Fig. 5. Structure mutants show translation efficiency (TE) is a function of ΔGof unfolding around the uORF Kozak sequence. (A) TE relative to wild type (WT) for three uORFαstructure mutants in transcript NM_001002235.2. Replicate TE values are shown as open squares. The predicted ΔG of unfolding is shown for each structure mutant. (B) Structure mutant and WT TEs plotted with the structure leaky-scanning (solid line) and leaky-scanning (dotted line) models as functions of uORFα ΔGof unfolding. The predicted structure for each mutant and the WT uORFαis shown. Kozak sequences are outlined in green. CAA repeats are abbreviated in the mutants. (C) The structure leaky-scanning and leaky-scanning models as functions of uORFα ΔGof unfolding (lilac), or uORFδ/δ′ΔGof unfolding (peach). Experimental TEs are plotted forSERPINA1structure mutants (stars), uORF mutants (tri-angles), and WT constructs (circles) that contained only uORFαor uORFα,β, and δ/δ′. (D) The structure leaky-scanning and leaky-scanning models as functions of ORF (CDS)ΔGof unfolding. Experimental TEs are plotted for
tissue-specific translation efficiencies. The leaky-scanning model of
translation (Fig. 2D and Eq. 1) explains 59% of the variation in
translation efficiency between tissues (Fig. 6B), whereas the structure
leaky-scanning model (Fig. 4Cand Eq.3) explains 66% (Fig. 6C).
The addition of RNA structural data to the model of translation thus improves predictions of translation efficiency in human tissues.
Discussion
The amount of protein produced from a gene is not a simple function of the abundance of the transcript (69, 70). The com-plex path between transcript expression and protein expression is often a missing link in our understanding of cellular phenotype, indicating a need for integrative models that bridge this divide.
SERPINA1 is exemplary of the effects of posttranscriptional
regulation on protein output. While each of theSERPINA1
tran-scripts produces the same protein isoform, they do so with different
translation efficiencies. Differences in uORF content and 5′-UTR
secondary structure combine to differentiate the translational
effi-ciencies ofSERPINA1transcripts. Secondary structure plays a
sur-prisingly important role in accounting for these differences, and in
determining the repressive effect of individualSERPINA1uORFs.
When considering the role of secondary structure in a system, cor-rectly defining an RNA secondary structure demands more than a cursory computational prediction. Structural data accurate enough for successful biological models require comprehensive chemical or
enzymatic probing of the RNA molecules of interest (46–48).
Pre-viously, no correlation was found between secondary structure and translation rate in experiments that measured the protein expression of constructs with varied uORF or CDS Kozak sequences (34, 40). In these studies, it is likely that the purely computational RNA structure models were inadequate for predicting structures around Kozak se-quences. In this study, we used SHAPE-MaP chemical probing to successfully improve mRNA translation efficiency predictions (44)
(Figs. 2D, 4C, and 5). While this model aptly describes the translation
of SERPINA1 transcripts, additional experiments measuring the translation efficiencies of simultaneous uORF and structure mutants are necessary to determine the contribution of secondary structure in more detail. Additionally, a more generalizable model of translation efficiency will require modifications to capture additional factors that regulate translation, including overlapping uORFs, reinitiation after
uORF translation (43), non-AUG uORF translation (71), and 5′cap
secondary structure (65).
Transcript-specific translation efficiencies may play an important role in tissue-specific protein expression, especially in the case of
α-1-antitrypsin, which shows a complex and varied expression
pat-tern across human tissues. However, overallα-1-antitrypsin output
in a tissue is not solely a consequence of translation efficiency. Transcripts travel through a coordinated posttranscriptional
pro-gram, or“regulon”(72), and may diverge from their fellow isoforms
at each step. Tissues could also have different overall rates of translation (for example, in a fast- versus slow-growing tissue) or have different rates of protein export.
These additional layers of regulation likely explain why our model of translation efficiency performs better in tissue culture cells than in tissues. However, our model still provides insights
into the regulation ofα-1-antitrypsin expression in tissues. First,
liver tissue is a considerable outlier in both models ofSERPINA1
translation efficiency (Fig. 6 BandC). Interestingly, predicting
much higher translational efficiencies in liver tissue than
ob-served based on measured levels ofα-1-antitrypsin is consistent
with the understanding that liver exports most of its α
-1-anti-trypsin into the bloodstream (1, 31, 73). This artifact indicates a need for tissue-specific cellular import/export dynamics to in-form models of protein expression. Conversely, the models predict translation efficiency in lung tissue fairly accurately,
suggesting that translation of SERPINA1 mRNA is a major
source of itsα-1-antitrypsin, which contrasts the paradigm that
lung tissue derives itsα-1-antitrypsin from the bloodstream (1, 32).
Our detection of SERPINA1 transcripts in cultured lung cells
(A549 cells; Fig. 1C) and recent quantification of SERPINA1
transcripts in lung tissue (24) further support the conclusion that
cells in the lung itself expressα-1-antitrypsin. This surprising
con-clusion contradicts current models of the role ofα-1-antitrypsin in
disease. The most common genetic variant inSERPINA1associated
with COPD and α-1-antitrypsin deficiency, the Pi*Z allele, is
thought to cause α-1-antitrypsin to be poorly exported from the
liver, leading to deficient α-1-antitrypsin levels in the lungs and
eventual neutrophilic overload (1, 8, 32). If lung tissue produces its
ownα-1-antitrypsin, however, then this disease model is likely
in-complete. Instead, disease-associated variants must also impact
α-1-antitrypsin levels in lung tissue, either by producing
un-viableα-1-antitrypsin or reducing its translation. For example,
genetic variants could reduceα-1-antitrypsin production if they
shift SERPINA1 transcription to isoforms with the lowest
translation efficiencies. A recent study quantified α
-1-anti-trypsin and different SERPINA1 transcripts in the serum of
α-1-antitrypsin deficiency patients and healthy controls to
determine whether patients have different combinations of the transcripts (24). Unfortunately, the primer design in that study did not differentiate between the transcripts with the lowest and highest translational efficiencies, but the data did show a change in transcript proportions for at least one patient population (24).
Ultimately, COPD in α-1-antitrypsin deficiency is caused by
the diminished levels ofα-1-antitrypsin. Current therapies attempt
to deliver donor serum-derivedα-1-antitrypsin i.v. to affected
indi-viduals, but this treatment is costly and of unknown efficacy (74).
Model:
TE ~ 'leaky scanning' r
2=0.591 Model:
TE ~ 'structure leaky scanning' r
2=0.655
r2=0.0
log(SERPINA1)
log(α-1-antitrypsin)
Model:
α-1-antitrypsin ~ SERPINA1
A
log(TE)
B
C
Predicted log(TE) Prediction
Error (%) Prediction
Error (%)
> >
Fig. 6. Predictions ofSERPINA1translation efficiency (TE) in 10 human tissues are improved with the structure leaky-scanning model. (A) TotalSERPINA1
transcript versusα-1-antitrypsin protein measurements show no correlation (r2=0.0,n=10). Protein measurements are in normalized spectral counts (68);
transcript measurements are in transcripts per million (TPM). (B) Leaky-scanning model predictions of TE versus measured TE in each tissue (r2=0.591,n=10).
Each tissue is labeled and colored in the plot and in the human figure according to its prediction percent error (Eq.5). (C) Structure leaky-scanning model predictions of TE versus measured TE in each tissue (r2=0.655,n=10).
SYST
EMS
BIOLOGY
PNAS
could be increased in situ, perhaps with antisense oligonucleotides (ASOs) that target the Kozak sequences around the uORFs in
SERPINA1 transcripts, as shown recently for other uORF-containing mRNAs (56). ASOs would likely act as
double-stranded regions that increase theΔGof unfolding around uORF
Kozak sequences, blocking the uORFs in SERPINA1transcripts
and increasing in situ α-1-antitrypsin expression. Our findings
il-lustrate the importance of the numerous SERPINA1 transcript
isoforms and their translation in disease and the impact of post-transcriptional regulation and secondary structure on phenotype in general.
Materials and Methods
SERPINA1 Annotation. The known SERPINA1 transcript annotations were
taken from RefSeq, version hg38. In each transcript, uORFs are defined by a start and stop codon in the same frame within the 5′-UTR. Distinct uORFs are named here with the Greek lettersα,β,γ,δ, andδ′.
Heat Map of Tissue-Specific Isoform Expression.Paired-end RNA-seq reads from 16 different tissues were downloaded from the Illumina BodyMap 2.0 project [Gene Expression Omnibus (GEO) accession number GSE30611]. Abundance estimates of the 11 knownSERPINA1transcripts were quantified with Sailfish, version Beta 0.7.6 (75), using the full human transcriptome (RefSeq, version hg38) as the reference. Estimates of total SERPINA1 ex-pression in each tissue were calculated as the sum of transcripts per million (TPM) estimates of each transcript. For better visualization in Fig. 1BandC, total expression in liver was adjusted by constant to 106, and all other
tis-sues’ TPM measurements were adjusted by the same constant. All TPM measurements are provided inDataset S1.
Cell Line-Specific Transcript Expression.A549 and HepG2 cells were provided by the Tissue Culture Facility at University of North Carolina at Chapel Hill. RNA was isolated using TRIzol. Using Phase-Lock Heavy (Eppendorf) to remove the organic phase, the aqueous phase was then purified using a PureLink RNA mini kit (Life Technologies) and subjected to TurboDNase to digest DNA. The total RNA from each cell line was then reverse transcribed with SuperScript III (Life Technologies and New England Biolabs Hot Start Q5; NEB) and amplified with 35 cycles in a reverse transcription–PCR (RT-PCR). BecauseSERPINA1transcript NM_000295.4 has a unique TSS, reverse tran-scription reactions with reverse primer GCCCCACGAGACAGAAGACGG were split into two different PCRs using forward primers TGGGCAGGAACTGGGCACTG and ACAATGACTCCTTTCGGTAAGTGCAGTGG to amplify NM_000295.4 and all other transcripts, respectively. Following purification with a PureLink PCR cleanup kit (Life Technologies), samples were assessed on an agarose gel. Double-stranded DNA was prepared using a Nextera DNA Library Prep Kit (Illumina). Following concentration determination via Qubit and library analysis with a Bioanalyzer, libraries were sequenced on a miSeq (Illumina). Transcript isoform abundances in A549 and HepG2 cells were estimated with Sailfish, version Beta 0.7.6 (69), mapping the sequenced reads to a reference that in-cludes all known transcripts in RefGene hg38 excepting NM_000295.4, due to its separate primer set. Relative abundance of NM_000295.4 in A549 and HepG2 cells was estimated using a dilution series amplified separately in 35 cycles of RT-PCR with two primer sets: ACTTAGCCCCTGTTTGCTCC (forward) and TGTCGATTCACTGTCCCAGG (reverse) for NM_000295.4 and ACCCTCA-GAGTCCTGAGCTG (forward) and CTCTGTCTCTTCTGGCAGGC (reverse) for all otherSERPINA1transcripts. Both primer sets were designed to amplify∼150 bp of sequence. Products from the dilution series of NM_000295.4 and other SER-PINA1transcripts from A549 and HepG2 cells were run on a 2% SEAkem GTG (Lonza) agarose gel and stained with 1×GelStar (Lonza) and were quantified with a gel imager. The quantifications of each dilution series were fit to logistic curves, and inflection points were determined for the NM_000295.4 and other transcript curves. The ratio between the two inflection points was used as the ratio of NM_000295.4 transcript to all otherSERPINA1transcripts. TPM mea-surements for each transcript in A549 and HepG2 were adjusted based on their respective NM_000295.4:other ratios.SERPINA1transcript abundance estimates in the cell lines are provided inDataset S1.
Luciferase Assays.To assess the translation efficiency ofSERPINA1transcripts, we built six luciferase constructs containing 5′-UTRs from six selected SER-PINA1 transcripts: NM_001002235.2, NM_000295.4, NM_001127700.1, NM_001127704.1, NM_001127705.1, and NM_00100236.2. The 5′-UTRs were cloned via double digestion with NcoI and SacII into a modified pGL3 that
SERPINA1and control constructs, 0.5μg of plasmid was transfected into HeLa cells. Cells were harvested with Cell Culture Lysis Reagent (Promega; E153A) 24 h posttransfection. Luciferase activity of the samples was measured by Luciferase Assay Substrate (Promega; E151C) and Luciferase Assay Buffer (Promega; E152B) with a luminometer (Molecular Devices). Luciferase activity measurements were taken in duplicate and averaged for each sample. The lu-ciferase activity measurement for each sample was normalized to total sample protein concentration, as determined by Bradford assay (n=4), and reported in
Dataset S1. Luciferase measurements were further normalized to the abundance
of luciferase RNA in each sample to obtain (luciferase activity)/(luciferase RNA), as described previously (76). To quantify luciferase RNA abundance, after mea-suring luciferase activity, total RNA was extracted with TRIzol. Samples were depleted of DNA with Ambion Turbo DNA-free (AM1907) and reverse tran-scribed with High Capacity cDNA Reverse Transcription Kit (Applied Biosystems; 4368814). Luciferase and GAPDH cDNAs were quantified by real-time PCR (qRT-PCR) on a Bio-Rad CFX96 Real-Time System. Luciferase and GAPDH primers used were 5′-ACAAAGGCTATCAGGTGGCT-3′(forward), 5′ -CGTGCTCCAAAACAA-CAACG-3′ (reverse), and 5′-CTGTTGCTGTAGCCAAATTCGT-3′ (forward), 5′-ACCCACTCCTCCACCTTTGAC-3′ (reverse), respectively. Luciferase RNA abundance was determined by theΔΔCT method (n=4). All (luciferase activity)/(luciferase RNA) measurements are reported relative to an empty vector control to correct for systematic variations between experiments.
uORF Mutants.To disrupt uORFs in the original sixSERPINA1plasmid con-structs, we designed primers to substitute the start codon of selected uORFs from AUG to AAG using the NEB Q5 site-directed mutagenesis kit. uORFδand uORFδ′ were mutated in NM_001002236.2 and NM_001127705.1 luciferase plasmids using primers uORFT435A1F: CCAGGTACAAAGACTCCTTTC/uORFT435AR: CTCA-GAAACCACAGCGTC. uORFβwas mutated in NM_001127704.1 luciferase plasmid using primers uORFT285AF: ACTCAGTAAAAGGTAGATCTTGCTAC/uORFT285AR: CACCCCAAAATGCCTGATG. uORFαwas mutated in NM_001002235.2 and NM_001127700.1 luciferase plasmids using primers uORFT32AF: GCCCAGGG-CAAGCACTGCCTC/uORFT32AR: ACAGTGCCCAGTTCCTGCC. uORFγwas mutated in NM_000295.4 luciferase plasmid using primers uORFT4AF: CCGCGGACAAA-GACTCCTTTC/uORFT4AR: CCTCGGCCTCTGCATAAA. Mutant constructs were verified by sequencing (Dataset S2). Luciferase assays were performed on the mutant constructs as above, and results are reported in Fig. 2,Fig. S2, and
Dataset S1.
uORF Structure Mutants. The structure mutants of uORFα in transcript NM_001002235.2 and of uORFδin transcript NM_001002236.2 were com-putationally designed by altering sequences adjacent to the uORF Kozak sequences and predicting the resulting change in secondary structure. To design structure mutants, codons in the given uORF were either permuted or mutated with CodonShuffle (77) to preserve dinucleotide frequency and codon usage. To design mutants with increased uORFΔGof unfolding, se-quence upstream of the uORF was changed to complement the new uORF sequence. To design mutants with decreased uORFΔGof unfolding, se-quence upstream of the Kozak sese-quence was substituted with CAA repeats, which adopt a single-stranded structure (65). Kozak sequences (6 nt up-stream and 2 nt downup-stream of the AUG) were left unchanged. TheΔGof unfolding was then predicted for all ORFs in the transcript, selecting mu-tants that exhibited the desired change in uORFΔGof unfolding without affecting the predictedΔGof other open read frames. Three mutants were selected for NM_001002235.2 and five for NM_001002236.2. The structure mutant 5′-UTRs were cloned via double digestion into modified pGL3 plas-mids and verified by sequencing (Dataset S2) as described above. Luciferase assays were performed as before, except without normalization to luciferase RNA levels. Previous luciferase assay data (wild type and uORF mutant constructs) show a very strong linear correlation (r=0.95) between luciferase activities alone and luciferase activities normalized by luciferase RNA, indicating that luciferase activity alone is sufficient to estimate translation efficiency for these constructs. Luciferase assays on wild-type NM_001002236.2 were per-formed in parallel for comparison. Structure mutant luciferase activities adjusted to the scale of RNA-normalized luciferase values according to the following: adjusted luciferase activity=(luciferase activity)*0.20650+0.20141. Structure mutant luciferase assay results are reported in Fig. 5,Fig. S9, andDataset S1.