SIDE POPULATION SORTING SEPARATES SUBFRACTIONS OF INTESTINAL STEM CELLS
Richard Joseph von Furstenberg
A thesis submitted to the faculty of the University of North Carolina at Chapel Hill in partial fulfillment of the requirements for the degree of Master of Science in the Department of Cell and Molecular Physiology
Chapel Hill 2012
ii ABSTRACT
RICHARD VON FURSTENBERG: Side Population Sorting Separates Subfractions of Intestinal Stem Cells
(Under the direction of Susan J. Henning)
iii
ACKNOWLEDGEMENTS
This thesis project would not have been possible without my mentor Susan and wife Jen. Their support, both academic and personal, was critical to my success. I consider myself very lucky to have the guidance of these two women, both of whom are scientists, educators, and nurturers at heart. Thank you both for all that you have given of yourselves on my behalf. In this same paragraph I would be remiss not to mention the serenity that our dogs Molly and Oliver have provided me. After a failed experiment or under the pressure of a deadline their “in the moment” mindset, not dwelling or fearing, has set a beautiful example. At the bench I have been helped greatly by Brian Smith, I appreciate your hard work and intellectual contribution.
I want to thank my committee members Michael Goy, Kay Lund, John Rawls, and Susan Henning who have given me wonderful instruction both in the classroom and in meetings. This M.S. curriculum in C&MP was made possible by Carol Otey with the help of Adriana Tavernise, thank you both for your help.
iv
TABLE OF CONTENTS
LIST OF FIGURES………vi
Chapter I. INTRODUCTION………..1
II. MATERIALS AND METHODS………...7
Mice……….7
Cell preparation and SP staining and analysis……….7
SP and EdU S phase analysis………...8
SP and Lgr5-EGFP tracking………...8
qRT-PCR of SP subpopulations………...9
Quantification of enteroendocrine cells in the lower SP…………...….10
III. S PHASE ANALYSIS OF SIDE POPULATION………..12
IV. UPPER SP CONTAINS ACTIVE INTESTINAL STEM CELL………...13
V. TRANSCRIPT ANALYSIS OF UPPER AND LOWER SP………...15
v
qRT-PCR of lineage mRNA markers………16
VI. ENTEROENDOCRINE CELL QUANTIFICATION………...18
vi
LIST OF FIGURES
Figure
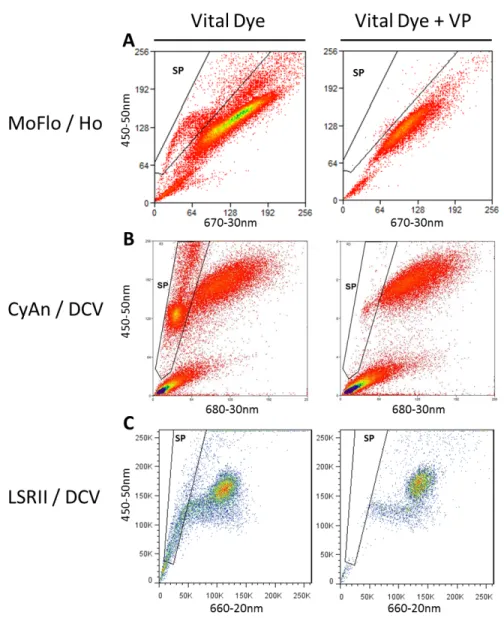
1. SP analysis approaches and validation……….…….27
2. Locating the actively cycling cells with regard to the SP subpopulations....28
3. Tracking Lgr5-EGFP cells to the SP subpopulations………...29
4. qRT-PCR analysis of ISC mRNA markers in the USP and LSP……….….30
5. qRT-PCR analysis for lineage mRNA markers in USP and LSP……….…31
6. Quantifying enteroendocrine cells in SP sub populations………....32
vii
ABBREVIATIONS AND SYMBOLS
Atoh1 Protein atonal homolog 1
Bmi1 B lymphoma Mo-MLV insertion region 1
CBC Crypt base columnar cell
ChgA Chromogranin A
Dclk1 Doublecortin-like kinase 1
Dll1 Delta-like 1
EdU 5-ethynyl-2’-deoxyuridine
EE Enteroendocrine cell
EDTA Ethylenediaminetetraacetic acid
EGFP Enhanced green fluorescent protein
FACS Fluorescence-activated cell sorting
HBSS Hank's Balanced Salt Solution
HEPES 4-(2-hydroxyethyl)-1-piperazineethanesulfonic acid
Hopx Homeobox only domain
ISC Intestinal stem cell
viii
Lrig1 Leucine-rich repeats and immunoglobulin-like domains 1
LSP Lower side population
Lyz Lysozyme
Msi1 Musashi RNA-binding protein 1
mTert Mouse telomerase reverse transcriptase
Muc2 Mucin 2
Olfm4 Olfactomedin 4
SI Sucrase isomaltase
Sox9 SRY-box containing gene 9
SP Side population
Syp Synaptophysin
USP Upper side population
WT Wild type
h Hour
min Minute
CHAPTER 1 INTRODUCTION
The existence of the intestinal epithelial stem cells (ISCs) that can generate the four main lineages of the small intestine (absorptive, goblet, enteroendocrine, Paneth cell) has been recognized for the last 40 years.1 There have been recent strides in the
2
The supra-Paneth cells labeled by these markers have demonstrated the potential to generate the four main intestinal lineages, and cycle at higher frequency following damage.12,13,10 The active and slow-cycling ISC populations appear to be engaged in a fluid relationship in which the +4 cell can repopulate the CBC pool, and conversely the CBC can generate the +4 cell in a bidirectional phenomenon termed interconversion.14,10 Furthermore, and in the same vein, it has been proposed that the Lgr5+ cells express transcriptional markers associated with quiescence (Bmi1, Tert, Hopx, and Lrig1) while maintaining an active status in the CBC position15. Adding to this concept of plasticity, recent publications suggest that committed progenitors or subsets of both Paneth and enteroendocrine cells (EE) may re-enter the cell cycle following damage.16,17,18,19
While the various ISC transgenic mice have allowed for elegant experiments and new insight, this approach is limited to these specifically-engineered animals and thus has experimental and therapeutic limitations. In contrast, fluorescence-activated cell sorting (FACS) approaches using antibodies against surface markers such as DCLK1, CD24, and LRIG1 offer the potential to sort ISC from any mouse or human. However to date the published antibody based methods each have caveats of their own: DCLK1 is expressed on slow-cycling ISC and differentiated tuft cells, CD24 is expressed on actively-cycling ISC and Paneth cells, and while Lrig1 is expressed on slow-cycling ISC, high levels of
Lrig1 are expressed in the CBC.20,21,22 In light of these caveats a selection method based on a conserved stem cell property of dye efflux and DNA content offers a parallel approach to surface marker strategies.
3
utilizing bone marrow cells, has now been used to successfully isolate stem cells from many solid tissues including skeletal muscle, lung, liver, testis, kidney, skin, mammary gland, heart, and brain.23 Our laboratory reported in 2005 the use of SP sorting to enrich for ISC from WT mouse intestine.24 A microarray comparing the intestinal SP to intact jejunum, and consequent Gene Ontology analyses, revealed enrichment in Msi1 and interestingly a de-enrichment of markers associated with cell cycle.25 Gulati et al. also validated the SP as originating primarily from the crypt base by performing in situ for 36 transcripts enriched in the aforementioned SP microarray, of which 32 were found to be restricted to the crypt base.
4
REFERENCES
1. Cheng H, and Leblond CP. Origin, differentiation and renewal of the four main
epithelial cell types in the mouse small intestine. V. Unitarian theory of the origin of the four epithelial cell types. American Journal of Anatomy 141: 537-562, 1974.
2. Noah TK, Donahue B, and Shroyer NF. Intestinal development and
differentiation. Exp Cell Res 317: 2702-2710, 2011.
3. Sato T, van Es JH, Snippert HJ, Stange DE, Vries RG, van den Born M,
Barker N, Shroyer NF, van de Wetering M, and Clevers H. Paneth cells constitute the niche for Lgr5 stem cells in intestinal crypts. Nature 469: 415-+, 2011.
4. Potten CS, Owen G, and Booth D. Intestinal stem cells protect their genome by
selective segregation of template DNA strands. Journal of Cell Science 115: 2381-2388, 2002.
5. Barker N, van Es JH, Kuipers J, Kujala P, van den BM, Cozijnsen M,
Haegebarth A, Korving J, Begthel H, Peters PJ, and Clevers H. Identification of stem cells in small intestine and colon by marker gene Lgr5. Nature 449: 1003-1007, 2007.
6. Barker N, van de WM, and Clevers H. The intestinal stem cell. Genes &
Development 22: 1856-1864, 2008.
7. Potten CS. Stem cells in gastrointestinal epithelium: numbers, characteristics and
death. PhilosTransRSocLond B BiolSci 353: 821-830, 1998.
8. Sangiorgi E, and Capecchi MR. Bmi1 is expressed in vivo in intestinal stem
cells. Nature Genetics 40: 915-920, 2008.
9. Breault DT, Min IM, Carlone DL, Farilla LG, Ambruzs DM, Henderson DE,
5
10. Takeda N, Jain R, LeBoeuf MR, Wang QH, Lu MM, and Epstein JA.
Interconversion Between Intestinal Stem Cell Populations in Distinct Niches. Science
334: 1420-1424, 2011.
11. Powell AE, Wang Y, Li Y, Poulin EJ, Means AL, Washington MK,
Higginbotham JN, Juchheim A, Prasad N, Levy SE, Guo Y, Shyr Y, Aronow BJ, Haigis KM, Franklin JL, and Coffey RJ. The pan-ErbB negative regulator Lrig1 is an intestinal stem cell marker that functions as a tumor suppressor. Cell 149: 146-158, 2012.
12. Montgomery RK, Carlone DL, Richmond CA, Farilla L, Kranendonk MEG,
Henderson DE, Baffour-Awuah NY, Ambruzs DM, Fogli LK, Algra S, and Breault DT. Mouse telomerase reverse transcriptase (mTert) expression marks slowly cycling intestinal stem cells. Proceedings of the National Academy of Sciences of the United States of America 108: 179-184, 2011.
13. Yan KS, Chia LA, Li X, Ootani A, Su J, Lee JY, Su N, Luo Y, Heilshorn SC,
Amieva MR, Sangiorgi E, Capecchi MR, and Kuo CJ. The intestinal stem cell markers Bmi1 and Lgr5 identify two functionally distinct populations. Proc Natl Acad Sci U S A 109: 466-471, 2012.
14. Tian H, Biehs B, Warming S, Leong KG, Rangell L, Klein OD, and de
Sauvage FJ. A reserve stem cell population in small intestine renders Lgr5-positive cells dispensable. Nature 478: 255-259, 2011.
15. Munoz J, Stange DE, Schepers AG, van de Wetering M, Koo BK, Itzkovitz S,
Volckmann R, Kung KS, Koster J, Radulescu S, Myant K, Versteeg R, Sansom OJ, van Es JH, Barker N, van Oudenaarden A, Mohammed S, Heck AJ, and Clevers H. The Lgr5 intestinal stem cell signature: robust expression of proposed quiescent '+4' cell markers. The EMBO journal 31: 3079-3091, 2012.
16. van Es JH, Sato T, van de Wetering M, Lyubimova A, Nee AN, Gregorieff A,
Sasaki N, Zeinstra L, van den Born M, Korving J, Martens AC, Barker N, van Oudenaarden A, and Clevers H. Dll1+ secretory progenitor cells revert to stem cells upon crypt damage. Nat Cell Biol 14: 1099-1104, 2012.
17. Buczacki SJ, Zecchini HI, Nicholson AM, Russell R, Vermeulen L, Kemp R,
and Winton DJ. Intestinal label-retaining cells are secretory precursors expressing Lgr5.
6
18. Roth S, Franken P, Sacchetti A, Kremer A, Anderson K, Sansom O, and
Fodde R. Paneth cells in intestinal homeostasis and tissue injury. PLoS One 7: e38965, 2012.
19. Van Landeghem L, Santoro MA, Krebs AE, Mah AT, Dehmer JJ, Gracz AD,
Scull BP, McNaughton K, Magness ST, and Lund PK. Activation of two distinct Sox9-EGFP-expressing intestinal stem cell populations during crypt regeneration after irradiation. Am J Physiol Gastrointest Liver Physiol 302: 1111-1132, 2012.
20. Gerbe F, Brulin B, Makrini L, Legraverend C, and Jay P. DCAMKL-1
Expression Identifies Tuft Cells Rather Than Stem Cells in the Adult Mouse Intestinal Epithelium. Gastroenterology 137: 2179-2180, 2009.
21. von Furstenberg RJ, Gulati AS, Baxi A, Doherty JM, Stappenbeck TS, Gracz
AD, Magness ST, and Henning SJ. Sorting mouse jejunal epithelial cells with CD24 yields a population with characteristics of intestinal stem cells. AmJPhysiol
GastrointestLiver Physiol 300: G409-G417, 2011.
22. Wong VWY, Stange DE, Page ME, Buczacki S, Wabik A, Itami S, van de
Wetering M, Poulsom R, Wright NA, Trotter MWB, Watt FM, Winton DJ, Clevers H, and Jensen KB. Lrig1 controls intestinal stem-cell homeostasis by negative
regulation of ErbB signalling. Nat Cell Biol 14: 401-408, 2012.
23. Challen GA, and Little MH. A side order of stem cells: the SP phenotype. Stem
Cells 24: 3-12, 2006.
24. Dekaney CM, Rodriguez JM, Graul MC, and Henning SJ. Isolation and
characterization of a putative intestinal stem cell fraction from mouse jejunum.
Gastroenterology 129: 1567-1580, 2005.
25. Gulati AS, Ochsner SA, and Henning SJ. Molecular properties of side
CHAPTER 2
METHODS AND MATERIALS
MICE
WT adult male C57BL/6J mice and heterozygote breeder pairs of Lgr5-EGFP-IRES-creERT2 (called Lgr5-EGFP from here on) mice were obtained from The Jackson Laboratories (Bar Harbor, ME), and housed under a 12:12-h light-dark cycle in American Association for Accreditation of Laboratory Animal Care-approved facilities. All animals were used within the age range of 6-8 weeks. All WT and Lgr5-EGFP animal usage had Institutional Animal Care and Use Committee approval.
CELL PREPARATION AND SP STAINING AND ANALYSIS
Epithelial cells were isolated from the jejunum of WT and Lgr5-EGFP mice using our previous published EDTA method.21 For SP analysis, cells from the preparation were incubated in “SP buffer” made with 2% FBS, and 10mM HEPES in HBSS and either Hoechst 33342 (10ug/ml equal to 17µM) (Sigma) or Vybrant DyeCycle Violet (DCV) 10µM (Invitrogen) for 90min at 37°C. Following the incubation the cells were washed with ice cold HBSS and labeled with CD45-FITC (Biolegend) at 0.5ug/106 cells and propidium iodide (PI) at 1µg/ml for removal of cells that were dead and/or of
8
were pre-incubated with 100µM verapamil for 20min at 37°C and incubated with the above SP solution for 90min at 37°C with the addition of 100µM verapamil. To generate the SP fluorescent phenotype Hoechst 33342 samples were excited using a UV laser (Dako MoFlo) while DCV samples were excited using a 405nm laser (Dako CyAn and BD LSRII). Corresponding band-pass filter sets were: Dako MoFlo (blue 450-50, red 670-30), Dako CyAn (blue 450-50, red 680-20), and BD LSRII (blue 450-50, red 660-20). On each machine, the SP was defined on the redlo population which was eliminated by verapamil (Figure 1). For analyses and cell collections, the SP was subdivided into two regions: upper SP (USP), and lower SP (LSP).
SP AND EdU S PHASE ANALYSIS
WT mice were injected intraperitoneally with 100µg EdU in PBS, and sacrificed 1h post-injection. The jejunum was harvested and epithelial cells were isolated, labeled for SP analysis (Hoechst) as mentioned above, and the sub-populations of the SP
phenotype (LSP and USP) were collected using a Dako MoFlo cell sorter. The LSP and USP cell collections were then processed for EdU detection using the Click-it kit
9
SP AND LGR5-EGFP TRACKING
Lgr5-EGFP+/- mice were sacrificed, and jejunal epithelial cells isolated. The cells were incubated and labeled for SP analysis (DCV) as described above. The cells were then analyzed using the Dako CyAn to detect both SP fluorescence as well Lgr5-EGFP signal from the same sample. Summit 4.2 software was used to track the Lgr5-EGFPhi cells with respect to their SP phenotype.
qRT-PCR OF SP SUBPOPULATIONS
LSP and USP were collected into lysis buffer and RNA isolated using the
RNAqueous-Micro kit (Ambion). cDNA was generated using the High Capacity cDNA Reverse Transcription Kit (Applied Biosystems). Quantitative reverse transcriptase PCR (qRT-PCR) was conducted for each sample in triplicate. Taqman probes (Actb,
Mm00607939_s1; Dclk1, Mm00444950_m1; Lgr5, Mm00438890_m1; Lrig1, Mm00456116_m1; mTert, Mm00436931_m1; Ascl2, Mm01268891_g1; Olfm4, Mm01320260_1; Bmi1 Mm03053308_g1; Hopx, Mm00558630_m1; SI,
Mm01210305_m1; Lyz, Mm00727183_s1; ChgA Mm00514341_m1; Muc2,
10
B-Actin RNA was used as an internal control due to its similar Ct threshold values between USP and LSP when the same number of cells were collected: difference in ² -Actin threshold Ct’s of USP and LSP for 100,000 cells each = 0.18±0.48 (expressed as mean ± SEM), n=3. ” ” Ct (cycle threshold) values were calculated to obtain fold changes vs. pooled intact jejunum (WT C57BL6J male 7wk old mice).
QUANTIFICATION OF ENTEROENDOCRINE CELLS IN THE LOWER SP
11 REFERENCES
21. von Furstenberg RJ, Gulati AS, Baxi A, Doherty JM, Stappenbeck TS, Gracz
AD, Magness ST, and Henning SJ. Sorting mouse jejunal epithelial cells with CD24 yields a population with characteristics of intestinal stem cells. AmJPhysiol
GastrointestLiver Physiol 300: G409-G417, 2011.
26. Bjerknes M, and Cheng H. Cell Lineage metastability in Gfi1-deficient mouse
CHAPTER 3
S PHASE ANALYSIS OF SIDE POPULATION
CHAPTER 4
UPPER SP CONTAINS ACTIVE INTESTINAL STEM CELL
Since Lgr5 is a commonly used marker of actively cycling ISCs, Lgr5-EGFP mice were used to assess the distribution of Lgr5+ cells between the USP and the LSP. To this end, following the SP analysis of intestinal epithelial cells from Lgr5-EGFP mice (Figure 3A), the Lgr5-EGFPhi fraction was gated forward onto an SP plot (Figure 3B), with SP sub-population gates based on a standard SP sample of all cells from the same mouse. Supporting the S phase data from the EdU experiment, 96 ± 2% of the Lgr5-EGFPhi cells tracked to the USP gate (Figure 3C). Quantitation of the actual
14 REFERENCES
21. von Furstenberg RJ, Gulati AS, Baxi A, Doherty JM, Stappenbeck TS, Gracz
AD, Magness ST, and Henning SJ. Sorting mouse jejunal epithelial cells with CD24 yields a population with characteristics of intestinal stem cells. AmJPhysiol
CHAPTER 5
TRANSCRIPT ANALYSIS OF UPPER AND LOWER SP
The experiments to this point suggest that the actively cycling ISC are restricted to the USP. To explore the transcriptional profile of the SP sub-populations, I utilized qRT-PCR and primer/probes for active and quiescent ISC markers. Additionally I used primer/probes for the four intestinal lineages to give some insight into the non-stem cell makeup of the SP sub-populations.
qRT-PCR OF INTESTINAL STEM CELL mRNA MARKERS
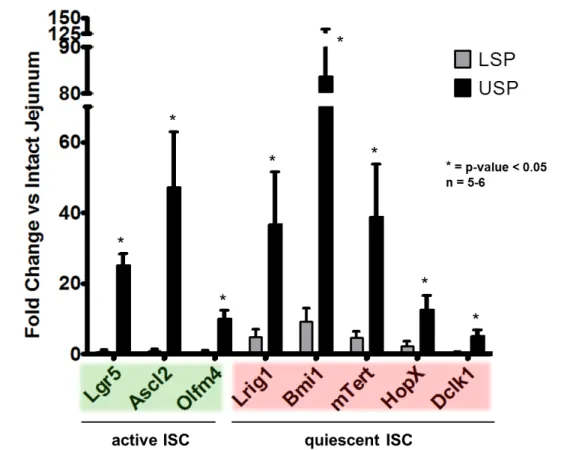
As expected from the EdU analysis and Lgr5-EGFPhi cell tracking experiments, the USP was enriched in all active ISC markers examined, specifically: Lgr5 (25 ± 3), Ascl2 (47 ± 16), and Olfm4 (10 ± 2), (Figure 4). The quiescent ISC associated transcripts were enriched as well: Lrig1 (37 ± 15), Bmi1 (84 ± 15), mTert (39 ± 15), Hopx (13 ± 4), and
Dclk1 (5 ± 2).
16
statistical significance, Lrig1 (4.8 ± 2.2), Bmi1 (9.2 ± 3.9). Dclk1 (0.5 ± 0.3), the q-ISC/tuft cell marker was de-enriched.
Interestingly, markers associated with quiescence (Lrig1, Bmi1, mTert, HopX, and
Dclk1) were also enriched in the USP compared to intact jejunum. This is in agreement with the finding by Munoz et al. that the Lgr5+ cells contain both transcriptional profiles (active/quiescent).15 Notably the LSP was void of active ISC markers and enriched for quiescent ISC markers.
qRT-PCR OF LINEAGE mRNA MARKERS
In regard to lineage positive cells (Figure 5) the USP was enriched in Muc2 (4.0 ± 1.0), Lyz (23 ± 8), ChgA (6.3 ± 1.7), and Syp (3.3 ± 1.5) transcripts while de-enriched for
17 REFERENCES
15. Munoz J, Stange DE, Schepers AG, van de Wetering M, Koo BK, Itzkovitz S,
CHAPTER 6
ENTEROENDOCRINE CELL QUANTIFICATION
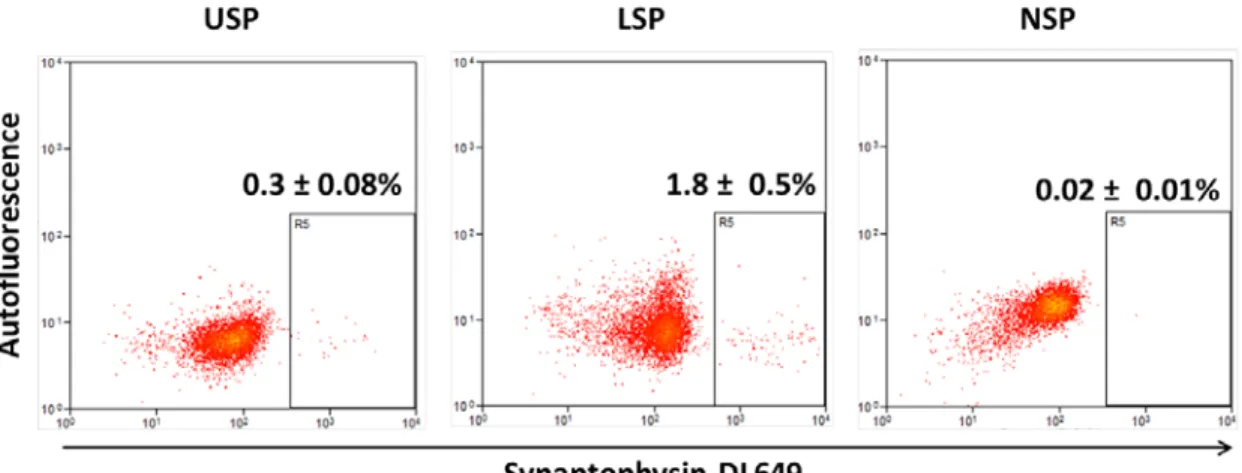
In light of recent publications from Sei et al. and Van Landeghem et al., that a subset of EE cells have ISC potential, I felt it was important to investigate the possibility that the LSP was selecting for this EE subset.27,19 To directly assess the number of EE cells in the SP regions I opted to collect USP and LSP cells from WT mice and reanalyze by permeablizing the cells and labeling with an antibody against the EE marker Syp. The resulting analysis showed less than 2% of the LSP to be Syp positive indicating the LSP is likely a different population (Figure 6). To validate the pan-EE specificity of the Syp antibody I tested it against intestinal epithelial cells isolated from the PYY-GFP mouse, developed by Bohorquez et al., in which the peptide-YY producing subset of EE cells express GFP.28 Our resulting flow analysis demonstrated that almost all PYY-GFP cells were also Syp positive (Figure 7). The ability of a committed secretory progenitor to revert back to a stem cell phenotype following damage has been recently demonstrated by van Es et al. in the case of the Dll1hi cell and the characterization of the H2B-LRC secretory progenitor by Buczacki et al.16,17 However I did not find significant expression of Dll1 or Atoh1 mRNA in the LSP (data not shown). Thus, under homeostatic
19
REFERENCES
16. van Es JH, Sato T, van de Wetering M, Lyubimova A, Nee AN, Gregorieff A,
Sasaki N, Zeinstra L, van den Born M, Korving J, Martens AC, Barker N, van Oudenaarden A, and Clevers H. Dll1+ secretory progenitor cells revert to stem cells upon crypt damage. Nat Cell Biol 14: 1099-1104, 2012.
17. Buczacki SJ, Zecchini HI, Nicholson AM, Russell R, Vermeulen L, Kemp R,
and Winton DJ. Intestinal label-retaining cells are secretory precursors expressing Lgr5.
Nature 495: 65-69, 2013.
19. Van Landeghem L, Santoro MA, Krebs AE, Mah AT, Dehmer JJ, Gracz AD,
Scull BP, McNaughton K, Magness ST, and Lund PK. Activation of two distinct Sox9-EGFP-expressing intestinal stem cell populations during crypt regeneration after irradiation. Am J Physiol Gastrointest Liver Physiol 302: 1111-1132, 2012.
27. Sei Y, Lu X, Liou A, Zhao X, and Wank SA. A stem cell marker-expressing
subset of enteroendocrine cells resides at the crypt base in the small intestine. Am J Physiol Gastrointest Liver Physiol 300: G345-356, 2011.
28. Bohorquez DV, Chandra R, Samsa LA, Vigna SR, and Liddle RA.
Characterization of basal pseudopod-like processes in ileal and colonic PYY cells.
CONCLUSION
This paper reports the use of SP sorting to successfully isolate two phenotypically different putative ISC populations from WT mice. Most notable is the near 100 fold difference in the percentage of cells undergoing S phase when comparing the USP to the LSP. I demonstrated that Lgr5-EGFPhi cells, which represent the active ISC, were found to reside in the USP when tracked on the SP plot. Upon sorting and processing the USP and LSP for mRNA analysis, I found differing transcriptional profiles via qRT-PCR. In support of the notion that the LSP is characteristic of the quiescent ISC pool, mRNA markers associated with quiescent ISC were enriched, while those of the active ISC were de-enriched. The LSP, otherwise free from lineage transcripts, displayed a high level of
ChgA mRNA. To evaluate the possibility that the LSP contained a significant proportion of EE cells, I collected the LSP along with the USP and labeled the cells with anti-Syp antibody. Less than 2% of the LSP was positive for the widely reported pan-EE marker Syp.18,16 This finding exemplifies the caution by that transcript levels, especially from secretory cells, are not necessarily indicative of cell number.29
21
protein1 (Bcrp1) which work in concert to eliminate a DNA binding dye such as Hoechst 33342 or DyeCycle Violet.23,30 Despite this efflux some amount of dye does bind to the DNA and resulting fluorescence is an index of DNA content and allows for
discrimination of cell cycle activity.23 The interpretation of cell cycle activity/ DNA content from SP has been demonstrated by both Goodell et al. and Petriz et al. with bone marrow cells and yielded plots analogous to the patterning seen in intestine when
visualized using lower signal amplification of the vital dye emission than we had in 2005.31,32 Adapting these instrument settings I could now interpret an additional effluxing population (USP) above the traditional SP (now LSP) illustrated in the 2005 publication from our group.24 This “upper SP” region was in an orientation much like the published S-G2M phase cells which exist, spatially, above the SP along the Hoechst blue axis. Confirming this, I found the USP to be highly enriched in cells which incorporated EdU following a 1h pulse when compared to the LSP.
22
Next I evaluated the transcriptional profiles of the USP and LSP in terms of ISC genes (quiescent and active) as well as genetic markers of the committed lineages. As expected from the Lgr5-EGFPhi tracking experiment I found an enrichment of Lgr5,
Ascl2, and Olfm4 in the USP. Interestingly, markers associated with quiescence (Lrig1,
Bmi1, mTert, HopX, and Dclk1) were also enriched in the USP compared to intact jejunum. This is in agreement with the findings of that the Lgr5+ cells contain both transcriptional profiles (active/quiescent).15 The LSP in contrast expressed only the quiescent ISC markers (Lrig1, Bmi1, mTert, and HopX) at levels above intact jejunum, and were de-enriched for a-ISC transcripts (Lgr5, Ascl2, and Olfm4). With regard to lineage contamination of the USP, the levels of Lyz, Muc2, and EE transcripts were increased over intact jejunum. LSP however was relatively free from contaminating lineage markers with the exception of the EE marker ChgA.
23
damage has been recently demonstrated as in the case of the Dll1hi cell and the H2B-LRC secretory progenitor.16,17 However I did not find significant expression of Dll1 or Atoh1
mRNA in the LSP.
A recent study that has strengthened the link between intestinal SP and ISC is an inducible Abcg2-LacZ mouse model allowing for lineage tracing.33 Previously
mentioned as one of the vital dye effluxers, Abcg2 has been demonstrated to be the most critical to the SP phenotype in bone marrow, essentially eliminating the SP population when the breast cancer resistance protein 1 (Bcrp1) the mouse homolog of Abcg2 was knocked out.34 Fatima et al. tamoxifen treated adult Abcg2CreERT2/+RosaLacZ/+ and found 50% of the crypts and associated villi stained positive for LacZ one month afterward, with some crypts/villi remaining blue out to 21 months. This suggests that intestinal ISC of varying lifespan express Abcg2. The division of the SP into an upper and lower portion with respective active and quiescent phenotypes is a concept already applied in the hematopoietic stem field identified a USP and LSP among HSC’s, with the USP representing a more proliferative HSC with a shorter lifespan and the LSP exhibiting quiescence, longer life span, and responsive to TGF-² 1 stimulation. In their study the LSP exhibited a higher engraftment rate and contribution to peripheral blood regeneration than the USP when transplanted into lethally irradiated mice.35 While these studies from the HSC field are encouraging, there is still a significant gap to close in our
24
25 REFERENCES
13. Yan KS, Chia LA, Li X, Ootani A, Su J, Lee JY, Su N, Luo Y, Heilshorn SC,
Amieva MR, Sangiorgi E, Capecchi MR, and Kuo CJ. The intestinal stem cell markers Bmi1 and Lgr5 identify two functionally distinct populations. Proc Natl Acad Sci U S A 109: 466-471, 2012.
15. Munoz J, Stange DE, Schepers AG, van de Wetering M, Koo BK, Itzkovitz S,
Volckmann R, Kung KS, Koster J, Radulescu S, Myant K, Versteeg R, Sansom OJ, van Es JH, Barker N, van Oudenaarden A, Mohammed S, Heck AJ, and Clevers H. The Lgr5 intestinal stem cell signature: robust expression of proposed quiescent '+4' cell markers. The EMBO journal 31: 3079-3091, 2012.
16. van Es JH, Sato T, van de Wetering M, Lyubimova A, Nee AN, Gregorieff A,
Sasaki N, Zeinstra L, van den Born M, Korving J, Martens AC, Barker N, van Oudenaarden A, and Clevers H. Dll1+ secretory progenitor cells revert to stem cells upon crypt damage. Nat Cell Biol 14: 1099-1104, 2012.
17. Buczacki SJ, Zecchini HI, Nicholson AM, Russell R, Vermeulen L, Kemp R,
and Winton DJ. Intestinal label-retaining cells are secretory precursors expressing Lgr5.
Nature 495: 65-69, 2013.
18. Roth S, Franken P, Sacchetti A, Kremer A, Anderson K, Sansom O, and
Fodde R. Paneth cells in intestinal homeostasis and tissue injury. PLoS One 7: e38965, 2012.
19. Van Landeghem L, Santoro MA, Krebs AE, Mah AT, Dehmer JJ, Gracz AD,
Scull BP, McNaughton K, Magness ST, and Lund PK. Activation of two distinct Sox9-EGFP-expressing intestinal stem cell populations during crypt regeneration after irradiation. Am J Physiol Gastrointest Liver Physiol 302: 1111-1132, 2012.
23. Challen GA, and Little MH. A side order of stem cells: the SP phenotype. Stem
Cells 24: 3-12, 2006.
24. Dekaney CM, Rodriguez JM, Graul MC, and Henning SJ. Isolation and
characterization of a putative intestinal stem cell fraction from mouse jejunum.
26
27. Sei Y, Lu X, Liou A, Zhao X, and Wank SA. A stem cell marker-expressing
subset of enteroendocrine cells resides at the crypt base in the small intestine. Am J Physiol Gastrointest Liver Physiol 300: G345-356, 2011.
29. Dehmer JJ, Garrison AP, Speck KE, Dekaney CM, Van Landeghem L, Sun
X, Henning SJ, and Helmrath MA. Expansion of intestinal epithelial stem cells during murine development. PLoS One 6: e27070, 2011.
30. Telford WG, Bradford J, Godfrey W, Robey RW, and Bates SE. Side
population analysis using a violet-excited cell-permeable DNA binding dye. Stem Cells
25: 1029-1036, 2007.
31. Goodell MA. Stem cell identification and sorting using the Hoechst 33342 side
population (SP). Current protocols in cytometry / editorial board, J Paul Robinson, managing editor [et al] Chapter 9: Unit9 18, 2005.
32. Petriz J. Flow cytometry of the side population (SP). Current protocols in
cytometry / editorial board, J Paul Robinson, managing editor [et al] Chapter 9: Unit9 23, 2007.
33. Fatima S, Zhou S, and Sorrentino BP. Abcg2 expression marks tissue-specific
stem cells in multiple organs in a mouse progeny tracking model. Stem Cells 30: 210-221, 2012.
34. Zhou S, Morris JJ, Barnes Y, Lan L, Schuetz JD, and Sorrentino BP. Bcrp1
gene expression is required for normal numbers of side population stem cells in mice, and confers relative protection to mitoxantrone in hematopoietic cells in vivo. Proc Natl Acad Sci U S A 99: 12339-12344, 2002.
35. Challen GA, Boles NC, Chambers SM, and Goodell MA. Distinct
27
28
29
30
Figure 4. RT-PCR analysis of active and quiescent ISC mRNA markers from USP and LSP. Data are shown as fold change vs. intact jejunum. LSP (gray) fold changes are as follows Lgr5 (0.7 ± 0.5), Ascl2 (0.9 ± 0.6), and Olfm4 (0.6 ± 0.5). Several quiescent ISC markers were analyzed: Lrig1 (4.8 ± 2.2), Bmi1 (9.2 ± 3.9), mTert (4.8 ± 1.6), Hopx (2.3 ± 1.3); while Dclk1 (0.5 ± 0.3) was de-enriched. The USP (black) was analyzed for the following active ISC markers: Lgr5 (25 ± 3), Ascl2 (47 ± 16), and Olfm4 (10 ± 2). The quiescent ISC associated transcripts examined were: Lrig1 (37 ± 15), Bmi1 (84 ± 48),
31
Figure 5. RT-PCR analysis of intestinal lineage mRNA markers from USP and LSP. Data are shown as fold change vs. intact jejunum. LSP (gray) was analyzed for the following markers SI (1.2 ± 0.1), Lyz (1.0 ± 0.9), Muc2 (2.7 ± 1.9), ChgA (17 ± 7) and
Syp (4.1 ± 2.0). The same marker examination of USP (black) yielded: SI (0.4 ± 0.1),
32
33
34 REFERENCES
1. Cheng H, and Leblond CP. Origin, differentiation and renewal of the four main
epithelial cell types in the mouse small intestine. V. Unitarian theory of the origin of the four epithelial cell types. American Journal of Anatomy 141: 537-562, 1974.
2. Noah TK, Donahue B, and Shroyer NF. Intestinal development and
differentiation. Exp Cell Res 317: 2702-2710, 2011.
3. Sato T, van Es JH, Snippert HJ, Stange DE, Vries RG, van den Born M,
Barker N, Shroyer NF, van de Wetering M, and Clevers H. Paneth cells constitute the niche for Lgr5 stem cells in intestinal crypts. Nature 469: 415-+, 2011.
4. Potten CS, Owen G, and Booth D. Intestinal stem cells protect their genome by
selective segregation of template DNA strands. Journal of Cell Science 115: 2381-2388, 2002.
5. Barker N, van Es JH, Kuipers J, Kujala P, van den BM, Cozijnsen M,
Haegebarth A, Korving J, Begthel H, Peters PJ, and Clevers H. Identification of stem cells in small intestine and colon by marker gene Lgr5. Nature 449: 1003-1007, 2007.
6. Barker N, van de WM, and Clevers H. The intestinal stem cell. Genes &
Development 22: 1856-1864, 2008.
7. Potten CS. Stem cells in gastrointestinal epithelium: numbers, characteristics and
death. PhilosTransRSocLond B BiolSci 353: 821-830, 1998.
8. Sangiorgi E, and Capecchi MR. Bmi1 is expressed in vivo in intestinal stem
cells. Nature Genetics 40: 915-920, 2008.
9. Breault DT, Min IM, Carlone DL, Farilla LG, Ambruzs DM, Henderson DE,
Algra S, Montgomery RK, Wagers AJ, and Hole N. Generation of mTert-GFP mice as a model to identify and study tissue progenitor cells. ProcNatlAcadSciUSA 105: 10420-10425, 2008.
10. Takeda N, Jain R, LeBoeuf MR, Wang QH, Lu MM, and Epstein JA.
Interconversion Between Intestinal Stem Cell Populations in Distinct Niches. Science
35
11. Powell AE, Wang Y, Li Y, Poulin EJ, Means AL, Washington MK,
Higginbotham JN, Juchheim A, Prasad N, Levy SE, Guo Y, Shyr Y, Aronow BJ, Haigis KM, Franklin JL, and Coffey RJ. The pan-ErbB negative regulator Lrig1 is an intestinal stem cell marker that functions as a tumor suppressor. Cell 149: 146-158, 2012.
12. Montgomery RK, Carlone DL, Richmond CA, Farilla L, Kranendonk MEG,
Henderson DE, Baffour-Awuah NY, Ambruzs DM, Fogli LK, Algra S, and Breault DT. Mouse telomerase reverse transcriptase (mTert) expression marks slowly cycling intestinal stem cells. Proceedings of the National Academy of Sciences of the United States of America 108: 179-184, 2011.
13. Yan KS, Chia LA, Li X, Ootani A, Su J, Lee JY, Su N, Luo Y, Heilshorn SC,
Amieva MR, Sangiorgi E, Capecchi MR, and Kuo CJ. The intestinal stem cell markers Bmi1 and Lgr5 identify two functionally distinct populations. Proc Natl Acad Sci U S A 109: 466-471, 2012.
14. Tian H, Biehs B, Warming S, Leong KG, Rangell L, Klein OD, and de
Sauvage FJ. A reserve stem cell population in small intestine renders Lgr5-positive cells dispensable. Nature 478: 255-259, 2011.
15. Munoz J, Stange DE, Schepers AG, van de Wetering M, Koo BK, Itzkovitz S,
Volckmann R, Kung KS, Koster J, Radulescu S, Myant K, Versteeg R, Sansom OJ, van Es JH, Barker N, van Oudenaarden A, Mohammed S, Heck AJ, and Clevers H. The Lgr5 intestinal stem cell signature: robust expression of proposed quiescent '+4' cell markers. The EMBO journal 31: 3079-3091, 2012.
16. van Es JH, Sato T, van de Wetering M, Lyubimova A, Nee AN, Gregorieff A,
Sasaki N, Zeinstra L, van den Born M, Korving J, Martens AC, Barker N, van Oudenaarden A, and Clevers H. Dll1+ secretory progenitor cells revert to stem cells upon crypt damage. Nat Cell Biol 14: 1099-1104, 2012.
17. Buczacki SJ, Zecchini HI, Nicholson AM, Russell R, Vermeulen L, Kemp R,
and Winton DJ. Intestinal label-retaining cells are secretory precursors expressing Lgr5.
Nature 495: 65-69, 2013.
18. Roth S, Franken P, Sacchetti A, Kremer A, Anderson K, Sansom O, and
Fodde R. Paneth cells in intestinal homeostasis and tissue injury. PLoS One 7: e38965, 2012.
19. Van Landeghem L, Santoro MA, Krebs AE, Mah AT, Dehmer JJ, Gracz AD,
36
Sox9-EGFP-expressing intestinal stem cell populations during crypt regeneration after irradiation. Am J Physiol Gastrointest Liver Physiol 302: 1111-1132, 2012.
20. Gerbe F, Brulin B, Makrini L, Legraverend C, and Jay P. DCAMKL-1
Expression Identifies Tuft Cells Rather Than Stem Cells in the Adult Mouse Intestinal Epithelium. Gastroenterology 137: 2179-2180, 2009.
21. von Furstenberg RJ, Gulati AS, Baxi A, Doherty JM, Stappenbeck TS, Gracz
AD, Magness ST, and Henning SJ. Sorting mouse jejunal epithelial cells with CD24 yields a population with characteristics of intestinal stem cells. AmJPhysiol
GastrointestLiver Physiol 300: G409-G417, 2011.
22. Wong VWY, Stange DE, Page ME, Buczacki S, Wabik A, Itami S, van de
Wetering M, Poulsom R, Wright NA, Trotter MWB, Watt FM, Winton DJ, Clevers H, and Jensen KB. Lrig1 controls intestinal stem-cell homeostasis by negative
regulation of ErbB signalling. Nat Cell Biol 14: 401-408, 2012.
23. Challen GA, and Little MH. A side order of stem cells: the SP phenotype. Stem
Cells 24: 3-12, 2006.
24. Dekaney CM, Rodriguez JM, Graul MC, and Henning SJ. Isolation and
characterization of a putative intestinal stem cell fraction from mouse jejunum.
Gastroenterology 129: 1567-1580, 2005.
25. Gulati AS, Ochsner SA, and Henning SJ. Molecular properties of side
population-sorted cells from mouse small intestine. AmJPhysiol GastrointestLiver Physiol 294: G286-G294, 2008.
26. Bjerknes M, and Cheng H. Cell Lineage metastability in Gfi1-deficient mouse
intestinal epithelium. Dev Biol 345: 49-63, 2010.
27. Sei Y, Lu X, Liou A, Zhao X, and Wank SA. A stem cell marker-expressing
subset of enteroendocrine cells resides at the crypt base in the small intestine. Am J Physiol Gastrointest Liver Physiol 300: G345-356, 2011.
28. Bohorquez DV, Chandra R, Samsa LA, Vigna SR, and Liddle RA.
Characterization of basal pseudopod-like processes in ileal and colonic PYY cells.
37
29. Dehmer JJ, Garrison AP, Speck KE, Dekaney CM, Van Landeghem L, Sun
X, Henning SJ, and Helmrath MA. Expansion of intestinal epithelial stem cells during murine development. PLoS One 6: e27070, 2011.
30. Telford WG, Bradford J, Godfrey W, Robey RW, and Bates SE. Side
population analysis using a violet-excited cell-permeable DNA binding dye. Stem Cells
25: 1029-1036, 2007.
31. Goodell MA. Stem cell identification and sorting using the Hoechst 33342 side
population (SP). Current protocols in cytometry / editorial board, J Paul Robinson, managing editor [et al] Chapter 9: Unit9 18, 2005.
32. Petriz J. Flow cytometry of the side population (SP). Current protocols in
cytometry / editorial board, J Paul Robinson, managing editor [et al] Chapter 9: Unit9 23, 2007.
33. Fatima S, Zhou S, and Sorrentino BP. Abcg2 expression marks tissue-specific
stem cells in multiple organs in a mouse progeny tracking model. Stem Cells 30: 210-221, 2012.
34. Zhou S, Morris JJ, Barnes Y, Lan L, Schuetz JD, and Sorrentino BP. Bcrp1
gene expression is required for normal numbers of side population stem cells in mice, and confers relative protection to mitoxantrone in hematopoietic cells in vivo. Proc Natl Acad Sci U S A 99: 12339-12344, 2002.
35. Challen GA, Boles NC, Chambers SM, and Goodell MA. Distinct