Predicting conservation behavior
The role of a sense of connection to animals and place
attachment to the zoo
Svenja Jahn
Master thesis Psychology, specialization Economic and Consumer Psychology Institute of Psychology
Faculty of Social and Behavioral Sciences – Leiden University Date: 20-08-2018
Student number: 2085917
First examiner of the university: Henk Staats
Table of Contents
Abstract………..4
Introduction………...4
1. Literature Review……….6
1.1 Zoo members and conservation behavior..………..6
1.2 Place attachment, sense of connection to animals and conservation behavior……….7
2. Method.………11
2.1 Procedure & Participants……….11
2.2 Measures………12
2.2.1 Demographic Information……….12
2.2.2 Visit-motivation identity………13
2.2.3 Sense of connection to animals………..………14
2.2.4 Place attachment………15
2.2.5 Conservation behavior………...15
2.3 Analyses………..16
3. Results………..16
3.1 Visit-Motivation Identity and Conservation Behavior………..16
3.2 Visit-Motivation Identity, Place Attachment and Sense of Connection to Animals...22
3.3 Place Attachment and Sense of Connection: Predictors of Conservation Behavior...24
3.4 The Relationship Between Sense of Connection to Animals and Place Attachment..26
3.5 Predictors of Place Attachment and Sense of Connection to Animals……….26
3.6 Testing the Overall Model (Mediation Analyses)………...28
4. Discussion……….34
Acknowledgements………..38
Abstract
One of the main goals of a zoo is to promote conservation behavior. Two constructs that are
relevant in the context of a zoo and that seem to have a positive relationship with conservation
behavior are feeling a sense of connection to animals and place attachment. In this study it
was analysed if there was a relationship between having a sense of connection to animals
and/or place attachment, and performing conservation behavior. A sample of 835 subscription
holders to a Dutch urban zoo was used. Also it was investigated which characteristics of those
subscription holders could explain these two constructs (e.g. visit motivation). Next to this a
mediation analysis was performed to test the overall model. It was found that sense of
connection to animals and place identity (a component of place attachment) could predict
conservation behavior. It was also found that the relationship between visit intensity and
conservation behavior could be mediated by sense of connection to animals and place
identity, indicating that offering visitors a more intense visit might make them behave more
environmental friendly eventually.
Introduction
Biodiversity refers to the variety of life forms within a given ecosystem, which is often
used as an indicator for the health of an ecosystem. Human actions are causing a biodiversity
crisis, with extinction rates up to 1000 times higher than their pre-human levels (Pimm,
Russell, Gittleman & Brooks, 1995). Living in an urbanized environment can make it hard
sometimes to see the causes and consequences of the biodiversity crisis (Grajal et al., 2017).
Experiencing a connection to nature or to animals may increase awareness of the problem
(Clayton, Luebke, Saunders, Matiasek, & Grajal, 2014). For many people, the zoo may be the
only place to experience a diversity of exotic live animals, so this might be a very suitable
situation where people can establish a connection to nature and/or animals. The goal of many
zoos is indeed to promote knowledge about nature conservation and sustainability, which they
try to achieve by showing species in their natural habitats and by providing information
(Patrick, Matthews, Ayer & Tunnicliffe, 2007). In this way they hope to motivate people to
perform more nature conservation behavior in the zoo as well as at home. Conservation
behavior, a term often interchangeably used with environmental behavior, consists of a broad
range of behaviors. As argued by Eilam and Trop (2012), the term behavior is mostly
context of environmental behavior, one could think of two ‘types’ of behavior as mentioned
by Gifford (2013). The first type concerns behavior people do with the intention to mitigate
environmental issues, and thus is considered to be pro-environmental by the person who
performs the behavior. The second type is behavior which people perform that is helping the
environment without intending to; for example people who cycle for health reasons or remain
childless by choice. Overall, environmental behaviors cover different domains, and can range
from easy to more difficult behaviors (Schultz et al., 2005). Some examples are reducing,
reusing, and recycling material; joining or supporting a (volunteer) group that promotes
conservation behavior; spreading messages about conservation; and buying green products
(Smith, 2009). Behaviors like these can take place during the zoo visit, as well as when the
visitors are back home again.
Two constructs that seem to have a positive relationship with conservation behavior,
and that are relevant in the context of zoos, are feeling a sense of connection towards animals
and feeling a sense of attachment towards the zoo, also known as place attachment. Research
by Grajal et al. (2017) has found a direct relationship between sense of connection to animals
and self-reported pro-environmental behaviors by zoo visitors. Also place attachment may
have a positive relationship with conservation behavior, although this might depend on the
type of place attachment. Scannell and Gifford (2010) for example found that only those who
felt attached to a place because of its environmental-physical assets (i.e. natural place
attachment) were more willing to perform environment-protecting behaviors. Therefore it is
worth to investigate whether this relationship also holds true or is different for a place that is
relatively seldom investigated in terms of place attachment, the zoo.
The aim of the current research therefore is to investigate whether there is a
relationship between (1) sense of connection to animals and (2) place attachment with
conservation behavior in the context of a zoo. Additionally we aim to identify different
predictors of sense of connection to animals and place attachment to the zoo. We will focus
our analyses on zoo-members, that is people who have a subscription for visiting the zoo, of a
Dutch urban zoo (i.e. Blijdorp in the city of Rotterdam). This is in our view unique, because
previous research has mainly focused on zoo visitors in general (e.g. Smith, 2009), or has
made a comparison between zoo visitors and non-visitors (e.g. Reade & Waran, 1996).
It is interesting to investigate especially this population because, although depending
on the duration of their subscription, zoo members have probably spent more time at the zoo.
towards the animals in the zoo and perhaps also a stronger sense of attachment towards the
zoo (i.e. place attachment). Overall, there must be something which can explain why members
believe that having a subscription for the zoo is worth the effort and the costs.
There are many reasons why people visit the zoo and thus decide to become a
member, for instance some might visit for entertainment, others visit to see rare animals
(Reade & Waran, 1996). In the current research zoo-members will be scaled on each of the
five identity-related visit motivations as described by Falk, Heimlich and Bronnenkant (2008).
Their research seems to suggest that visitors’ identity alone seems to have a relationship with
conservation behavior.
In the following paragraphs, the research variables will be explained in more depth, and
also a model including these variables will be provided.
1. Literature Review
1.1 Zoo members and conservation behavior
In the current research one is regarded as a zoo member when one has a subscription to
Blijdorp a zoo in the city of Rotterdam. There are different reasons why people like to visit
the zoo regularly and thus decide to buy a subscription (Reade & Waran, 1996). However,
Storksdieck and Falk (2004) found in their research on visit motivations, that the reasons
people gave for visiting a science center tended to cluster around a few basic categories of
reasons and descriptions. Based on these findings, it was theorized that it should be possible
to categorize visitors into five distinct identity-related categories (Falk, 2006), which were
also described in zoo visit motivation terms (Falk et al., 2008). The five categories are; (1)
Explorers, (2) Facilitators, (3) Professionals/ Hobbyists, (4) Experience Seekers, and (5)
Spiritual Pilgrims. (1) Explorers are curiosity-driven with a wide interest in the contents of the
zoo. They expect to find something that will grab their attention and fuels their desire to learn.
(2) Facilitators on the other hand are socially motivated. Their visit is primarily focused on
enabling others in their accompanying social group to have a joyful and educational
experience. A good example of this category, are parents that decide to buy a subscription for
the zoo, because their children like it. (3) Professionals or Hobbyists tend to feel a strong
connection between the contents of the zoo and their professional or hobbyist passion. Their
visits are typically motivated by a desire to satisfy a specific objective. These might be
and they can take great pictures of the animals in the zoo. (4) Experience Seekers tend to
perceive the zoo as an important destination, which can satisfy their need of excitement. One
could think of people who find it exciting to see wild animals, and just find the overall zoo
experience enjoyable. Lastly, (5) Spiritual pilgrims are primarily seeking to have a reflective,
spiritual and/or restorative experience. They see the zoo as a place to escape from their
normal, stressful life. The study of Falk et al. (2008) showed that only three of the five
categories (i.e. Facilitators, Professional/Hobbyists, and Experience Seekers) showed gains in
either cognitive or affective ways in terms of conservation. That is, they knew more about
conservation behavior and/or had a more positive attitude towards conservation behavior.
However, they did not investigate whether the five clusters of visitors differed in terms of
their actual (self-rated) conservation behavior. Also Falk et al. (2008), tried to classify each
participant under only one visit-motivation identity. We however believe that each participant
can possess more than one visit-motivation identity to a different extent. So in our analyses
every participant will have a score on each of the five visit-motivation identities, ranging from
low to high. It is therefore interesting to investigate how these visit-motivation identities
relate to conservation behavior, which can take place during the zoo visit as well as back
home. Our first question we would like to answer is:
Q1. How do each of the five visit-motivation identities (Explorers, Facilitators,
Professionals/Hobbyists, Experience Seekers, and Spiritual Pilgrims) predict (self-rated)
conservation behavior?
However, visit motivation does not seem to be the only way in which zoo-members
tend to differ from each other. Zoo-members are also likely to differ in terms of visit
frequency, living proximity to the zoo, subscription duration and visit intensity. One study has
found a direct link between visit intensity and conservation behavior (Groff, Lockhart, Ogden
& Dierking, 2005). This relationship does not seem to be investigated for the other mentioned
predictor variables. There appear to be however some interesting links between these
mentioned variables and place attachment and sense of connection to animals, two constructs
that might be mediating factors in the relationship towards conservation behavior.
1.2 Place attachment, sense of connection to animals and conservation behavior
In the current literature, place attachment is mostly defined as a positive affective bond
factor for understanding human behavior in terms of climate change and thus, connected to
that, conservation behavior. And indeed, in previous research place attachment was found to
be related to predicting pro-environmental attitudes and behavior (e.g. Ryan, 2006) as well as
predicting place specific stewardship (e.g. Krasny, Crestol, Tidball & Stedman, 2014).
However, in general one has to be careful with drawing conclusions from the literature in the
field of place attachment, because concepts such as place identity, place dependence, place
satisfaction, sense of place and place attachment are used across various place studies,
sometimes used as synonymous ideas and other times as distinct constructs (Lewicka, 2011).
However a scale that is widely used and perhaps best suited for the current context, because it
was designed specifically to test the bond people have with recreation places, is that of
Williams and Vaske developed in 2003 (Lewicka, 2011). They differentiate between the two
dimensions place identity and place dependence as two dimensions of place attachment. Place
identity concerns an emotional attachment, which refers to the symbolic importance of a place
as a depository for emotions and relationships that in turn provides meaning and purpose to
life. Place dependence on the other concerns functional attachment to a place, which reflects
the ability that the place has to satisfy the needs and goals of the individual. One could argue
that zoo members that have mainly a Spiritual Pilgrims visit-motivation may have a stronger
emotional attachment to the zoo and thus will probably score higher on the place identity
dimension of place attachment. Professionals or Hobbyists on the other hand may score
higher on the place dependence dimension of place attachment, because they may mainly
have a functional attachment to the zoo. These are however only speculations, because the
link between visit motivation and place attachment has never been investigated before.
Another construct that has been linked to conservation behavior and that is particularly
relevant in the contexts of zoos, is sense of connection to animals (Grajal et al., 2017). Based
on evolutionary history, it has been argued that humans possess an innate need to affiliate
with other living things Wilson (1984), and that humans seem to have a primal affective bond
with animals (Vining, 2003). This bond seems to be enhanced during visits to the zoo by
encounters with animals, which induce cognitive, affective, and social experiences (Schwan,
Grajal & Lewalter, 2014). It can be argued that these experiences, may induce feelings such
as mutual respect, understanding and empathy, which in turn may motivate care and concern
for the protection of the natural environment. Research by Grajal et al. (2017) seems to
confirm this proposition. They found that zoo members felt a stronger connection to animals
connection. Moreover, they also found that a sense of connection to animals is related to
attitudinal and behavioral responses to climate change. Again, just as was the case with place
attachment, zoo members with different visit motivations may also differ in their degree of
sense of connection to animals. Explorers for example might be very interested in one specific
animal, and want to explore all the details of this species, making it likely that they will have
a higher sense of connection towards animals than Facilitators, who mainly focus on the
social aspects of their visit and not so much on the animals. That is why the second question
we would like to answer in this study is:
Q2. How do the five visit-motivation identities (Explorers, Facilitators,
Professionals/Hobbyists, Experience Seekers, and Spiritual Pilgrims) differ in terms of
predicting place attachment and sense of connection to animals?
Next to this our first hypothesis is based on the findings that place attachment as well
as sense of connection have been found to be related to conservation behavior (Ryan, 2006;
Krasny et al., 2014; Grajal et al., 2017).
H1. a) Place attachment and b) sense of connection to animals positively predict conservation behavior.
In our view it seems logical that in a place like the zoo the constructs place attachment
and sense of connection are closely intertwined. It could be that the stronger the sense of
connection to animals the stronger the feeling of place attachment, but perhaps also that the
stronger one feels attached to the zoo, the stronger the sense of connection to animals. We
therefore propose:
H2. Place attachment and sense of connection to animals are correlated.
There are several factors that seem to predict place attachment. The first two
predictors that seem to be reliable predictors for place attachment are the time someone has
lived at a particulars place and home ownership (Lewicka, 2011). In the current study this can
be translated into the time someone owns a subscription to the zoo. So it is expected that the
longer one owns a subscription, the higher place attachment will be. Other factors predicting
place attachment (to national parks), are proximity to the park and visiting frequency (Moore
& Graefe, 1994; William & Vaske; 2003). Another predictor of place attachment seems to be
use-intensity. Ryan (2005) found in a study on parks, that park users differ in terms of their
visitors that just walk through the zoo, without really paying attention to for example
information signs about the animals and who do not visit feeding shows etc., and visitors who
do just that and thus have a more active zoo experience. Therefore, we expect a positive
relationship between use-intensity and place attachment.
So far there have not been found such reliable predictors for sense of connection to
animals, because this seems to be a rather small and uninvestigated field of research. As
mentioned, Grajal et al. (2017) found a relationship between zoo membership and visit
frequency and sense of connection. In line with their research we therefore expect a positive
relationship between subscription duration, visit frequency and sense of connection. However
we also expect that the other two predictors (i.e. proximity to the zoo and intensity of visits)
of place attachment are also able to predict sense of connection to animals, because these two
constructs seem so closely intertwined. Therefore we predict:
H3. Length of subscription duration (a), proximity to the zoo (b), visit frequency (c), and visit intensity (d) predict (i) place attachment and (ii) sense of connection to animals.
We do however think that although, the two constructs of place attachment and sense
of connection are closely related, they are not the same. One could arguably have a very
strong sense of connection to animals, but very few feelings of place attachment, because one
only cares about the animal(s) and not so much about the place they live in. The other way
around, one could experience a high level of place attachment, but a rather low sense of
connection to animals, because one mainly focuses on the functional and emotional benefits a
place has to offer, but does not care to connect to animals on a deeper level. Their predictors
therefore might be similar, but the strengths of the relationships may differ between these two
constructs.
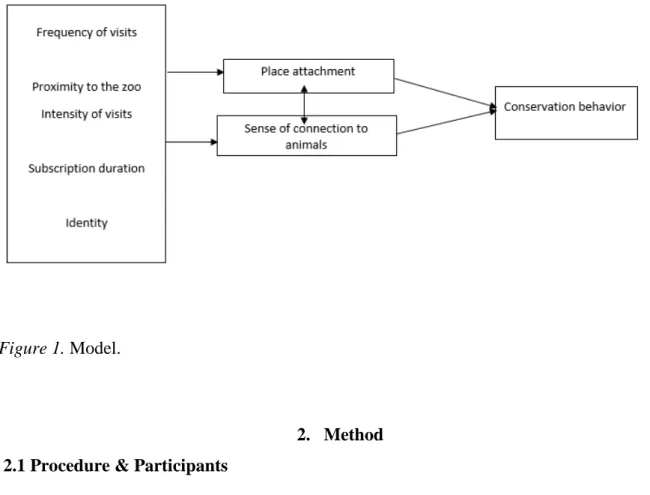
The model which is presented in Figure 1, is based on the mentioned hypotheses. The
Figure 1. Model.
2. Method 2.1 Procedure & Participants
First a pilot study was held in the zoo. With the help of the marketing and communication
manager of Diergaarde Blijdorp we invited zoo members by email for an interview. In total
11 zoo subscription owners were interviewed with open questions. We asked them open
questions to get a better view of the population we were dealing with, in the hope that this
would help us with setting up an appropriate final survey. In appendix A an overview of these
questions can be found. Note that not only questions for the current study were asked, but also
questions that were related to the larger project were this study is making part of. In the
appendix however, only those questions relevant for the current study were included. In
appendix B, a summary of the main findings of this pilot study can be found. After this pilot
study, the final questionnaire survey was made.
The sample of this study were individuals who own a subscription for Diergaarde
Blijdorp (a zoo in Rotterdam). This study is part of a larger research project that studies
subscription owners of the zoo. An online survey that measured the variables of the current
report, as well as other variables that were used for the larger project was developed with the
Qualtrics Survey Software of Leiden University. The link to this survey was distributed with
the help of the marketing and communication manager of Diergaarde Blijdorp. He sent the
about the purpose of the study and that it was anonymous and voluntary. We had the
opportunity to give away five Diergaarde Blijdorp gift cards of €10,-. We informed
participants that they could subscribe to the lottery if they filled in their email-address at the
end of the survey. After two weeks 1016 participants filled in the questionnaire and we
decided to close the data collection. It was decided to only use the data of participants who
filled in the entire questionnaire, which leaves us with 835 participants in total.
2.2 Measures and preparatory analyses
2.2.1 Demographic information. Participants were asked to indicate their age, gender, type and duration of subscription. Most people in our dataset were between 31-40 years old
(45.7%) and most of them were female (63.8%). Most participants had a subscription that
consisted of two adults with kids of 3-17 years old (27.2%), followed by a subscription for
only one adult (17.2), and two adults with kids younger than 3 years old (15.4%), and two
adults with kids younger than 3 years old combined with kids between 3-17 years old
(15.4%). The rest had a different kind of subscription construction.
Approximately 30% had a subscription for a half year until 1 year, 40% had a
subscription for 1-3 years, and 13% for 3-6 years. Most people visited the zoo for 5-6 per year
(35.8%), followed by once a month (27.3%), and twice a month (18.9%).
Proximity to the zoo was measured with the item how far do they live away from the
zoo (≤10 km, 10-20 km; 20-40 km; ≥40 km). Most participants lived relatively close to the zoo (33.7% lives 10 km or closer to the zoo, 35.7% lives between 10-20 km from the zoo).
Only 5% of visitors lived 40 km or further away from Diergaarde Blijdorp. Although the
majority of participants lived relatively close to the zoo, most of them selected the car as their
most commonly used means of transport (75.9%), followed by bike (9.7%), public transport
(7.5%), and by foot (6.0%). The travel time to the zoo was for most participants (66.3%)
between 11-30 minutes.
Their visit frequency was measured with the question how often they visit the zoo in
general (ranging from less than once a year until more than once a week). Most subscription
holders had visited the zoo 5-6 times a year (35.8%) followed by once a month (27.3%), and
Use-intensity was measured with the question how much time they spent on average
per visit to the zoo (visit duration; ≤2 hours, 2-4 hours, 4-6 hours, 6-8 hours, ≥8 hours). Most participants indicated that they spent 2 to 4 hours in general per visit (61.8%). Also another
way to measure use-intensity, participants where asked whether they would describe their
usual visits as active or passive (visit-intensity). An active visit could be seen as a visit where
they read the information signs, visit (feeding) shows, and talk to zookeepers. A passive visit
would be a visit where they mainly walk through the zoo, but do not pay much attention to
everything what is happening. Participants could indicate their visit intensity on a 5-point
scale ranging from passive to active. The mean score on this item was M=3.72 (SD=1.35),
indicating that subscription holders were more leaning towards active visits rather than
passive visits. However, approximately one third of participants described their visits as not
passive, but also not active.
2.2.2 Visit-motivation identity. The visit-motivation identity of participants was measured using the same set of questions Falk et al. (2008) used in their research. This instrument
consisted of 20 statements representing four items of each of the five visit-motivations.
Although in their research they asked participants to select five statements that best explained
why they chose to visit the zoo, in our research we asked participants to indicate for every
statement how well it fits their visit motivation. Items were presented in a 5-point “strongly
disagree” (1) to “strongly agree” (5) format with a neutral point of 3. Table 1 shows the mean,
standard deviations, correlations and reliabilities of the 5 visit-motivations identities.
Table 1
Descriptive statistics, correlations and reliability for the visit-motivation identity scalesa
a N = 835. Alpha coefficients are on the diagonal in parentheses
*= significant at the .05 level (2-tailed). **= significant at the 0.01 level (2-tailed)
As mentioned we decided to treat these identities in the same way as personality traits,
such that one person can possess all 5 visit-motivations to a greater or lesser extent. Which is
Visit motivation identity Mean s.d. 1 2 3 4 5
1. Professional/ Hobbyist 2.82 0.80 (.67)
2. Spiritual pilgrim 3.77 0.67 .54** (.59)
3. Explorer 2.92 0.74 .67** .55** (.65)
4. Facilitator 3.84 0.82 .00 .02 .23** (.73)
a different way of treating the questionnaire than previous research did. Therefore, we could
not compare reliabilities with earlier research. As can be seen in Table 1, the reliabilities of
the 5 visit-motivation identity scales were not that high. The Facilitator scale had the highest
reliability (α=.73), and the Experience seeker scale the lowest (α=.51). This could be
explained by the fact that each scale only consisted of 4 items. And perhaps also because the
items were translated from an American-English context to Dutch. It could be that the Dutch
participants could not really empathize with some of the items.
It is also interesting that almost all identities correlated strongly with each other. Only
the Facilitator scale did not correlate with the Professional/ Hobbyist and Spiritual pilgrim
scale. This may strengthen the idea that indeed one visitor can have multiple
visit-motivations. In the result section, we will perform a principal component analysis to
investigate whether the identities will be represented in our data as well.
2.2.3 Sense of connection to animals. Sense of connection to animals was measured using 4 items. One item asked participants whether they experienced a sense of connection with the
animals they see at the zoo (response range from 1=”Not, I do not feel a connection”, to
5=”Yes, I feel a very strong connection”). This item was similar to the research of Grajal et al.
(2017), where they measured the sense of connection to animals only with this single item. As
a follow up question, if participants indicated that they experienced a sense of connection to
the animals at the zoo, we asked with which animal they experienced the strongest
connection. In addition to this we used three more items to measure sense of connection,
based on the research of Luebke and Matiasek (2013); Packer, Ballantyne and Hughes
(2014); and Luebke, Watters, Packer, Miller and Powell (2016).
These other three items were: (1) In the zoo I spend as much time as possible watching
the animals; (2) I believe animals have emotions; (3) I enjoy spending my spare time
watching the animals at the zoo.
The four items had a reliability of α=.63, which is not very high, but might be due to the low number of items. All items had a significant positive inter-item correlation ranging
from r=.20 between ‘I experience a sense of connection’ and ‘I believe animals have
emotions’, to r=.52 between ‘I spend as much time as possible watching the animals’ and ‘I
enjoy spending my spare time watching the animals’. The mean score of sense of connection
2.2.4 Place attachment. Place attachment was measured with the scale developed by Williams and Vaske (2003). A scale that is popular and often used to measure place
attachment (Lewicka, 2011). In the original scale place attachment was measured with 12
items, with six items measuring place dependence and the other six measuring place identity.
In the current research the items were translated into Dutch and adjusted to the context of a
zoo. In the end the 6 items were used measuring place identity, and 5 items for place
dependence. One of the items of place dependence was left out, because it had low added
value in the original scale and because it could not be translated very well into Dutch. Items
were presented on a 5-point scale, 1=”strongly disagree” to 5=”strongly agree”. An example
of a place dependence item is; No other place can compare to this zoo. An example of a place
identity item is; I identify strongly with this zoo.
Both scales showed to be highly reliable (place identity: α=.93, place dependence:
α=.87), and were positively correlated (r=.52, p<.001). The total scale of place attachment had a reliability of α=.91. The mean score of place identity was 3.15 (SD=0.91), of place
dependence was 3.10 (SD=0.84), and of place attachment in total was 3.13 (SD=0.76).
2.2.5 Conservation behavior. Self-reported conservation of environmental behaviors were measured in a similar way as in the research of Schultz et al. (2005). Participants were asked
to rate “how often they do each of the following”, on a 5-point Likert scale; never (1), rarely
(2), sometimes (3), often(4), very often (5). The behaviors that were asked covered a variety
of domains and differed in their extent of difficulty. The 13 items included; look for ways to
reuse things, recycle newspapers, recycle cans or bottles, recycle plastic, encourage friends or
family to recycle, purchase products in reusable containers, pick up litter that is not your own,
compost food scraps, conserve gasoline by walking or cycling, writing or sharing a letter or
post (on social media) supporting an environmental issue, vote for a candidate who supported
environmental issues, donate money to an environmental group, and volunteer time to help an
environmental group.
The conservation behavior scale had a good reliability (α= .85). In Figure 1, the mean scores of each of the behaviors can be seen. It seemed that the behaviors could be divided into
more easy behaviors and harder-to-perform behaviors, just like it was mentioned in Schultz et
al. (2005). Easy behaviors like recycling cans and bottles, or newspapers is something that
almost everyone does (M=4.64 and M=4.20). Behaviors like writing or sharing a letter or post
much harder to perform. As can be seen these harder to perform behaviors were also less
prominent among our participants (M=1.83 and M=1.57). In the result section a principal axis
factoring analysis will be performed to investigate whether such a dichotomy can be found, or
whether the conservation behavior scale consists of other factors.
Figure 2. Mean scores of conservation behaviors
2.3 Analyses
First a factor analysis on the visit-motivation identity scale and on the conservation
behavior scale will be performed. Next regression analyses will reveal which variables can
explain place attachment and sense of connection to animals, and also conservation behavior.
Eventually mediation analyses will be performed to test the overall model.
3. Results
3.1 Visit-Motivation Identity and Conservation Behavior
To answer the first question of how the five visit-motivation identities differ in terms
of predicting conservation behavior, a factor analysis on both scales was performed.
First a principal component analysis (PCA) with oblique oblimin rotation was
performed on the 20 items measuring visit-motivation identity. Because we translated the
0 0,5 1 1,5 2 2,5 3 3,5 4 4,5 5
M
e
a
n
s
c
o
scale from English to Dutch, adjusted it to a zoo context, and used it on regular visitors
instead of one time visitors, we used the factor analysis to check whether the identities were
maintained through our modifications of the scale. An oblique rotation was chosen, because
as argued we believe that one person can have multiple visit-motivations. Also as was shown
in the method section, the original visit-motivations where indeed all correlated, therefore the
motivations (i.e. factors) should be correlated. The sample size is large enough (N≥300) and the Kaiser-Meyer-Olkin measure is above .5 (KMO=.87), which indicates that the data is
suitable for performing a factor analysis (Field, 2013). The factor analysis showed that five
factors had an identity above the Kaiser’s criterion of 1. Together the five factors could
explain 56.69% of variance. Also the screeplot showed this five-factor solution; the point of
inflexion was at the fifth component. After rotation, the items clustered around five factors,
each containing 4 items (Table 2). These factors were however not the five initial
visit-motivation identities. The first factor contained two items from the Professional/ Hobbyists
scale and two items from the Explorer scale. All of these items are about learning as a
visit-motivation, we will call this visit-motivation the Learner. The second factor is the only
original identity that indeed shows to be a solid factor in the PCA, the Facilitator
visit-motivation. The third factor contains two items of the Spiritual pilgrim scale, one of the
Experience seeker scale, and one of the Professional/ Hobbyists scale. One could argue that
all of these items are about hedonic properties of the zoo as visit reasons. Therefore this
visit-motivation will be called the Hedonic visitor. The fourth factor contains two items of the
Spiritual pilgrim scale, one of the Experience seeker scale, and one of the Explorer scale.
Most of these items are about using the zoo to get away from the normal rush of life, therefore
this identity will be called the Spiritual seeker. The fifth factor contains two items of the
Experience seeker scale, one of the Professional/ Hobbyists scale, and one of the Explorer
scale. These items are about visiting because one does not want to miss out, and visits because
one wants to stay up to date. However, all these items have a negative loading on factor 5,
which may represent the problem of ‘indeterminacy’ (Gorsuch, 1983; Grice, 2001). The
correlations shown in Table 3 indicate that there is a positive relationship with all the other
factors, and thus not a negative relationship as the negative values of the factor loadings
would indicate. This finding together with the knowledge of factor score indetermination,
justifies treating the fifth factor that consists of only negative loadings as a factor that consists
of only positive loadings. Therefore we could argue, that factor 5 represents visitors that are
motivated to visit to learn things and stay up to date. This visit-motivation will therefore be
Table 2
Factor loadings with non-orthogonal oblimin rotation on the visit-motivation identity scale
Visit-motivation identities Factor 1 Factor 2 Factor 3 Factor 4 Factor 5
I hope to find out more about something in particular
(PH) ,698 -,005 ,185 -,106 -,276
It relates to the kind of work/hobby that I do and I find
it useful (PH) ,620 -,235 ,004 ,199 ,102
I discover things about myself when I come here (E) ,565 ,134 -,061 ,358 ,036
It satisfies my curiosity (E) ,356 ,207 ,092 ,248 -,167
One of my significant others made me come (F) -,042 ,781 -,086 ,113 ,210 I like to support the learning of my children/
significant other (F) ,087 ,747 -,004 -,101 -,110
This is a good way for my family/friends to share
quality time (F) -,207 ,736 ,241 ,027 ,051
My family/friends learn things here they can’t in other
places (F) ,107 ,699 -,007 -,101 -,222
Because I think it’s fun (ES) -,108 ,124 ,742 ,009 -,066
I find visiting this zoo more inspiring than going to the
mall or a movie (SP) ,371 ,069 ,594 -,013 ,121
Visiting the zoo is my hobby (PH) ,306 -,089 ,461 ,241 -,013
It’s a special place; I don’t get into spaces like this
every day (SP) ,058 ,024 ,446 ,089 -,384
I find going helps me get away from normal rush of
life (SP) ,093 -,108 ,092 ,700 ,077
Because Diergaarde Blijdorp is the kind of place
people like me go to (E) -,014 ,062 -,037 ,694 -,144
I feel at peace in this zoo (SP) -,123 -,092 ,382 ,478 -,200
I wanted to be able to say that I had been there (ES) ,254 ,131 -,381 ,435 -,141 Because this place is a landmark in this community
(ES) -,126 ,014 -,059 ,101 -,792
I’m quite knowledgeable but like to keep up with
what’s new (PH) ,347 -,024 -,027 ,024 -,638
To learn new things (E) ,472 ,176 ,029 -,128 -,539
Because in my opinion it is one of the best places to
visit around here (ES) -,099 -,001 ,265 ,325 -,521
Table 3, shows some descriptives of the new identity scales. The Zoo-enthusiast scale
showed to be the most reliable (α=.74), and the Spiritual seeker the least (α=.59). Deleting items from a scale did not leave us with a higher reliability, therefore it was decided to
include all the items into each scale. Almost all scales, except the Facilitator and Spiritual
seeker scale, were correlated. These new identities will be used for the remaining analyses.
Table 3
Descriptive statistics, correlations and reliability for the new visit-motivation identity scalesa
Visit-motivation identity M s.d. 1 2 3 4 5
1. Learner 2.56 .79 (.67)
2. Facilitator 3.84 .82 .08* (.73)
3. Hedonic visitor 4.0 .61 .51** .10** (.60)
4. Spiritual seeker 2.93 .71 ,56** .01 .43** (.59)
5. Zoo-enthusiast 3.50 .73 ,57** .23** .51** .51** (.74)
a N = 835. Alpha coefficients are on the diagonal in parentheses
*= significant at the .05 level (2-tailed). **= significant at the 0.01 level (2-tailed)
Next, a principal axis factor analysis with orthogonal varimax rotation was performed
on the 13 items that measured conservation behavior. The sample size was large enough
(N≥300), and also the Kaiser-Meyer-Olkin measure supports an adequate sample size, KMO=.89, which is above the minimum criterion of .5 (Field, 2013). Two factors had
eigenvalues above the Kaiser’s criterion of 1. Together they could explain 48% of variance.
Also the screeplot justifies this two-factor solution, with the point of inflexion at the second
component. One could argue that after rotation, the items clustered around two factors (Table
4). One factor exists of behaviors that a lot of people are doing, because they are quite easy to
perform. Such as recycling paper and plastic. The other factor consists of behaviors that
require more effort and dedication, such as voting for a candidate who supports environmental
issues or encouraging friends or family to recycle. Only people who are truly concerned about
the environment will probably perform this behavior. The 9 harder to perform conservation
behaviors had a reliability of Cronbach’s α= .835. The 4 easy to perform conservation behaviors had a reliability of Cronbach’s α= .688. Participants scored on average 4.0 (SD=.86) on the easy to perform behaviors, and 2.7 (SD=.73) on the harder to perform
behaviors, with the question how often they performed the behaviors on a scale from 1
(=never) to 5 (=very often). The scales were highly correlated (r=. 49, p<.001). For the rest of
the analyses it might be wise to treat the two components as two different scales, and thus as
Table 4
Factor loadings with orthogonal varimax rotation on the items of conservation behavior
Conservation behaviors Factor 1 Factor 2
Vote for a candidate who supported environmental issues .635 .146
Purchase products in reusable containers .618 .399
Encourage friends or family to recycle .590 .472
Writing or sharing a letter or post supporting an environmental issue .574 <.10
Donate money to an environmental group .569 .155
Volunteer time to help an environmental group .535 <.10
Look for ways to reuse things .532 .455
Conserve gasoline by walking or cycling .524 .209
Pick up litter that is not your own .442 .197
Recycle newspapers .135 .778
Recycle plastic .246 .681
Recycle cans or bottles <.10 .469
Compost food scraps .248 .441
The next step we had to take to answer the first question is to perform multiple linear
regression analyses, with the five visit-motivation identities as predictors and the easy and
harder to perform conservation behaviors as outcome variables.
In Table 5 the multiple regression analysis on the dependent variable easy-to-perform
conservation behaviors is shown. The F-test was significant F(5,829)=4.26, p=.001. However,
the five visit motivation identities could only explain 3% of the total variance in
easy-to-perform conservation behavior. So overall prediction of the easy-to-easy-to-perform conservation
behaviors was rather low. Only two of the five visit-motivation identities had a meaningful
relationship with easy-to-perform conservation behavior. The facilitator identity had a
positive effect on easy-to-perform conservation behavior (β=.08, p=.024), whereas the
Spiritual fan identity had a negative effect on easy-to-perform conservation behavior (β= -.09,
p=.049). The Facilitator identity could explain 1% of unique variance. The other three
Table 5
Multiple regression analysis on the dependent variable easy-to-perform conservation behavior
Easy-to-perform conservation behavior
B β rs2
Constant 3.19
Learner .08 .08 .00
Facilitator .09 .08* .01
Hedonic visitor .10 .07 .00
Spiritual seeker -.10 -.09* .00
Zoo-enthusiast .04 .03 .00
R2 .03
Adjusted R2 .02
F 4.26**
df 5,829
* p<.05; ** p<.01; *** p<.001
In Table 6 the multiple regression analysis on the dependent variable
harder-to-perform conservation behavior is shown. The F-test was highly significant F(5,829)=17.43,
p<.001. The five visit motivation identities could explain 10% of the total variance in
harder-to-perform conservation behavior. Two of the five visit-motivation identities had a
meaningful relationship with harder-to-perform conservation behavior. Especially the Learner
identity had a strong positive effect on harder-to-perform conservation behavior (β=.22,
p<.001), and could explain 3% of unique variance in harder-to-perform conservation
behavior. The facilitator identity scale also showed to had positive effect on harder-to-perform
conservation behavior (β=.08, p=.021), and could explain 1% of unique variance in
perform conservation behavior. The other three identities did not have an effect on
Table 6
Multiple regression analysis on the dependent variable harder-to-perform conservation behavior
Harder-to-perform conservation behavior
B β rs2
Constant 1.45
Learner .20 .22*** .03
Facilitator .07 .08* .01
Hedonic visitor .07 .06 .00
Spiritual seeker .00 .00 .00
Zoo-enthusiast .05 .05 .00
R2 .10
Adjusted R2 .09
F 17.43***
df 5,829
* p<.05; ** p<.01; *** p<.001
So to answer the first question, of how the five visit-motivation identities differ in
terms of predicting conservation behavior, we did not use the original identities (Falk et al,
2008). We used five ‘new’ identities that came out of the PCA that was performed on the
visit-motivation identity scale. With these identities the first question can be answered as
followed: (1) For the easy-to-perform conservation behavior, only the Facilitator and the
Spiritual seeker identity show a significant effect. The other three identities do not have an
effect on easy-to-perform conservation behavior. In total the identities can explain 3% of
variance in easy-to perform conservation behavior. Which is not really much. (2) For the
harder-to perform conservation behavior, especially the Learner identity seems to have a
strong predictive effect, and can explain 3% of unique variance in harder-to-perform
conservation behavior. Also the Facilitator identity has a significant effect on
harder-to-perform conservation behavior, although to a lesser extent. The other three identities do not
have a meaningful role in predicting harder-to-perform conservation behavior. In total 10% of
variance in harder-to-perform conservation behavior can be explained by the five identities.
3.2 Visit-Motivation Identity, Place Attachment and Sense of Connection to Animals In Table 7 the multiple regression analysis on the dependent variable place attachment
is shown. The F-test was highly significant F(5,829)=124.26, p<.001. The five visit
motivation identities could explain 43% of the total variance in place attachment. So the
identities had a meaningful relationship with place attachment. The Hedonic visitor (β=.19,
p<.001), Spiritual fan (β=.25, p<.001), and Zoo-enthusiast (β=.34, p<.001) identities all had a
positive effect on place attachment. The Hedonic visitor could explain 2% of unique variance
in place attachment, Spiritual fan 4%, and Zoo-enthusiast 6%. The other two identities did not
have a significant impact on place attachment.
Table 7
Multiple regression analysis on the dependent variable place attachment Place attachment
B β rs2
Constant .14
Learner .03 .03 .00
Facilitator -.01 -.01 .00
Hedonic visitor .24 .19*** .02
Spiritual seeker .27 .25*** .04
Zoo-enthusiast .35 .34*** .06
R2 .43
Adjusted R2 .43
F 124.26***
df 5,829
* p<.05; ** p<.01; *** p<.001
In Table 8 the multiple regression analysis on the dependent variable sense of
connection to animals is shown. The F-test was highly significant F(5,829)=66.38, p<.001.
The five visit motivation identities could explain 29% of the total variance in sense of
connection to animals. So the overall prediction of sense of connection to animals was good.
Four of the five visit-motivation identities had a meaningful relationship with sense of
connection to animals. The Hedonic visitor (β=.29, p<.001), Spiritual seeker (β=.09, p=.018),
and Zoo-enthusiast (β=.23, p<.001) identities had a positive influence on sense of connection
to animals. The Facilitator identity had a negative effect on sense of connection to animals
(β= -.09, p=.005), and could explain 1% of unique variance in sense of connection to animals.
Table 8
Multiple regression analysis on the dependent variable sense of connection to animals Sense of connection to animals
B β rs2
Constant 1.69
Learner .05 .06 .00
Facilitator -.07 -.09** .01
Hedonic visitor .29 .29*** .05
Spiritual seeker .08 .09* .00
Zoo-enthusiast .19 .23*** .03
R2 .29
Adjusted R2 .28
F 66.38***
df 5,829
* p<.05; ** p<.01; *** p<.001
So to answer the second question of how the five visit-motivation identities differ in
terms of predicting place attachment and sense of connection to animals, we again did not use
the original identities, but the ‘new’ identities. (1) Place attachment can be better predicted
using the five identities than sense of connection to animals. 43% of variance in place
attachment can be explained with the five identities. The Hedonic visitor, Spiritual seeker, and
Zoo-enthusiast all have a positive effect on place attachment. (2) In terms of sense of
connection to animals, 29% of variance can be explained by the five identities. Especially the
Hedonic, and Zoo-enthusiast have a strong effect on predicting sense of connection to
animals, followed by the Facilitator and the Spiritual seeker identity.
3.3 Place Attachment and Sense of Connection: Predictors of Conservation Behavior For the following two regression analyses, the two dimensions of place attachment
(i.e. place identity and place dependence) were put as two separate predictors into the
regression analysis to find out which part of place attachment predicts our outcome variable,
conservation behavior, best. In Table 9 the multiple regression analysis on the dependent
variable easy-to-perform conservation behavior is shown. The F-test was highly significant
F(3,831)=6.93, p<.001. Place attachment (i.e. place identity and place dependence) and sense
of connection to animals could explain 2% of the total variance in easy-to-perform
conservation behavior. Sense of connection (β=.12, p=.003) and place identity (β=.09,
p=.039) had a positive effect on easy-to-perform conservation behavior. The effect of place
identity could both explain 1% of unique variance in easy-to-perform conservation behavior.
So in terms of easy-to-perform conservation behavior, our first hypothesis seemed partly
supported. Sense of connection to animals and place identity did positively predict
easy-to-perform conservation behavior, but place dependence did not.
Table 9
Multiple regression analysis on the dependent variable easy-to-perform conservation behavior Easy-to-perform Conservation behavior
B β rs2
Constant 3.31
Place identity .08 .09* .01
Place dependence -.06 -.06 .00
Sense of connection to animals .16 .12** .01
R2 .02
Adjusted R2 .02
F 6.93***
df 3,831
* p<.05; ** p<.01; *** p<.001
In Table 10 the multiple regression analysis on the dependent variable
harder-to-perform conservation behavior is shown. The F-test was highly significant F(3,831)=30.21,
p<.001. Place attachment (i.e. place identity and place dependence) and sense of connection to
animals could explain 10% of the total variance in harder-to-perform conservation behavior.
Both place identity (β=.23, p<.001) and sense of connection to animals (β=.16, p<.001) had a
positive effect on harder-to-perform conservation behavior. Place dependence did not have a
significant effect on harder-to-perform conservation behavior (β= -.06, p=.133). Place identity
alone could explain 3% of unique variance in harder-to-perform conservation behavior, and
sense of connection to animals 2%. So in terms of harder-to-perform conservation behavior,
our first hypothesis seems partly supported. Sense of connection to animals and place identity
both positively predicted harder-to-perform conservation behavior, but place dependence did
Table 10
Multiple regression analysis on the dependent variable harder-to-perform conservation behavior
Harder-to-perform Conservation behavior
B β rs2
Constant 1.59
Place identity .19 .23*** .03
Place dependence -.05 -.06 .00
Sense of connection to animals .19 .16*** .02
R2 .10
Adjusted R2 .10
F 30.21***
df 3,831
* p<.05; ** p<.01; *** p<.001
3.4 The Relationship Between Sense of Connection to Animals and Place Attachment Place attachment and sense of connection were moderately to highly correlated (r=.47,
p<.001), which supports our second hypothesis. Looking deeper into this relationship, sense
of connection had a slightly larger correlation with place identity (r=.47, p<.001), than with
place dependence (r=.34, p<.001). However both correlations were significant. So indeed
these two constructs are closely intertwined. Due to the correlational nature of this research
we do not know which of these constructs develops first or whether they develop
simultaneously. All we can say is that they are indeed related and important constructs in the
context of a zoo.
3.5 Predictors of Place Attachment and Sense of Connection to Animals
In Table 11 the multiple regression analysis on the dependent variable place
attachment is shown. The F-test was highly significant F(6,828)=13.44, p<.001. The model
could explain 9% of the total variance in place attachment. Visit frequency, visit duration and
visit intensity in particular seemed to be good predictors of place attachment. Visit duration
had the strongest positive relationship with place attachment (β=.18, p<.001), and could
explain 3% of unique variance in place attachment. Visit frequency (β=.15, p<.001) and visit
intensity (β=.14, p<.001) also had a strong positive relationship with place attachment. They
could both explain 2% of unique variance in place attachment. So one could argue that the
Although no causal conclusion can be made. Also subscription duration (β=.07, p=.034) and
residential distance (β= -.09, p=.032) had a significant relationship with place attachment. So
people who hold their subscription longer, feel more place attachment. People who live
further away, feel less attached to the zoo. Travel time did not have a relationship with place
attachment (β=.002, p=.955). In terms of place attachment our third hypothesis was
supported. Length of subscription duration, proximity to the zoo (residential distance), visit
frequency, visit duration and visit intensity predict place attachment. With visit frequency,
duration, and intensity being the strongest predictors.
In Table 12 the multiple regression analysis on the dependent variable sense of
connection to animals is shown. The F-test was highly significant F(6,828)=8.79, p<.001. The
model can explain 6% of the total variance in sense of connection to animals. Travel time
(β=.13, p=.003), visit frequency (β=.09, p=.013), visit duration (β=.13, p=.001) and visit
intensity (β=.12, p=.001) seem to be good positive predictors of sense of connection to
animals. Each of them could explain 1% of unique variance in sense of connection to animals.
That travel time had a positive relationship with sense of connection to animals seems odd.
One would expect that people who have to travel shorter would have a higher sense of
connection to animals. This was however not the case. Subscription duration (β=-.001,
p=.972) and residential distance (β=-.07, p=.109) were not significant predictors of sense of
connection to animals. In terms of sense of connection to animals, our third hypothesis was
partly supported. Proximity to the zoo (travel time), visit frequency, visit duration and visit
intensity predict sense of connection to animals, but subscription duration does not.
Table 11
Multiple regression analysis on the dependent variable place attachment Place attachment
B β rs2
Constant 1.95
Subscription duration .05 .07* .00
Residential distance -.08 -.09* .00
Travel time .00 .00 .00
Visit frequency .10 .15*** .02
Visit duration .20 .18*** .03
Visit intensity .08 .14*** .02
R2 .09
Adjusted R2 .08
F 13.44***
df 6,828
Table 12
Multiple regression analysis on the dependent variable sense of connection to animals Sense of connection to animals
B β rs2
Constant 2.83
Subscription duration -.001 -.001 .00
Residential distance -.05 -.07 .00
Travel time .06 .13** .01
Visit frequency .05 .09* .01
Visit duration .12 .13** .01
Visit intensity .06 .12** .01
R2 .06
Adjusted R2 .05
F 8.79***
df 6,828
* p<.05; ** p<.01; *** p<.001
However only 9% of variance in place attachment, and 6% of variance in sense of
connection to animals could be explained by length of subscription duration, proximity to the
zoo (residential distance & travel time), visit frequency, visit duration and visit intensity.
Which was not that much. Perhaps other factors that we did not include in our measurements
in this research play a bigger role in explaining place attachment to the zoo and sense of
connection to animals. Perhaps physical features of the zoo play a larger role in predicting
place attachment, and perhaps personality factors such as having a general love for animals
play a larger role in predicting sense of connection to animals. These are however only
speculations.
3.6 Testing the Overall Model (Mediation Analyses)
We wanted to test whether place attachment and sense of connection to animals
mediate the relationship between the significant predictors of (easy-and-harder-to-perform)
conservation behavior. Three conditions of mediation are that (1) the predictor variable must
significantly predict the outcome variable, (2) the predictor variable must significantly predict
the mediator, and (3) the mediator must significantly predict the outcome variable (Field,
2013). In terms of the third condition is seems that only sense of connection to animals, and
place identity (and not place dependence) were significant predictors of
easy-and-harder-to-perform conservation behavior (see Table 9 and 10). Therefore we will only include the place
identity dimension of place attachment into the mediation analysis, and not the place
of place attachment and sense of connection to animals. The significant predictors of place
attachment were: the Hedonic visitor identity, the Spiritual seeker identity, the Zoo-enthusiast
identity, subscription duration, residential distance, visit frequency, visit duration, and visit
intensity (see Table 7 and 11). The significant predictors of sense of connection to animals
were: The Facilitator identity, the Hedonic visitor identity, the Spiritual Seeker identity, the
Zoo-enthusiast identity, travel time, visit frequency, visit duration, and visit intensity (see
Table 8 and 12). In terms of the outcome variables (i.e. easy-and-hard-to-perform
conservation behavior) so far we only tested which visit-motivation identities were significant
predictors, but not which of the other predictors in our model (see Figure 1) are also
significant predictors. In Table 13 the regression analyses with these predictors is shown. The
F-test was highly significant F(6,828)=6.65, p<.001. In total 5% of variance in
easy-to-perform conservation behavior could be explained with these variables. It seems that
residential distance (β=.18, p<.001), and visit intensity (β=.08, p=.021) were positive
predictors of easy-to-perform conservation behavior. Residential distance could explain 2% of
unique variance in easy-to-perform conservation behavior, and visit intensity 1%. The other
predictors did not have a significant effect on easy-to-perform conservation behavior.
Table 13
Multiple regression analysis on the dependent variable easy-to-perform conservation behavior Easy-to-perform conservation behavior
B β rs2
Constant 3.32
Subscription duration .05 .06 .00
Residential distance .18 .18*** .02
Travel time .01 .01 .00
Visit frequency -.01 -.01 .00
Visit duration -.02 -.02 .00
Visit intensity .05 .08* .01
R2 .05
Adjusted R2 .04
F 6.65***
df 6,828
* p<.05; ** p<.01; *** p<.001
In Table 14 the regression analyses on harder-to-perform conservation behavior with
the remaining predictors is shown. Again the F-test was highly significant F(6,828)=7.25,
p<.001, and 5% of variance in harder-to-perform conservation behavior could be explained. In
distance had a negative effect (β= -.11, p=.010) on harder-to-perform conservation behavior.
Visit intensity could explain 3% of unique variance in harder-to-perform conservation
behavior, and residential distance 1%. The other predictors could not significantly predict
harder-to-perform conservation behavior.
Table 14
Multiple regression analysis on the dependent variable harder-to-perform conservation behavior Harder-to-perform conservation behavior
B β rs2
Constant 2.16
Subscription duration .04 .05 .00
Residential distance -.09 -.11* .01
Travel time .05 .08 .00
Visit frequency .02 .04 .00
Visit duration .01 .01 .00
Visit intensity .10 .19*** .03
R2 .05
Adjusted R2 .04
F 7.25***
df 6,828
* p<.05; ** p<.01; *** p<.001
So easy-to-perform conservation behavior could significantly predicted by the
Facilitator identity, the Spiritual seeker identity, residential distance, and visit intensity.
Harder-to-perform conservation behavior by the Learner identity, the Facilitator identity,
residential distance, and visit intensity.
Looking back to the three conditions of mediation, we conclude that only some of the
variables meet these conditions, so only these will be included into the mediation analysis. To
perform the mediation analysis the PROCESS custom dialog box was used (Hayes, 2012).
The first mediation analysis, will test whether the relationship between the Facilitator
identity and easy-to-perform conservation behavior is mediated by sense of connection to
animals. There was not a significant indirect effect of the Facilitator identity on
easy-to-perform conservation behavior through sense of connection to animals, b= 0.0003, BCa CI
[-0.011, 0.011]. Which represents a very small nonsignificant effect, looking at the standardized
The second mediation analysis, will test whether the relationship between the
Facilitator identity and harder-to-perform conservation behavior is mediated by sense of
connection to animals. Again no significant indirect effect of the Facilitator identity on
harder-to-perform conservation behavior through sense of connection to animals, b= 0.0005,
BCa CI [-0.017, 0.017]. This represents a very small nonsignificant effect, looking at the
standardized b for the indirect effect, with the value b= .0006, 95% BCa CI [-.020, .019].
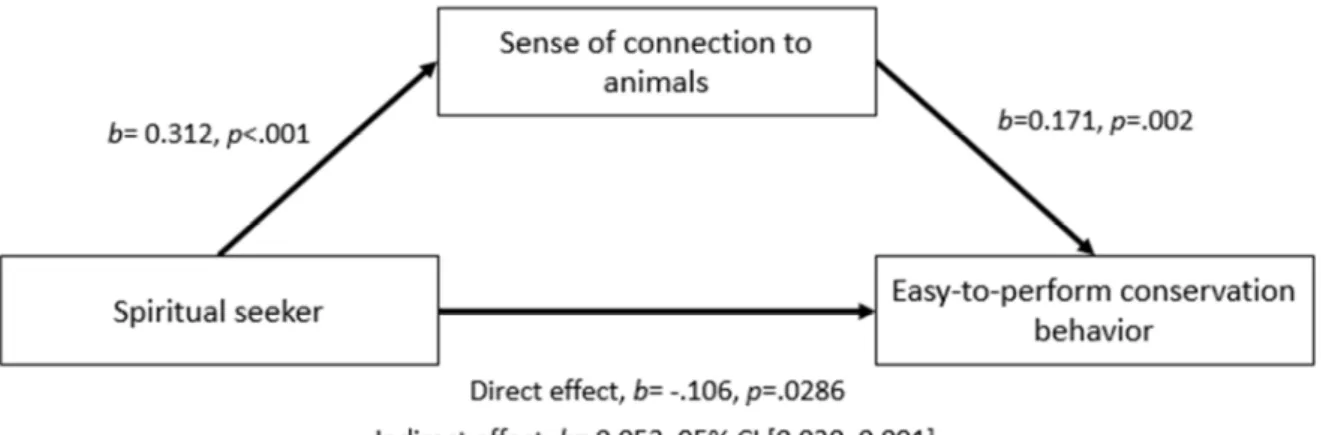
The third mediation analysis, will test whether the relationship between the Spiritual
seeker identity and easy-to-perform conservation behavior is mediated by sense of connection
to animals and/ or place identity. There was a significant indirect effect of the Spiritual Seeker
identity on easy-to-perform conservation behavior through sense of connection to animals, b=
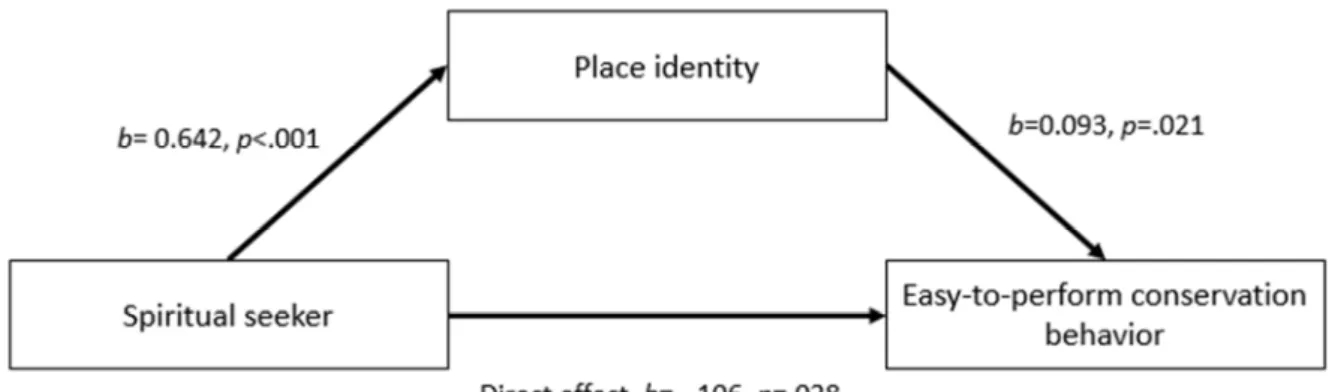
0.0532, BCa CI [0.020, 0.091] and place identity b= 0.0596, BCa CI [0.002, 0.118]. This
represents a small but significant effect, looking at the standardized b for the indirect effect,
with the value b= .044, 95% BCa CI [.017, .075] for sense of connection to animals and b=
.049, 95% BCa CI [.002, .098] for place identity. This significant mediation model is shown
in Figure 3. Indicated are the regression coefficients, the indirect effect and its bootstrapped
confidence intervals.
Figure 4. Model of the Spiritual seeker identity as a predictor of easy-to-perform conservation behavior, mediated by place identity.
The fourth mediation analysis, will test whether the relationship between residential
distance and easy-to-perform conservation behavior is mediated by place identity. There was
not a significant indirect effect of residential distance on easy-to-perform conservation
behavior through place identity, b= -0.004, BCa CI [-0.014, 0.003]. Which represents a very
small nonsignificant effect, looking at the standardized b for the indirect effect, with the value
b= -.004, 95% BCa CI [-.014, .003].
The fifth mediation analysis, will test whether the relationship between residential
distance and harder-to-perform conservation behavior is mediated by place identity. There
was again not a significant indirect effect of residential distance on harder-to-perform
conservation behavior through place identity, b= -0.008, BCa CI [-0.024, 0.007].
Representing a very small nonsignificant effect, looking at the standardized b for the indirect
effect, with the value b= -.010, 95% BCa CI [-.030, .008].
The sixth mediation analysis, will test whether the relationship between visit intensity
and easy-to-perform conservation behavior is mediated by sense of connection to animals
and/ or place identity. There was a significant indirect effect of visit intensity on
easy-to-perform conservation behavior through sense of connection to animals, b= 0.011, BCa CI
[0.003, 0.023], but not through place identity b= 0.007, BCa CI [-0.006, 0.020]. This
represents a small but significant effect, looking at the standardized b for the indirect effect,
with the value b= .017, 95% BCa CI [.005, .036] for sense of connection to animals, and a
Figure 5. Model of visit intensity as a predictor of easy-to-perform conservation behavior, mediated by sense of connection to animals.
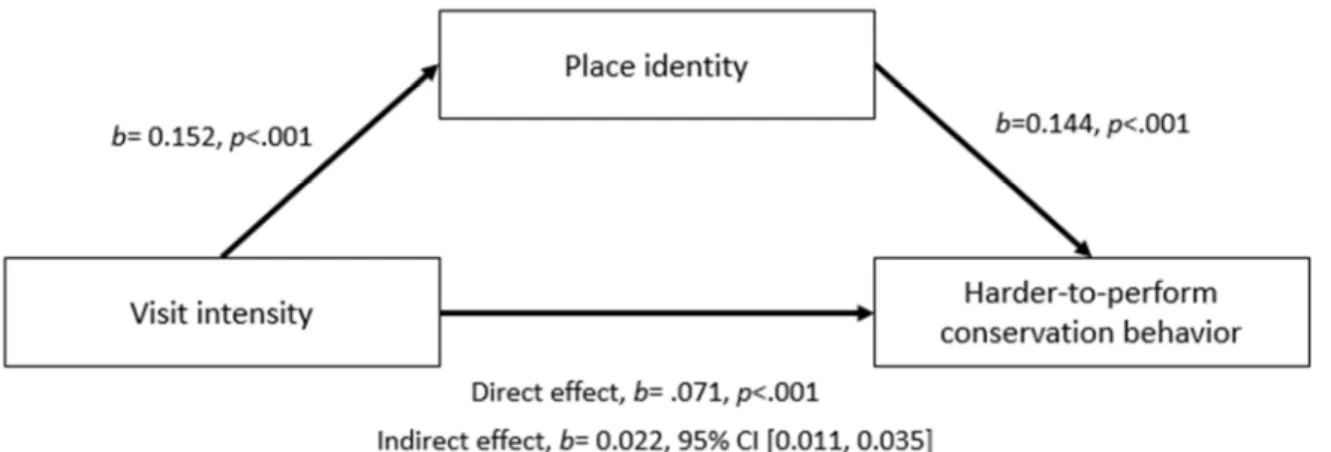
The seventh mediation analysis, will test whether the relationship between visit
intensity and harder-to-perform conservation behavior is mediated by sense of connection to
animals and/ or place identity. There was a significant indirect effect of visit intensity on
harder-to-perform conservation behavior through sense of connection to animals, b= 0.013,
BCa CI [0.006, 0.024] and place identity b= 0.022, BCa CI [0.011, 0.035]. This represents a
small but significant effect, looking at the standardized b for the indirect effect, with the value
b= .024, 95% BCa CI [.010, .045] for sense of connection to animals and b= .041, 95% BCa
CI [.021, .064] for place identity.
Figure 7. Model of visit intensity as a predictor of harder-to-perform conservation behavior, mediated by place identity.
4. Discussion
One of the main goals of zoos is to promote knowledge about nature conservation,
which they try to achieve by showing species in their natural habitats and by providing
information (Patrick et al., 2007). By doing this they hope to motivate people to perform more
conservation behavior. In this study two constructs that seem to have a positive relationship
with conservation behavior (Grajal et al., 2017; Scannell & Gifford, 2010), and that are
relevant in the context of zoos, were investigated; namely feeling sense of connection to
animals and place attachment. Place attachment can be defined as a positive affective bond of
a person to a place (Lewicka, 2011). In the current research place attachment is compiled of
place identity (i.e. emotional attachment to the zoo) and place dependence (i.e. functional
attachment to the zoo). Sense of connection to animals concerns the affective bond that people
have with the animals in the zoo. The aim of the current research was to investigate whether
there is a relationship between (1) sense of connection to animals, and (2) place attachment
with conservation behavior in the context of a zoo. A unique research that was done using
data from subscription holders of a Dutch urban zoo, N=835 (i.e. Diergaarde Blijdorp in
Rotterdam). Additionally we aimed to identify different predictors of sense of connection to
animals and place attachment to the zoo, and eventually performed a mediation analysis to
test the overall model (see Figure 1).
First it was analysed what kind of visit motivations subscription holders have, and
what the effect of these motivations is on conservation behavior. Initially we assumed that
visitors could be scaled on five visit motivation identities (i.e. Explorers, Facilitators,