EXPLORING THE CAUSAL ROLE OF NEURAL OSCILLATIONS IN ENDOGENOUS AND EXOGENOUS ATTENTION: DIFFERENT EFFECTS OF 40 HZ AND 10 HZ TACS
STIMULATION
Jonathan Parsons
A thesis submitted to the faculty at the University of North Carolina at Chapel Hill in partial fulfillment of the requirements for the degree of Master of Arts in the Department of Psychology
and Neuroscience (Cognitive Psychology).
Chapel Hill 2017
Approved by:
Joseph B. Hopfinger
Neil W. Mulligan
ABSTRACT
Jonathan Parsons: Exploring The Causal Role Of Neural Oscillations In Endogenous And Exogenous Attention: Different Effects Of 40 Hz And 10 Hz Tacs Stimulation
(Under the direction of Joseph B. Hopfinger)
Previous electrophysiological studies strongly implicate a role for both alpha (8 – 12 Hz) and
gamma (30 – 120 Hz) oscillations in selective attention. However, establishing causality requires
inducing these oscillations in the brain and observing the behavioral changes that result. To this
end, we stimulated participants’ right posterior parietal cortex at 10 Hz, 40 Hz or sham while they
performed two separate cueing tasks—one endogenous and one exogenous. Stimulation at 40 Hz
speeded responses to invalidly-cued targets, suggesting a facilitation of voluntary attentional
shifting. There was also a marginal effect of 10 Hz stimulation, such that responses to
invalidly-cued targets in the exogenous task were slowed. Possible reasons for a lack of lateralized effects
are discussed. These results provide new information about the causal roles of different frequencies
of neural oscillation in facilitating visuospatial attention, providing support for frequency-specific
TABLE OF CONTENTS
LIST OF FIGURES ... v
CHAPTER 1: INTRODUCTION... 1
EEG/MEG frequency studies... 2
Alpha-band oscillations (8 – 14 Hz) ... 2
Gamma-band oscillations (30-120 Hz) ... 6
Neurostimulation ... 10
Rhythmic neurostimulation studies: rTMS and tACS ... 13
CHAPTER 2: METHODS ... 19
Participants ... 19
Design ... 19
Materials & Procedure ... 22
CHAPTER 3: RESULTS ... 25
CHAPTER 4: DISCUSSION ... 28
APPENDIX A: FIGURES ... 35
LIST OF FIGURES
Figure 1 - Example trial sequences ………35
CHAPTER 1: INTRODUCTION
Paying attention involves selecting some aspects of the current sensory environment for
further processing while simultaneously suppressing others in order to minimize their interference
with the selected stimulus. Understanding this process requires, on the one hand, the formation of
abstract models that accurately predict the behavioral effects of attention. On the other, it involves
elucidating the physical mechanisms by which attentional selection is accomplished.
Theories of attention typically divide the process of “attending” into several sub-categories.
From early-on, theories distinguished between voluntary (endogenous) and reflexive (exogenous)
forms of attention (Jonides, 1981). Posner and Petersen (1990) divided “the attention system” into
three subsystems, one for orienting to sensory events, one for detecting environmental signals that
may be behaviorally relevant, and one for maintaining an alert or vigilant state. These three
subsystems have since been labeled as the Orienting, Alerting and Executive systems, and an
enormous amount of research has been done on the basis of these constructs (Petersen & Posner,
2012).
Central to most theories of attention, and the ideas of selecting and suppressing mentioned
above, are the concepts of neural excitation and inhibition (Houghton & Tipper, 1996; Knight,
Staines, Swick, & Chao, 1999; Posner & Presti, 1987). These concepts, in turn, provide a critical
link between abstract accounts of attention and descriptions of their neural underpinnings. Most of
our knowledge of the physical mechanisms that may underlie attention comes from functional
much insight into attention, the two that are especially relevant to the proposed study are
electroencephalography (EEG) and magnetoencephalography (MEG). Findings from these studies
will be described in the following sections.
EEG/MEG frequency studies
It has been known since the advent of the electroencephalogram (Berger, 1929) that, in
recording electrical potentials at the scalp, one may observe a pattern of very pronounced
regularity. Such patterns of oscillating voltage have been attributed to the synchronous, periodic
activation and inhibition of large groups of neurons (Whittington, Traub, Kopell, Ermentrout, &
Buhl, 2000). These oscillations are typically subdivided into frequency ranges, each of which turns
out to have particular functional associations. These are named delta (1-4 Hz), theta (4-8 Hz), alpha
(8-14 Hz), beta (14-30 Hz) and gamma (30 – 120 Hz). Theta, alpha and gamma oscillations are all
considered important for attention. Theta’s most important role is thought to be in the coupling of
distant brain areas (Clayton, Yeung, & Cohen Kadosh, 2015). However, as the current study is
focused more on local, single area oscillations, the literature review will focus primarily on alpha
and gamma.
Alpha-band oscillations (8 – 14 Hz)
As one of the most easily discernable features of the EEG, alpha oscillations have been a subject
of study for roughly 80 years (Berger, 1929; Jasper & Cruickshank, 1937). And while the notion
that they might be associated with attention is also longstanding (Martinius & Hoovey, 1972;
Mulholland, 1969; Mulholland, Goodman, & Boudrot, 1983; Mulholland & Runnals, 1962), a
more precise description of the relationship has only emerged in the last 15-20 years. This research
(Haegens, Cousijn, Wallis, Harrison, & Nobre, 2014; Kelly, Dockree, Reilly, & Robertson, 2003;
Klimesch, Doppelmayr, Russegger, Pachinger, & Schwaiger, 1998; MacLean, Arnell, & Cote,
2012) and its consequences for perceptual performance; the involvement of alpha oscillations in
the relationship between attention and memory (Jiang, van Gerven, & Jensen, 2015; Klimesch,
1997, 1999; Myers, Walther, Wallis, Stokes, & Nobre, 2015); and the role of alpha oscillations in
selectively attending to other sensory modalities (Frey et al., 2014; Haegens, Luther, & Jensen,
2012; Weisz, Müller, Jatzev, & Bertrand, 2013). However, most relevant to the proposed research
are those studies that have focused on alpha and the allocation of visual attention. It is those studies
that will be reviewed here.
Worden et al. (2000) demonstrated that alpha band power may be distributed over occipital
cortex in a retinotopic fashion, specifically in a manner that reflects the current locus of visual
attention. Participants completed a task in which a centrally-presented, non-predictive arrow
directed them to covertly shift their attention to the left or right of the display. They were instructed
to respond only to targets that appeared on the cued side, and only to one of four possible target
types (they should withhold responding for the other three target types). Targets could appear in
the upper left or right quadrants on half of the blocks, and in the lower quadrants on the other half.
Worden et al. specifically focused on alpha activity in the period after cue onset but before target
onset, so that differences in activity between cue directions could be specifically attributed to the
allocation of attention, rather than stimulus processing. Increases in alpha power were observed
contralateral to the to-be-ignored visual hemifield (ipsilateral to the to-be-attended-field).
Moreover, the location of peak alpha-power was more dorsal in upper-quadrant blocks than in
processing in a specific, topographic manner. This finding was soon replicated across several
different studies (Fu et al., 2001; Klimesch, Sauseng, & Gerloff, 2003; Sauseng et al., 2005).
Thut, Nietzel, Brandt, & Pascual-Leone (2006) added further evidence for the
alpha-attention association by showing that probability of successful performance could be predicted by
the relative balance of alpha power between hemispheres, prior to target onset. The researchers
had participants perform a target localization task. Targets could appear to the left or right of
fixation. An auditory cue that preceded the target correctly predicted its location on 66% of trials.
Participants were required to respond by pressing one of two buttons to indicate which side of the
display the target had appeared on. Thut et al. found that the relative intensity of alpha power
between right and left hemispheres provided an index that could be used to predict both accuracy
and reaction times. Specifically, more accurate and rapid responses were associated with a relative
negativity of alpha power in the hemisphere contralateral to the upcoming target. They found that
this difference was largely driven by desynchronization (i.e. – decrease in alpha power) in the
contralateral hemisphere.
However, a subsequent study by Kelly et al. (2006) had contrasting findings. Kelly et al.
noted that previous findings (e.g. - Thut et al., 2006) were made somewhat ambiguous by the fact
that the mere appearance of a cue, as a stimulus onset, would cause alpha desynchronization. To
address this issue, Kelly et al. administered a cueing task in which targets were presented on
placeholders that flashed throughout the trial. In this way, onset-associated alpha
desynchronizations could reasonably be said to be equated between the pre cue and post cue
intervals. Under these conditions, Kelly et al. found that strong increases in alpha power were
corresponding to to-be-ignored regions. While their task did not include distractors, per se, it did
include an array of 8 placeholders, representing potential target locations, arranged in a circle. Rihs
et al. speculated that participants may have needed to actively suppress these locations, which
effectively gave them a “distracter-like” status.
Thus far, studies had either found evidence for attention related increases in alpha power,
corresponding to distracter suppression, or decreases, corresponding to target facilitation, but not
both. This would seem to suggest that the pattern of oscillation was task-dependent in some way.
Rihs, Michel and Thut (2009) disambiguate the relationship by breaking down the distribution of
anticipatory alpha into earlier and later periods, corresponding to the shifting and maintenance of
attention, respectively. Rihs et al. had participants perform a cueing task in which they were
required to discriminate between a + and a letter x. The centrally-presented arrow cue was either
75% or 95% valid (blocked), and the cue-target interval could be either 700ms or 1900ms (within
a block). Only the long delay (1900ms) trials were analyzed, as these would contain both a period
of initial preparation (0 – 700ms) and a period of sustained attention, once the participant realized
that the target was not appearing right away (700 – 1900ms). Specifically, alpha power was
analyzed for the intervals of 500 – 700ms and 1700-1900ms. Both periods were characterized by
a relative imbalance of alpha power, such that more alpha power was observed over the
target-ipsilateral hemisphere. Critically, in the early phase, this imbalance was found to be driven by a
relative decrease in alpha power in the contralateral hemisphere, whereas in the late phase it was
driven by a sustained increase in the ipsilateral hemisphere. Rihs et al. attributed these different
Gamma-band oscillations (30-120 Hz)
Owing to their smaller amplitude and higher frequency in the EEG, gamma-band
oscillations (30-120 Hz) cannot typically be detected by visual inspection of the EEG. Research
on gamma activity therefore began later, especially with regard to human populations. The earliest
evidence of gamma’s functional role came from intracranial recordings in animals (Eckhorn et al.,
1988; Gray, Konig, Engel, & Singer, 1989; Gray & Singer, 1989; Singer, 1993). In both cats and
monkeys, distinct areas of visual cortex were observed to oscillate synchronously at 30 Hz and
above when the animal was presented with a visual stimulus. It was therefore suggested that this
synchronization might represent an answer to the so-called “binding problem” (Roskies, 1999;
Von Der Malsburg, 1994, 1999). In brief, the binding problem consists of an explanatory gap in
our understanding of visual perception. If different features of a single object (e.g. - shape,
movement, color, spatial location) are represented by distinct, distributed neural populations, how
does the visual system determine which features belong to which object in a complex visual scene?
It was suggested by the authors cited above that the features of a given object are “bound” together
by the synchronous oscillation of the neural populations that underlie those features (Gray, 1999).
The first evidence for such a mechanism in humans came from Müller et al. (1996), who
recorded subjects’ EEG while they observed either a single moving bar (coherent motion
condition) or two bars moving in opposite directions (incoherent motion condition). Compared to
incoherent trials, neural responses to coherent trials consisted of increased power in the 40 – 96
Hz range over parieto-occipital sites contralateral to the moving bar. Müller et al. attributed this
difference in gamma power to the fact that all active neurons were responding to a single stimulus,
Given that selective attention had already been proposed as the cognitive mechanism by
which an object’s features are bound together (Treisman's 'Feature Integration Theory'; Treisman
& Gelade, 1980; Treisman, 1996), Müller and colleagues (Gruber, Müller, Keil, & Elbert, 1999)
proceeded to investigate the relationship between selective attention and gamma oscillations. In
this experiment, subjects viewed displays containing many rectangles of different dimensions and
colors. Following the presentation of a central arrow, which pointed to the left or right, the
rectangles would change color several times. Subjects were required to attend to the side indicated
by the arrow and to count the number of rectangles of a target color. In addition, as the rectangles
changed color, one half of the display (left or right) would rotate horizontally. Gruber et al found
that i) gamma power (35 – 51 Hz) was significantly higher over parieto-occipital sites contralateral
to the rotating side ii) following the cue, the spatial distribution of gamma power was observed to
shift from a general posterior distribution to a more focal peak over parieto-occipital sites in the
hemisphere contralateral to the to-be-attended side, and that iii) the rotating side of the display
elicited the highest intensity gamma oscillations when it was also the attended side. Thus, Gruber
et al. replicated their previous finding that a moving stimulus elicits increased gamma synchrony
generally and, critically, found evidence suggesting that the strongest gamma synchrony occurs
when that stimulus is the focus of attention.
Thus it seems that selective attention is associated with increased gamma synchrony in the
hemisphere corresponding to the attended hemifield. This characterization has since been further
refined in several studies. Tallon-Baudry, Bertrand, Hénaff, Isnard and Fischer (2005), for
example, found that attention-associated increases in gamma (30 – 130 Hz) power occur in both
lateral-occipital cortex and the fusiform gyrus, but that these areas have distinct patterns of local
electrodes for pre-surgical localization of their seizure focus. Tallon-Baudry et al. had these
patients perform a delayed matching to sample task in which they made judgments about abstract
shapes that appeared at fixation. In the control task, the first stimulus would appear, but the second
would not and, instead participants had to judge whether the fixation cross had changed luminance.
Thus, in the main task, the first stimulus had to be attended, but in the control task it did not.
Tallon-Baudry et al found that attention enhanced gamma synchrony in the fusiform gyrus during
stimulus processing, whereas gamma in lateral occipital cortex was most pronounced in the period
anticipating a to-be-attended stimulus and actually decreased during stimulus presentation. This
may suggest that posterior gamma is especially associated with anticipatory attention.
In addition to playing different roles in different cortical areas, there is also evidence that
gamma oscillations have different roles depending on the particular sub-band within the gamma
range of frequencies. Vidal, Chaumon, O’Regan and Tallon-Baudry (2006) found evidence that
visual grouping and selectively attending are associated with distinct gamma sub-ranges. Subjects’
MEG was recorded while they performed a novel delayed-matching to sample task in which each
trial presented 8 bars, each with a unique orientation, distributed in a circle around fixation. In the
single group condition, each bar was half red, half green; in the other conditions, the bars were
divided into two groups: 4 completely red, 4 completely green. In the single group condition,
participants were always required to attend to and remember the whole display and, after a delay,
indicate whether the test display contained a bar whose orientation had changed. In the two-group
conditions, participants were either required to attend to and remember all 8 bars (indicated by a
yellow fixation cross) or just one color of bar (indicated by a red or green cross). Vidal et al.
compared the MEG frequency spectrum across conditions during the window 200 – 400 ms after
sensors, specifically in the 70 – 120 Hz range, which was significantly more pronounced in the
single-group condition, as compared to the two-group conditions, which did not differ significantly
from each other. Vidal et al. attributed this peak to a grouping process, which would explain why
less synchrony was observed with two distinct groups. Furthermore, they found a low-gamma peak
at right parietal sensors, specifically in the 44 – 66 Hz range, but only in those conditions where
participants were required to attend selectively to a sub-group of bars (red or green). Vidal et al.
associated this gamma activity with the process of attentional focusing.
In addition to binding and attentional selection, there is evidence that gamma activity may
also be involved in voluntary attentional shifting. Landau, Esterman, Robertson, Bentin and
Prinzmetal (2007) recorded participants’ EEG while they performed a simple face discrimination
cueing task in which the spatial cue, a peripheral flash, was either predictive (70% valid, 15%
invalid, 15% no target) or non-predictive (40% valid, 40% invalid, 20% no target). Participants
had to indicate which of two faces appeared as the target by pressing one of two keys; a third key
was to be pressed if no target appeared. A time-frequency analysis of the EEG data revealed
significantly more energy in the 30 – 70 Hz band during periods where voluntary orienting of
attention would be expected, compared to conditions in which no reorienting would be expected.
That is, increased gamma was observed following a predictive cue and following a target that
appears in an unexpected location (thus requiring the participant to voluntarily reorient her
attention), but not following a non-predictive cue (which would trigger an involuntary shift of
attention) or following a target that appears in the expected location (which would not require an
attention shift).
Further evidence for the involvement of lateralized gamma in orienting attention to one
EEG while they performed a simple spatial cueing task (similar to that of Worden et al. (2000),
reported in this paper’s section on alpha oscillations). A non-predictive, central arrow directed
participants to shift their attention to the left or right side of a display where, after a brief delay, a
target would appear. Participants were to respond only to targets that appeared on the cued side,
and only for one of two possible target identities. In the period roughly 240ms – 380ms after cue
onset, Doesburg et al observed a prominent increase in gamma (36 – 43 Hz) synchrony within
parietal cortex on the side contralateral to the cued hemifield (electrode P7 or P8) and multiple
other cortical areas.
Neurostimulation
While neuroimaging techniques have provided unprecedented insight into the links
between brain and behavior, they are not without their limitations. Boundaries of spatial and
temporal resolution aside, the evidence obtained using these methods is ultimately correlational,
showing that a given behavior is associated with a particular change in neural activity.
Demonstrating causality would require directly influencing a given brain region and then
observing the behavioral consequences.
In the past, human lesion studies have provided valuable insight in this regard, insofar as a
loss of function following damage to a particular brain area implies the causal involvement of that
brain area in facilitating that function. The most well-known example of this type of inference
involving attention is that of hemispatial neglect (Heilman & Van Den Abell, 1980). A neglect
patient, despite having apparently normal vision, chronically fails to acknowledge one side of
space, typically the left (e.g. - Mesulam, 1981; Ro & Rafal, 1996). Post-mortem inspection and/or
the neglected side. While often insightful and thought provoking, such studies necessarily suffer
from a substantial lack of experimental control. For one thing, patients tend to have fairly
widespread lesions that are rarely fully the same between two individuals, which makes it difficult
to relate lesion to symptom beyond a rather general level of description (e.g. - Vallar, 1998).
Moreover, since subjects are typically recruited post-lesion, it is impossible to determine the extent
of a subject’s impairment compared to their pre-lesion ability. That is, a particular patient typically
becomes known to a researcher because of their impairment, and there is likely little to no
documentation of their prior abilities for comparison.
In recent decades, neurostimulation has emerged as a potential solution to the
above-mentioned problems (e.g. - Peterson & Deer, 2013). By directly influencing (enhancing or
impairing) brain activity via the application or induction of an electric current, neurostimulation
offers the possibility of establishing a causal relationship between particular brain structures and
their associated functions (Hallett & Hallett, 2007; Parkin, Ekhtiari, & Walsh, 2015). Since
stimulation is controlled by the experimenter, it can be applied at a consistent (and relatively
precise) location, and performance can be measured before, during and after stimulation.
The earliest such technique, transcranial magnetic stimulation (TMS; Barker, Jalinous, &
Freeston, 1985), stimulates a brain region by delivering magnetic pulses very close to the scalp,
which, in turn, induce transient currents in the underlying neural tissue. This stimulation is thought
to temporarily inhibit activation of the stimulated region, which may then disrupt performance
(though a recent review by Luber and Lisanby [2014] has shown that there are many instances in
which performance is actually enhanced). If performance is disrupted, the inhibited neural region
is inferred to be necessary in producing the goal behavior, and not necessary if performance is not
in trains of pulses. The latter technique is typically referred to as repetitive TMS (rTMS). This
technique may be used to produce longer-lasting disruptions or facilitations of neural function and,
as will be discussed, may even be able to induce endogenous oscillations with the same frequency
as the stimulator’s pulse rate. This technique allows for more complex experiment designs that
may be used to answer more sophisticated causal questions (Fitzgerald, Fountain, & Daskalakis,
2006; Pascual-Leone, Walsh, & Rothwell, 2000).
Somewhat more recently, a group of techniques have been developed in which electrical
current is passed through the cortex via rubber electrodes applied to the scalp. These include
transcranial direct current stimulation (tDCS), transcranial alternating current stimulation (tACS),
oscillatory tDCS (o-tDCS), and transcranial random noise stimulation (tRNS). Now collectively
referred to as transcranial electrical stimulation (tES), these techniques differ primarily in the
parameters of the applied current (Paulus, 2011). As its name implies, tDCS involves delivering
direct current, that is, current of a constant intensity and direction. Thus, there is a positive, or
anodal, electrode, and a negative, or cathodal, electrode (Gandiga, Hummel, & Cohen, 2006).
Facilitatory effects tend to be observed at the anodal site, while inhibitory effects are more
commonly observed at the cathodal site (Coffman, Clark, & Parasuraman, 2014). tDCS is most
clearly contrasted with tACS, in which the current direction and intensity vary in a periodic
fashion. O-tDCS delivers an alternating current with a constant DC offset, whereas tRNS delivers
an alternating current that varies randomly (i.e. – noise). As this study employed tACS, this
technique will be explained in further detail (but see Herrmann, Rach, Neuling, & Strüber, 2013,
and Paulus, 2011 for further description of all the techniques).
electrode is typically smaller and placed over the brain area of interest. “Alternating” refers to the
fact that the strength and direction of the applied current varies in a sinusoidal pattern around a
neutral current of 0 mA. The usefulness of this particular technique lies in the fact that the
frequency of stimulation can be precisely controlled, which induces the effects of endogenous
oscillations of that frequency at that location (e.g. - Kanai, Chaieb, Antal, Walsh, & Paulus, 2008).
Thus, tACS holds potential for determining causality in the correlational associations that have
been demonstrated in previous EEG frequency research. This is the goal of the proposed study.
Rhythmic neurostimulation studies: rTMS and tACS
As previously discussed, the neuroimaging literature has provided compelling evidence
that alpha and gamma neural synchrony are strongly associated with preparatory attention, in a
spatially-specific fashion. However, this technique cannot absolutely confirm that such activity
causes changes in attention. It could be the case that these oscillations are simply so-called
epiphenomena (Clayton et al., 2015), or that they are necessary, but not sufficient to cause shifts
of attention. In attempts to demonstrate that it does have a causal role, neurostimulation techniques
that can deliver rhythmic stimulation, brief or continuous, should be valuable, as these may have
the potential to simulate and/or induce oscillatory activity in the target band (Thut, Schyns, &
Gross, 2011). The following section will discuss studies that have used repetitive transcranial
magnetic stimulation (rTMS) and tACS.
Klimesch et al. (2003) provided early indications that rTMS could be used to modulate
attention performance. Participants performed a mental rotation task that is part of a standard
German IQ test, in which they had to say which of 6 rotated cubes matched the target cube (cube
of 24 TMS pulses was delivered at the participant’s upper individual alpha frequency (IAF+1)
over mid-frontal (Fz) and right-parietal (P6) cortex. Control conditions included sham IAF+1
stimulation (stimulator rotated 90 degrees) over parietal cortex, as well as lower-alpha (IAF-3) and
beta (20 Hz) stimulation. IAF+1 stimulation led to improved task performance, whereas the control
conditions did not differ from one another. Thus, it seemed that alpha stimulation could improve
performance in a general way, though this could not be attributed to modulated spatial orienting,
specifically, so much as overall increased focus.
Romei, Gross, and Thut (2010) did investigate the effects of alpha rTMS on the spatial
distribution of attention. Participants performed a simple detection task in which targets appeared
on the left or right side of a display after the appearance of a fixation cross. There was no spatial
cue. Prior to target appearance, rTMS was applied over left or right parietal or occipital cortex.
The stimulation frequency of interest was 10 Hz. This was contrasted with sham stimulation, but
also 5 Hz and 20 Hz stimulation as higher- and lower-frequency active controls. With 10 Hz
stimulation, Romei et al. found that target detection was impaired in the hemifield opposite the
side of stimulation and enhanced in the ipsilateral hemifield. However, neither of these effects was
observed with 5 or 20 Hz stimulation. These results suggest that 10 Hz (alpha) oscillations play a
unique role in selective attention.
The results of Romei et al. (2010) certainly add considerable support to the notion that
alpha oscillations are causally involved in the allocation of attention. However, rTMS has some
technical limitations that may warrant caution in the interpretation of their results. First, the
stimulation delivered was sudden and brief, as is necessarily the case with rTMS. Moreover, Romei
influence attention, rTMS cannot inform us as to how more sustained alpha activity may play a
role. As Rihs et al. (2009) demonstrated that brief and sustained changes in alpha may have
different effects, understanding the role of sustained alpha is critical. Second, and perhaps more
problematic, is the fact that rTMS pulses only very roughly approximate the sinusoidal form of an
endogenous alpha oscillation (Herrmann et al., 2013). While the TMS pulses are evenly spaced in
time at the appropriate frequency (e.g. – 10 Hz for alpha), simulating the peaks of a sine wave, the
pulses themselves essentially produce a very brief burst of noise (i.e. – delivering power across a
broad range of frequencies).This makes it more difficult to attribute the results of such stimulation
to modulation in the alpha-band, specifically, since other frequencies are produced, albeit less
strongly. tACS, by contrast, delivers a single frequency of stimulation, and can do so for prolonged
periods (again, see Herrmann et al., 2013). This may make it better suited, or at least
complementary to rTMS, as a method for causal testing of neural oscillations.
To my knowledge, tACS has so far been used in only one study to examine the effects of
alpha power on the spatial distribution of attention (Brignani, Ruzzoli, Mauri, & Miniussi, 2013).
This study applied lateralized tACS at frequencies in the theta, alpha and beta ranges, but failed to
produce hemisphere-specific effects. Based on their results, Brignani et al. speculated that tACS
may not be as effective as hoped in modulating endogenous oscillations. There are, however,
several reasons, which I will outline below, that I believed this to be a premature conclusion.
Brignani et al. had participants perform a detection and discrimination task while receiving tACS
stimulation over electrode sites PO7 or PO8 of the 10/10 electrode placement system (Jurcak,
Tsuzuki, & Dan, 2007). Participants were required to indicate the presence/absence and orientation
of a Gabor patch that could appear to the left or right of fixation. The target was preceded on all
evidence to the association between alpha (10 Hz) oscillations and lateralized attention. In addition
to 10 Hz stimulation and sham conditions, they included one lower-frequency (6 Hz) and one
higher-frequency (25 Hz) condition as active controls. Brignani et al. found that both 6 Hz and 10
Hz stimulation impaired detection performance, compared to baseline, but no other effects of
stimulation were found. Critically, Brignani et al. reported that the observed impairment did not
show retinotopic specificity. That is, impairment was observed regardless of which hemisphere
was stimulated. Based on the observed effects, which were not as specific as hypothesized,
Brignani et al. questioned whether tACS was effective at modulating brain oscillations. While the
researchers’ concern is understandable, it may be premature, considering the limitations of their
study design. The task itself may not have been optimal for finding effects of the tACS. There was
no spatial cue, but at the same time the detection/discrimination task was quite difficult, which
likely would have led participants to adopt an alert but diffuse attentional state in the period
between the warning signal and the target. This could partly explain Brignani et al.’s failure to find
the expected effects of alpha oscillations, as such an alert state would likely be reflected in overall
low alpha activity, whereas (Rihs et al., 2009) only found alpha effects in those participants that
had higher baseline levels of alpha activity. Moreover, the task instructions emphasized that
participants should prioritize accuracy over speed, and participants were given 1500ms to make
their presence/absence judgements and another 1500 to make the orientation judgement. This
allows for considerable post-target processing and opportunities for the stimulation to interfere in
ways that were not germane to the researchers’ hypotheses. Relatedly, Brignani et al. only
measured accuracy, whereas EEG studies have found associations of alpha power with both
accuracy and reaction time (Rihs et al., 2007, 2009; Thut et al., 2006). Also, increased alpha power
et al., 2000), so it is less clear what should be expected to happen when alpha stimulation is applied
in a task with only targets and no distracters.
Researchers have also utilized tACS in hopes of influencing attention via stimulation in
the gamma band. Laczó, Antal, Niebergall, Treue, and Paulus (2012) had participants detect
random dot patterns (RDPs) that would appear randomly at one of eight positions (4 were to the
left or right of fixation, just above or below the horizontal meridian; the other 4 were above or
below fixation, just to the left or right of the vertical meridian). Prior to the appearance of the RDP,
a noninformative peripheral cue could appear to the left or right of fixation, capturing the
participant’s attention to that side of the display. During the task, 40, 60 or 80 Hz stimulation or
sham stimulation was administered over primary visual cortex (area V1). Compared to sham
stimulation, Laczó et al. found that 60 Hz stimulation led to increased contrast sensitivity, but no
other effects, perceptual or attentional, were found. The positive result seems consistent with other
studies that report an association of posterior gamma with perceptual grouping and/or binding
(Tallon-Baudry et al., 2005; Vidal et al., 2006). Moreover, the lack of attention effect also seems
consistent with studies that report lateralized gamma being associated with attention (Doesburg et
al., 2008; Gruber et al., 1999; Vidal et al., 2006). Since Laczó et al. only stimulated at the occipital
pole, one would not expect them to find effects on attentional orienting.
Multiple studies have demonstrated that both alpha and gamma power over
parieto-occipital cortex varies as a function of recorded hemisphere and attended visual hemifield, such
that alpha decreases contralateral to the to-be-attended hemifield and increases in the to-be-ignored
hemifield (Sauseng et al., 2005; Worden et al., 2000), and the opposite pattern holds true for
gamma (Doesburg et al., 2008; Gruber et al., 1999; Vidal et al., 2006). However, it has been less
of some stimuli and increased inhibition of others, that is, attentional selection. It is therefore the
aim of the proposed study to modulate neural oscillations in the alpha and gamma bands, using
CHAPTER 2: METHODS
Participants
Twenty-three healthy young adults (ages 18-27; 14 female) participated in all conditions
and were included in the analyses. Participants were all right-handed, with 20-20 or corrected to
20-20 vision and no history of psychiatric illness, neurological disorder or incident (such as
concussion). The original sample contained 28 participants, but five subjects were excluded
because it was unclear if they understood and followed the instructions; their behavioral results
in the no-stimulation (‘sham’) condition showed an inverted validity effect in the endogenous
condition, with faster and more accurate responses at the to-be-ignored location. Since the
purpose of this experiment was to investigate how neural stimulation may modulate the standard
attention cuing effect (i.e., improved performance at the attended location versus the
to-be-ignored location in the endogenous condition), we excluded subjects who showed the opposite
pattern in the baseline (i.e., sham/no-stimulation) condition.
Design
A within-subject experimental design was used. There were three stimulation conditions
and, during each stimulation session, participants completed two spatial cueing tasks—one to
assess voluntary attention and one to assess reflexive attention.
In previous rTMS and tACS studies, 10 Hz has been the most commonly used frequency
choice is justified not only because it falls in the middle of the alpha range, but because, barring
the concurrent use of EEG (which is not practicable for this study), 10 Hz is likely the best
approximation of individual peak alpha (Haegens et al., 2014). Thus, 10 Hz was used in the
proposed study to approximate alpha.
The choice of frequency to approximate gamma was made more difficult by the fact that
the band is very wide (30 – 120 Hz) and attention has been associated with oscillatory activity in
a number of sub-bands within this range. However, those studies that looked specifically at
focused attention (Doesburg et al., 2008; Gruber et al., 1999; Vidal et al., 2006) found that
synchrony was most prominent in the lower part of the gamma range, around 40 Hz. Since we
were interested in selective attention, specifically, 40 Hz was chosen as the representative
gamma frequency.
In addition to these two conditions, which served as active controls for one another, a
sham condition was used. Sham conditions are typical in tACS studies (Brignani et al., 2013;
Laczó et al., 2012) and involve turning on stimulation for a brief period (no more than 30
seconds) before gradually ramping the intensity down to zero. This allows for the mild tingling
sensation that some participants feel at the onset of stimulation (e.g. - Kanai et al., 2008), which
gives the participant the impression that they are being stimulated, but is brief enough as to not
have a lasting effect. In this experiment a 25 Hz sham was used, chosen because it is midway
between the two experimental stimulations and to ensure that neither of the active stimulation
frequencies occurred more often in the experiment.
Both cueing tasks required participants to discriminate between two target types: a circle
at its bottom. Practice always began with 90 degrees for the large gap. If, after several practice
blocks, a participant’s accuracy remained below 75%, the large gap was changed to 135 degrees.
In the voluntary task, rather than directing attention with a central symbolic cue on every
trial, the target appeared on one side of the display (right or left) on 80% of all trials. The more
likely side changed every 20 trials, alternating between left and right. This change was indicated
by an arrow that appeared at the center of the screen before each chunk of 20 trials. Note that
most studies of voluntary orienting cue the subject to shift their attention on every trial (e.g. -
Jonides, 1981). We chose to manipulate voluntary attention in a blocked fashion because
changes in alpha power during a shift of attention (decrease in power over the contralateral
hemisphere) are opposite those observed during the sustaining of attention (increase in power
over the ipsilateral hemisphere) (Rihs et al., 2009). As the hemisphere of stimulation would by
necessity stay the same throughout a block, clearer conclusions could be drawn from a paradigm
that engaged only one part of this process (sustaining attention). Targets that appeared on the
predicted side were termed valid, while targets that appear on the opposite side were termed
invalid. Thus, the voluntary task followed a 2 (validity: valid, invalid) x 2 (target side: left, right)
x 3 (stimulation condition: 10 Hz, 40 Hz and sham) within-subjects factorial design.
The reflexive task employed non-predictive, peripheral onset cues, similar to those that
have been used in previous studies of reflexive attention (Jonides, 1981; H. J. Müller & Rabbitt,
1989; Posner, 1980). The goal here was to assess the effect of alpha and gamma oscillations on
resistance/susceptibility to distraction. To assess how response to the peripheral cue changes
with time, two cue-target stimulus onset asynchronies (150ms and 300ms) were used, to assess
the time-course of this process. These times were selected to evenly divide the post-cue interval
(Klein, 2000), which was not of interest in this study. Targets that appear on the same side as the
preceding cue were termed cued, while targets that appear on the opposite side were termed
uncued. Thus, the design of the reflexive task was 2 (target cuedness: cued, uncued) x 2 (target
side: left, right) x 3 (stimulation condition: 10 Hz, 40 Hz and sham), within subjects.
After practice, the experiment consisted of 6 blocks: 1 reflexive and 1 voluntary for each
stimulation condition. Which task comes first was counterbalanced between participants. The
order of the stimulation conditions was counterbalanced as follows (with A=10 Hz, B=40 Hz,
and C=Sham): ABC, BCA, CAB, CBA, BAC, ACB. Subjects were assigned in that order as they
are enrolled (and after every 6th subject, the sequence repeated).
The dependent measures were the continuous variables reaction time and accuracy.
Reaction times were measured in milliseconds and refer to the manual response time (button
press) that the subject makes upon discriminating the target, measured from time of target onset.
Accuracy refers to the percentage of targets accurately discriminated by the subject.
Materials & Procedure
Experiment sessions were conducted in an electrically shielded room. Visual stimuli were
presented on a CRT monitor positioned 75cm from the participant. Participants received, at a
minimum, 2 practice blocks: one for each task (voluntary and reflexive). This was to allow them
to get used to the task and to covertly orienting their attention (with eyes fixed on the central
cross). If the participant’s accuracy on the practice for either condition is less than 75%, the task
instructions were either clarified or the large gap changed from 90 to 135 degrees, depending on
participant was able to perform at an acceptable level before beginning the experiment proper.
Practice trials were not analyzed.
The experimental blocks of the voluntary task consisted of 80 trials each, yielding 8 left
invalid, 8 right invalid, 32 left valid and 32 right valid trials. The experimental blocks of the
reflexive task consisted of 64 trials, yielding 16 left uncued, 16 right uncued, 16 left cued and 16
right cued targets.
Stimuli were presented and responses recorded using Presentation software (v.18.1;
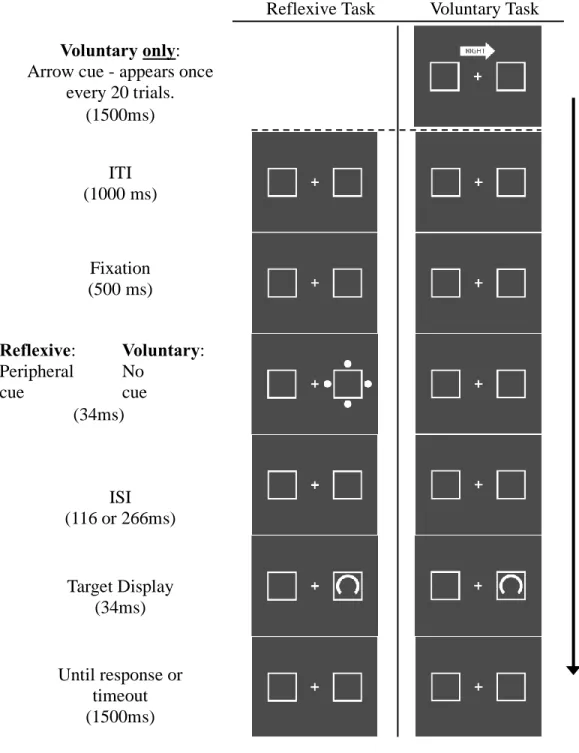
www.neurobs.com). The trial sequence for reflexive task (Figure 1) took place on a static, gray
background (RGB = 75, 75, 75) with a white fixation cross and two white peripheral boxes.
Trials began with a 1000ms inter-trial interval (ITI), followed by a 500ms fixation period, after
which the cue (four dots centered on the outer edges of one box) appeared for 34ms, followed by
an inter-stimulus-interval (ISI) of either 116ms or 266ms, resulting in a stimulus onset
asynchrony (SOA) of either 150ms or 300ms. The target was then presented for 50ms.
Participants were required to indicate whether the gap was large or small as quickly as possible.
Trials timed out after 1500ms. The voluntary task was much like the reflexive task, with the
following exceptions. There was no peripheral cue: an added delay of 150ms or 300ms still
occurred, but without a cue. The target appeared on one side of the screen on 16 out of every 20
trials (80%) and this side changed every 20 trials. The change was indicated by an arrow that
appeared above fixation for 1500ms before the start of the trial, pointing left or right, with the
corresponding word inscribed.
Stimulation was delivered using the NeuroConn DC-Stimulator Plus. Electrode pads
electrode was placed over location P6 of the 10-20 standard system for electrode placement,
corresponding roughly to the right angular gyrus (Herwig, Satrapi, & Schönfeldt-Lecuona,
2003). The larger (5 x 7 cm), reference electrode was placed over Cz, at the intersection of
sagittal and coronal midlines. The pads were placed at the beginning of the experiment session,
but stimulation was not applied during practice. In all three stimulation conditions, the current
had a maximum amplitude of 1mA (2mA peak-to-peak). In the sham condition, 25 Hz
stimulation was applied for 30 seconds and then ramped down to achieve the light itching
sensation that some individuals feel at the beginning of stimulation. In all cases the block was
only started 45 seconds to one minute after the beginning of stimulation so that the sham
CHAPTER 3: RESULTS
Manual reaction times for correct trials were first submitted to a 2 × 3 × 2 × 2 analysis of
variance (ANOVA), with factors of attention condition (endogenous, exogenous), stimulation
(alpha, gamma, sham), visual field of target (left, right), and validity (valid, invalid). All results
here are reported with Greenhouse–Geisser correction for non-sphericity, where applicable. The
omnibus analysis resulted in significant main effects of attention condition (F (1,22) = 7.67, p =
.011) and validity (F(1,22) = 20.78, p < .001). The main effect of visual field did not approach
significance (F(1,22) = 0.05, p = .827), and the main effect of stimulation condition was not
significant (F(1.62,35.65) = 2.04, p = .142). Critically, however, there was a significant
three-way interaction between attention condition, stimulation condition, and validity (F(1.67,36.83) =
3.53, p = .047). The only other significant interaction was between attention condition and
validity (F(1,22) = 5.17, p = .033). To further analyze the three-way interaction, we performed
separate analyses for each of the stimulation conditions versus the sham condition (note, these
following analyses would be most comparable to previous stimulation studies that only used one
stimulation frequency along with sham stimulation).
In the analysis of just the 40 Hz (gamma) stimulation versus sham, the 2 × 2 × 2 × 2
ANOVA consisted of the factors attention condition (endogenous, exogenous), stimulation
(gamma, sham), visual field of target (left, right), and validity (valid, invalid). This analysis
revealed significant main effects of attention condition (F(1,22) = 8.38, p = .008), validity (F
(1,22) = 10.60, p = .004), and stimulation (F (1,22) = 4.40, p = . 047). The main effect of visual
significant three-way interaction between attention condition, stimulation condition, and validity
(F (1,22) = 5.14, p = .034). There were no other significant main effects or interactions, although
the two-way interaction of attention condition by validity was near significant (F(1,22) = 4.26, p
= .051). As illustrated in Figure 2 (top), the three-way interaction was driven predominantly by
the effect of gamma stimulation on invalid trials in the endogenous condition. Paired t-tests
confirm this, as the only significant difference was that the responses to invalid trials in the
endogenous condition were faster in the gamma stimulation condition, relative to that same type
of trial in the sham condition (t(1,22) = −2.179, p = .040).
In the analysis of just the 10- Hz (Alpha) stimulation versus sham, the 2 × 2 × 2 × 2
ANOVA consisted of the factors attention condition (endogenous, exogenous), stimulation (10
Hz, sham), visual field of target (left, right), and validity (valid, invalid). This analysis revealed
significant main effects of attention condition (F(1,22) = 5.97, p = .023) and validity (F (1,22) =
19.65, p < .001). The main effects of stimulation (F(1,22) = 0.004, p = .95) and visual field did
not approach significance (F(1,22) = 0.001, p = .98). There was a significant attention condition
by validity interaction (F(1,22) = 6.99, p = .015), and interestingly, there was a marginal
three-way interaction between attention condition, stimulation condition, and validity (F(1,22) = 3.23,
p = .086). There were no other significant main effects or interactions. As illustrated in Figure 2
(bottom), the marginal three-way interaction was driven predominantly by the effect of alpha
stimulation on invalid/uncued trials in the exogenous condition. Paired t-tests confirm this, as the
only difference approaching significance was that the responses to invalid trials in the exogenous
condition was slower in the alpha stimulation condition, relative to that same type of trial in the
sham condition (t(1,22) = 1.87, p = .074). Although any interpretation of these marginal effects
significance following alpha stimulation was in the uncued location target trials in the exogenous
attention condition, whereas the only significant effect of gamma stimulation was for the invalid
trials in the endogenous attention condition.
Analyses of the accuracy of responses was also performed, using the same omnibus
ANOVA as described above, a 2 × 3 × 2 × 2 ANOVA, with factors of attention condition
(endogenous, exogenous), stimulation (alpha, gamma, sham), visual field of target (left, right),
and validity (valid, invalid). This analysis revealed no significant main effects (attention
condition: F(1,22) = 2.124, p = .159; validity: F(1,22) = 0.006, p = .939; visual field: F(1,22) =
0.622, p = .439; stimulation condition: F(2,44) = 1.098, p = .335). There were also no significant
interactions (all p values >.08), as accuracy was consistently high across all conditions (mean
percent correct = 94.1%; range across conditions = 91.9–96.5%). The critical three-way
interaction between attention, stimulation, and validity did not approach significance (F
(1.65,36.26) = 0.864, p = .411). Therefore, there was no evidence for a speed–accuracy tradeoff
CHAPTER 4: DISCUSSION
Different frequencies of neural oscillation are thought to play distinct roles in facilitating
visuospatial attention, but support for such a causal relationship must include experiments that
directly manipulate those oscillations. Here we have found support for a causal role of 40 Hz
oscillations in posterior parietal cortex. Stimulation at this frequency in the gamma band led to
faster reaction times to invalidly cued targets than did sham stimulation. Further specificity of
this effect was seen in that it only affected reaction times in the voluntary attention task.
Critically, we did not find any differences in reaction times between 10 Hz and sham stimulation
during the voluntary attention task, suggesting that the 40 Hz effect was truly frequency-specific
not just a general effect of stimulation vs. sham.
This effect of 40 Hz stimulation that we observed complements Landau et al. (2007), who
found that voluntary shifts of attention, including voluntarily reorienting from an invalidly cued
location, were associated with an increase in gamma-band power. Landau et al. found that this
pattern was associated with both orienting in a voluntary task and reorienting from an invalidly
cued location in both voluntary and reflexive tasks. Our voluntary task involved maintaining
attention at one location on most trials, and only required an attentional shift on invalid trials, so
we cannot speak to how 40 Hz stimulation might influence cued voluntary orienting. Moreover,
during 40 Hz stimulation, we might expect an improvement on the reflexive task in shifting
attention following an invalid exogenous cue, as this is arguably a voluntary shift, and Landau et
such that reaction times were no slower on uncued trials than cued trials (whereas we did get the
normal cueing effect during no-stimulation pilot testing). Since participants’ attention was
apparently not captured to the invalid location, we could not observe how 40 Hz stimulation
might have influenced reorienting to the target. Finally, although gamma oscillations have
previously been associated with perceptual grouping and/or feature binding (Tallon-Baudry et
al., 2005; Vidal et al., 2006), we did not observe evidence of any enhancement in this regard.
That is, if feature binding had been induced by gamma stimulation, we might expect target
discriminability to improve, which would lead to overall faster reaction times during 40 Hz
stimulation, as compared to sham. The fact that we did not find such an effect is in line with
Vidal et al. (2006), who found that attentional focusing was associated with lower gamma over
PPC, but that visual grouping was associated with higher gamma at occipital sites. It also agrees
with the findings of Laczo et al. (2012) that 60 Hz stimulation over the occipital pole, but not 40
Hz, improved contrast sensitivity without having any effect on orienting. Laczo et al. also found
no effect of 80 Hz stimulation, suggesting an upper limit for the frequencies involved in
perceptual feature processing. Our understanding of the role of gamma oscillations in visual
processing would benefit from a design that fully crosses gamma frequencies (40, 60 and 80 Hz)
with stimulation site (occipital, parietal).
While we found no significant effects of 10 Hz stimulation, as compared to sham, there
was a marginal effect, such that invalidly cued targets in the reflexive task were, on average,
responded to more slowly during 10 Hz stimulation than during sham. Acknowledging the
tenuousness of interpreting marginal effects, possible interpretations of these mean differences
will be briefly considered here. Alpha oscillations are frequently associated with active
Gratton, Fabiani, Beck, & Ro, 2009). It may therefore be plausible that the 10 Hz stimulation
condition made target discrimination more difficult, making the (apparently weak) effects of the
exogenous cue noticeable. This account is in line with Brignani et al. (2013), who found that 10
Hz, but not 25 Hz, stimulation impaired detection performance. Brignani et al. also found that 6
Hz stimulation worsened performance; the reason for this is less clear, as theta oscillations are
more typically associated with frontal contributions to attention (Aftanas & Golocheikine, 2001),
alertness (Braboszcz & Delorme, 2011) and cross-frequency coupling (Landau, Schreyer, Van
Pelt, & Fries, 2015).
It is somewhat surprising that our manipulations did not yield any significant effect of
visual hemifield. Previous studies, already described in this paper, have found that stronger alpha
power in one hemisphere is associated with enhanced processing in the ipsilateral hemifield
(Kelly et al., 2006; Rihs et al., 2009; Thut et al., 2006). Conversely, stronger gamma in one
hemisphere has been associated with enhanced processing in the contralateral visual hemifield
(Bosman, Lansink, & Pennartz, 2014). One might therefore expect that applying stimulation over
right parietal cortex would cause faster reaction times ipsilateral to alpha stimulation and faster
reaction times contralateral to gamma stimulation. While our results agree with the overall
associations of gamma facilitating and alpha inhibiting, these effects appear to have manifested
uniformly throughout the visual field in the present study. Reasons that this may be the case are
explored below.
One fact that might explain the lack of lateralized effects is that, while both hemispheres
make contributions to attention, more attentional processing is thought to be done in right
patients with left PPC lesions may have some initial difficulty in attending to the right side of
space, they are far more likely to recover the capacity to attend to the whole visual field
(Mesulam, 1981; Vallar, 1998). This difference has been attributed to the idea that, whereas left
PPC facilitates attending to the right side of space only, right PPC is involved in attending to
both hemifields. It is therefore plausible that our choice of right-hemisphere stimulation had an
effect on both hemifields. This interpretation would seem to be contradicted by Romei et al.
(2010) who found that 10 Hz rTMS to PPC, but not 5 Hz or 20 Hz, slowed responses to targets
appearing in the hemifield contralateral to stimulation, whether stimulation was applied over left
or right PPC. However, it may point to important differences between rTMS and tACS. The
pattern of stimulation is much different in rTMS, both in that it is not sinusoidal (as argued
before) and in that it must be applied in short trains of pulses, separated by periods of
no-stimulation. Though Romei et al. did find frequency-specific effects, and rTMS has been shown
to entrain neural oscillations at the stimulation frequency (Thut, Veniero, et al., 2011), the
short-lived nature of each stimulation burst may cause entrainment that isn’t as strong (and thus
doesn’t affect both hemifields in right PPC stimulation), or leads to less propagation of
stimulation effects than in tACS.
Much research supports the idea that the effects of neural stimulation propagate to influence
regions beyond the site of stimulation. For example, applying sub-threshold 1 Hz rTMS for 1500
pulses has been shown to increase interhemispheric EEG-EEG coherence (Strens et al., 2002)
and 20 minutes of tDCS to the left DLPFC can increase functional resting-state connectivity
between hemispheres. In the case of both techniques, stimulation is applied in a relatively
continuous fashion (the rTMS is applied at a rate of 1 pulse per second, rather than in pulse
unilateral tACS on hemispheric coherence have yet to be studied, it seems plausible that
stimulation of only the right PPC may have affected both hemispheres similarly.
Another possibility is that, rather than stimulation propagating to the contralateral
hemisphere, the contralateral hemisphere had sufficient time to habituate and “rebalance” to the
stimulation. Models have been proposed that emphasize inhibitory (Kinsbourne, 1977) or
excitatory (Bloom & Hynd, 2005) connections in describing callosal interhemispheric
communication. A recent study by Chechlacz, Humphreys, Sotiropoulos, Kennard and Cazzoli
(2015) proposed a hybrid excitatory-inhibitory model and showed that the individual variation in
effects of 10 Hz rTMS to right- and left-PPC can be predicted from the macrostructure and
microstructure of the corpus callosum. The total volume (macrostructure) and anisotropic
properties (microstructure) could be used to predict, respectively, the degree of excitatory and
inhibitory connections between hemispheres, which, in turn, could predict how well the
unstimulated hemisphere is able to rebalance. The extended duration of tACS, by contrast, might
allow the rebalancing process to occur regardless of the structural properties of each individual’s
corpus callosum.
Our results make a novel contribution to the attention literature in demonstrating support for
the causal involvement of low-gamma, but not alpha, PPC oscillations in the voluntary shifting
of visual attention. The 40 Hz stimulation condition facilitated responses to invalidly cued targets
in the voluntary task. However, due to limitations of the voluntary attention task, we cannot
distinguish whether this effect was due to improved disengagement, reorienting or some
combination of both. Future studies could make this distinction by employing a voluntary cueing
however, the benefit was mostly an improvement of disengaging, we would expect to see
benefits only on invalid trials. As mentioned earlier, in this experiment we would have expected
40 Hz stimulation to speed responses to invalidly cued targets in the reflexive task, as well, but
were unable to test this prediction because our exogenous cue was not effective, and reaction
times may have been at floor. Although it isn’t clear why the task didn’t work as it did during
pilot testing, for future studies we will have to revisit the design of this task to ensure a stronger
exogenous cueing effect.
Future studies should also explore different stimulation parameters. Due to practical
constraints, we were only able to stimulate the right PPC, but not the left. Given that the right
hemisphere is more strongly implicated in attention, we might expect to see different effects of
stimulation over left PPC, including, potentially, hemifield-specific effects. Moreover,
paradigms that stimulate both hemispheres and/or different regions of one hemisphere
simultaneously will be critical in advancing our understanding of neural oscillations in attention.
Theta (4 - 8 Hz) oscillations, in particular, are thought to facilitate communication between
different regions which give rise to attention by increasing phase coherence between different
prefrontal regions (van de Vijver, Ridderinkhof, & Cohen, 2011) as well facilitating longer-range
communication (Von Stein & Sarnthein, 2000; Wang, Viswanathan, Lee, & Grafton, 2016).
Future studies may investigate the causal involvement of theta oscillations by stimulating
multiple areas in- or out-of-phase with one another.
More complex techniques of tACS should be also considered in the longer-term. Future
studies may aim to explore the role of cross-frequency coupling in attention (Szczepanski et al.,
2014) by employing more complex patterns of stimulation. Ideally, future studies should employ
tailor stimulation to each participant’s characteristic frequencies of oscillation. Imaging the
effects of neurostimulation, using electrophysiological measures or fMRI and related measures,
will be critical in helping us understand exactly what tACS and other neurostimulation
techniques do, and ultimately interpreting the resulting changes in behavior. Although for the
most part the use of these techniques is largely limited to theoretical research, a deeper
understanding of the mechanisms by which they act will allow for practical applications with
APPENDIX A: FIGURES
Figure 1. Example trial sequences for the reflexive and voluntary tasks. Note that the stimuli have been enlarged for ease of viewing.
Ti
m
e
Reflexive Task Voluntary Task
Fixation (500 ms)
Reflexive: Peripheral cue
Voluntary:
No cue (34ms)
ISI (116 or 266ms)
Target Display (34ms)
Until response or timeout (1500ms)
Voluntary only:
Arrow cue - appears once every 20 trials.
(1500ms)
Figure 2. Mean reaction times for all conditions in the voluntary (left) and reflexive (right) tasks. Top: Gamma vs Sham Bottom: Alpha vs Sham
500 510 520 530 540 550 560 570 580 590
Valid Invalid Cued Uncued
Reac ti on T im e (m s) Gamma Sham 500 510 520 530 540 550 560 570 580 590
Valid Invalid Cued Uncued
Reac ti on T im e (m s) Alpha Sham
Voluntary Reflexive
REFERENCES
Aftanas, L. I., & Golocheikine, S. a. (2001). Human anterior and frontal midline theta and lower alpha reflect emotionally positive state and internalized attention: High-resolution EEG investigation of meditation. Neuroscience Letters, 310(1), 57–60.
http://doi.org/10.1016/S0304-3940(01)02094-8
Barker, a T., Jalinous, R., & Freeston, I. L. (1985). Non-invasive magnetic stimulation of human motor cortex. Lancet, 1(8437), 1106–1107. http://doi.org/10.1016/S0140-6736(85)92413-4
Berger, H. (1929). Das Elektrenkephalogramm des Menschen. Die Naturwissenschaften, 23(8), 121–124. http://doi.org/10.1007/BF01496966
Bloom, J. S., & Hynd, G. W. (2005). The role of the corpus callosum in interhemispheric transfer of information: Excitation or inhibition? Neuropsychology Review, 15(2), 59–71.
http://doi.org/10.1007/s11065-005-6252-y
Bosman, C. a., Lansink, C. S., & Pennartz, C. M. a. (2014). Functions of gamma-band
synchronization in cognition: From single circuits to functional diversity across cortical and subcortical systems. European Journal of Neuroscience, 39(11), 1982–1999.
http://doi.org/10.1111/ejn.12606
Braboszcz, C., & Delorme, A. (2011). Lost in thoughts: Neural markers of low alertness during mind wandering. NeuroImage, 54(4), 3040–3047.
http://doi.org/10.1016/j.neuroimage.2010.10.008
Brignani, D., Ruzzoli, M., Mauri, P., & Miniussi, C. (2013). Is transcranial alternating current stimulation effective in modulating brain oscillations? PloS One, 8(2), e56589.
http://doi.org/10.1371/journal.pone.0056589
Chechlacz, M., Humphreys, G. W., Sotiropoulos, S. N., Kennard, C., & Cazzoli, D. (2015). Structural Organization of the Corpus Callosum Predicts Attentional Shifts after Continuous Theta Burst Stimulation. Journal of Neuroscience, 35(46), 15353–15368.
http://doi.org/10.1523/JNEUROSCI.2610-15.2015
Clayton, M. S., Yeung, N., & Cohen Kadosh, R. (2015). The roles of cortical oscillations in sustained attention. Trends in Cognitive Sciences, 19(4), 188–195.
http://doi.org/10.1016/j.tics.2015.02.004