Microbial diversity of oligotrophic marine sediments
Alan Durbin
A thesis submitted to the faculty of the University of North Carolina at Chapel Hill in
partial fulfillment of the requirements for the degree of Master of Science in the
Department of Marine Sciences
ii
Abstract
Alan Durbin
Microbial diversity of oligotrophic marine sediments
(Under the direction of Andreas Teske)
iii
Acknowledgements
I would like to acknowledge the members of the crew and shipboard scientific party of
cruise Knox02RR, and in particular I thank Jens Kallmeyer, Heather Schrum, Art
Spivack, Jan Fischer, and Tim Ferdelman for providing unpublished data from this cruise.
The help and advice in the laboratory and in writing afforded me by graduate students in
Marine Sciences has been invaluable. I would like to thank my advisor Andreas Teske
and committee members Marc Alperin and Barbara MacGregor for their guidance and
support during the research and writing that went in to this thesis. Finally I thank my
friends and family for their essential support and encouragement, and in particular my
iv
Table of Contents
List of Tables………...……vi
List of Figures………...….vii
List of Abbreviations and Symbols………...…viii
Introduction………...1
Chapter 1. Sediment-associated microdiversity within the Marine Group I Crenarchaeota………..4
Introduction………...4
Results………...6
Discussion………...19
Methods………...23
Chapter 2. Microbial diversity of oligotrophic abyssal sediments at the southern edge of the South Pacific Gyre……….30
Introduction……….30
Results……….31
Discussion…………...………48
Methods………...55
Chapter 3. Abyssal sediment microbial communities: what lives in the other 90% of the seafloor?...60
Introduction………..60
The sedimentary trophic state spectrum………...63
Sampling methods………66
Deep phylogeny of oligotrophic Archaea……….68
Archaeal occurrence trends across sites………...69
v
acceptors……….………..76
Problems for future research………80
Conclusions………..82
Methods………82
Appendices……….85
vi
List of Tables
Table 1. Representative phylotypes for MG-I, based on 3% OTU defintion……….11
Table 2. Average between-clade, within-clade, and maximum within-clade divergence levels for major MG-I subgroups recovered in this study……….12
Table 3. (A). Diversity indices for SPG11/SPG12 MG-I, 1% OTU definition
……….15
(B). Diversity indices for SPG11/SPG12 MG-I, 3% OTU definition……….………16
Table 4. Descriptive characteristics of the novel Euryarchaeotal clades identified in this study………..38
Table 5 (A). Archaeal diversity indices, 1% OTU………..45
(B). Bacterial diversity indices, 3% OTU………..46
Table 6.Comparison of parameters relating to trophic state of sediments………..67
vii
List of Figures
Figure 1. Depth trends in porewater constituents, cell densities and
MG-I subclade abundance at SPG11……….7
Figure 2. SPG12 depth trends in porewater constituents, cell densities and MG-I subclade abundance………..9
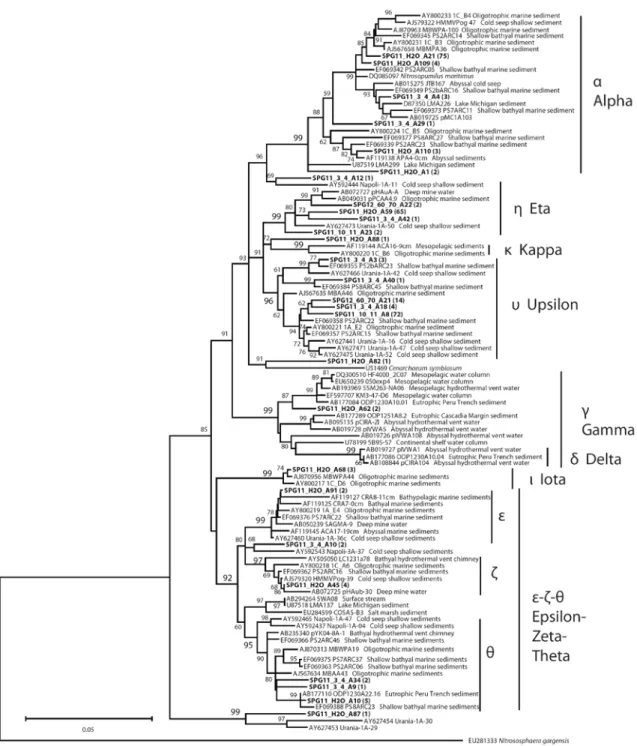
Figure 3. MG-I 16S rRNA gene phylogeny for representative phylotypes from SPG11 and SPG12, using 3% OTU definition………...13
Figure 4. Lineage-through-time plots of cumulative abundance of OTUs vs. distance………..17
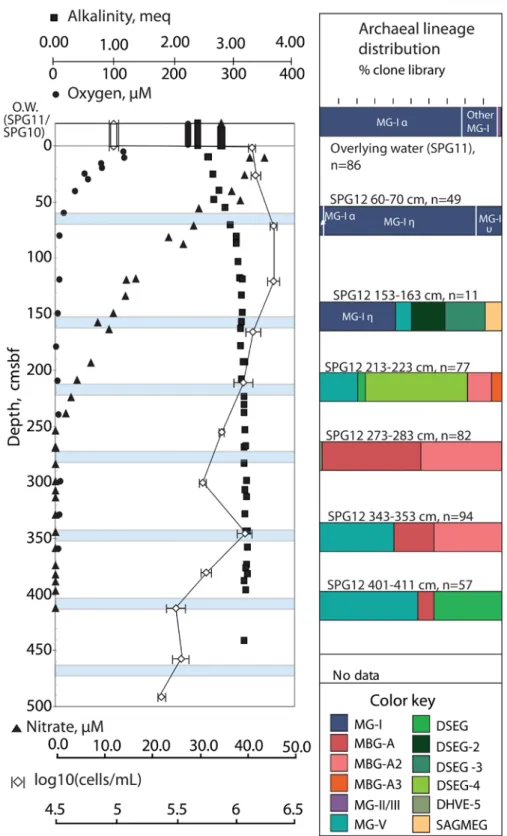
Figure 5. Depth trends in archaeal 16S rRNA clone library composition, porewater constituents, and cell counts………...34
Figure 6. Maximum-Likelihood (ML)- estimated 16S rRNA gene phylogeny of Crenarchaeota……….35
Figure 7. Maximum likelihood (ML)-estimated 16S rRNA gene phylogeny of SPG12 Euryarchaeota……….37
Figure 8. Porewater constituent data, cell counts and bacterial clone library composition (phyla and class/order abundances) at SPG12………40
Figure 9. (A) Neighbor-joining phylogeny of SPG12 Planktomycetes and other bacterial phyla………….41
(B) Neighbor-joining phylogeny of SPG12 Chloroflexi and other bacterial phyla………42
(C) Neighbor-joining phylogeny of SPG12 Proteobacteria and other bacterial phyla………43
Figure 10. Rarefaction analysis at 1% OTU resolution for Archaea and Bacteria……….48
Figure 11. Neighbor-joining (NJ) 16S rRNA gene phylogeny of Euryarchaeota………..70
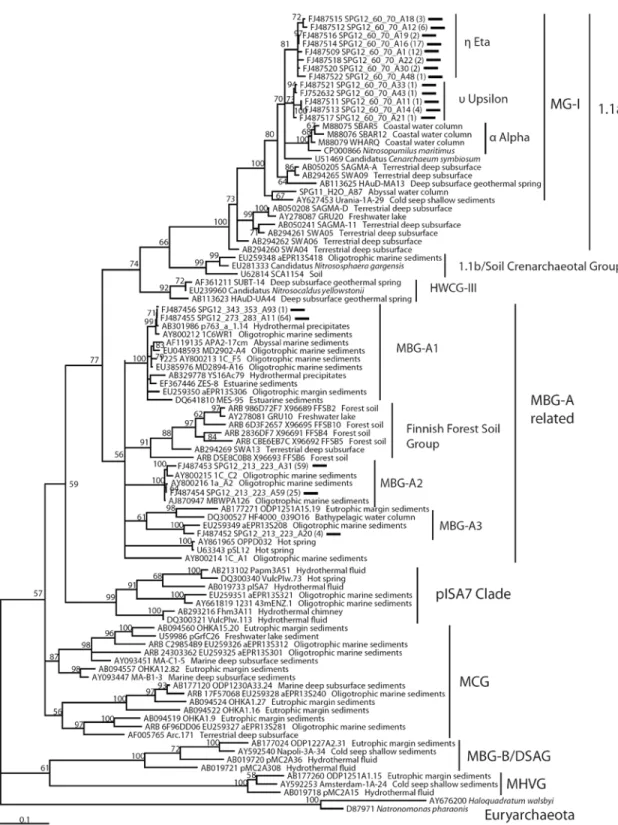
Figure 12. Maximum-likelihood phylogeny of cultured and major uncultured Crenarchaeotal lineages found in oligotrophic sediments………71
Figure 13. Percent-abundance of archaeal phyla, excluding MG-I, in clone libraries from all depths at oligotrophic, mesotrophic, and eutrophic sites described in Table 6 (A), plus additional putatively oligotrophic sites with little or no available geochemical information (B)………..73
viii
List of Abbreviations and Symbols
α……….………...MG-I subclade Alpha
β...MG-I subclade Beta
γ………...MG-I subclade Gamma
δ…………...MG-I subclade Delta
ι………...MG-I subclade Iota
ε……...…………MG-I subclade Epsilon
η…...………….MG-I subclade Eta
κ………...MG-I subclade Kappa
θ…………...………MG-I subclade Theta
υ…………...………..MG-I subclade Upsilon
ζ………...…………MG-I subclade Zeta
AAG………Ancient Archaeal Group
BSA………...Bovine Serum Albumin
DHVE-3………...………Deep Hydrothermal Vent Euryarchaeota 3
DHVE-4……….………..………Deep Hydrothermal Vent Euryarchaeota 4
DHVE-5……….……..…………Deep Hydrothermal Vent Euryarchaeota 5
DHVE-6………...………Deep Hydrothermal Vent Euryarchaeota 6
DHVE-8……….…...………Deep Hydrothermal Vent Euryarchaeota 8
DHVEG-II……...………...………..Deep-sea Hydrothermal Vent Euryarchaeotal Group II
DSAG……….………...…Deep Sea Archaeal Group
DSEG-1……….………..……….Deep Sea Euryarchaeotal Group 1
DSEG-2……….………..……….Deep Sea Euryarchaeotal Group 2
DSEG-3………..……….Deep Sea Euryarchaeotal Group 3
DSEG-4……….Deep Sea Euryarchaeotal Group 4
HWCG-I……….……….…………Hot-Water Crenarchaeotal Group I
ix
HWCG-IIb……….………...………Hot-Water Crenarchaeotal Group IIb
HWCG-III……….………Hot-Water Crenarchaeotal Group III
LMP………..…..Low Melting Point agarose
LPA……….………...…….Linear Polyacrylamide
MBG-A………...………Marine Benthic Group A
MBG-B……….…………..Marine Benthic Group B
MBG-D………..Marine Benthic Group D
MBG-E……….……….…………..Marine Benthic Group E
MCG………....………Miscellaneous Crenarchaeotal Group
MG-I...Marine Group I Crenarchaeota
MG-II...Marine Group II Euryarchaeota
MG-III……….………...……….Marine Group III Euryarchaeota
MG-IV……….………..….Marine Group IV Euryarchaeota
MG-V……….………..……Marine Group V Euryarchaeota
ML……….……….………….Maximum Likelihood
ODP………..Ocean Drilling Program
OTU……….……….Operational Taxonomic Unit
SAGMEG……….……….South African Gold Mine Euryarchaeotal Group
SPG10……….……….South Pacific Gyre Site 10
SPG11……….………..…………South Pacific Gyre Site 11
SPG12………..South Pacific Gyre Site 12
ThetaYC...Yue and Clayton’s (2005) similarity index
Microbial Diversity of Oligotrophic Marine Sediments
Introduction.
Marine sediments constitute one of the largest biomes, by area and volume, on planet Earth, and have been shown to host microbial communities that may account for 1/10thto 1/3rdof global microbial biomass (Parkes et al. 1994, Whitman et al. 1998). Organic carbon hundreds of thousands to millions of years old sustains active microbial communities (e.g.,Wellsbury et al. 2002, D’Hondt et al. 2004, Parkes et al.2005, Biddle et al. 2006) with extraordinarily slow community turnover rates of centuries or more (Biddle et al. 2006). Studies of deep marine sediments have so far focused on continental margin
sediments, where the bulk of carbon burial (Dunne et al. 2007) and large-scale production and consumption of methane (D’Hondt et al. 2002, 2004) occur. Here sulfate, a relatively low-energy electron acceptor, is consumed slowly over a scale of meters to hundreds of meters, compared to centimeters to meters in the estuarine sediments, due to lower organic substrate input rates. Beneath the sulfate reduction zone only the least energetically favorable electron acceptors persist, such as CO2or oxidized portions of organic molecules. Thus, as a result of electron donor limitation, availability of only low-energy electron acceptors, or both, the continental margin deep subsurface exhibits strong energy limitation.
2
This energy limitation occurs despite the advantages offered by high-energy oxidants: the slow
flux of carbon substrates means high-energy electron acceptors are available over a much wider sediment
depth range in the oligotrophic seafloor compared to the continental shelf. Although in broad view,
continental margin sediments can be regarded as anoxic, often there are spatially compressed, millimeter or
centimeter-scale oxic/suboxic zones at the sediment-water interface (where suboxic is defined by the
absence of oxygen and lack of sulfide, indicating minimal net sulfate reduction). At least in the case of
oxygen, the expanse of these strata principally determines burial efficiency in organic-rich sediments
(Hartnett et al. 1998). The greatly expanded oxic or suboxic zones of oligotrophic sediments may be more
easily-accessible analogues of the compressed oxic and suboxic zones in organic-rich sediments.
Alternatively, the combination of low electron donor availability and high sediment oxidation state may
pose unique challenges for microbial life, shaping a fundamentally different habitat in oligotrophic
sediments. Lower organic carbon concentrations may come in the form of the least preferable, most
recalcitrant molecules (Wakeham et al. 1997, Hedges et al. 2001, Lee et al. 2004), and may be more
inaccessible due to adsorption to minerals (lower organic carbon production means a lower carbon/mineral
ratio; Dunne et al. 2007). Oligotrophic suboxic or oxic sediments may be fundamentally different from
oxic/suboxic strata atop eutrophic sediments due to the interactive effects of different variables, such as the
combination of high sediment oxidation state and low electron donor availability, leading to higher
biosynthesis costs as a proportion of cellular energy budget (McCollom and Amend 2005). Finally,
different suboxic redox processes are possible in neutral pH, non-sulfidic oligotrophic sediments than in
suboxic acidic and/or sulfidic margin sediments (Schippers and Jørgensen 2001, 2002, Severmann et al.
2006).
The dominant uncultured archaeal lineages identified in the marine subsurface to date (e.g., Teske
and Sørensen 2008) are principally known from environments with relatively low-energy electron
acceptors, such as sulfur, sulfate, and CO2. It is not clear whether the same groups that have been identified
as dominant subsurface lineages also persist in the more extensive habitat of oligotrophic marine sediments,
which are geochemically distinct. Since microbes that specialize in using the most energetic available
electron acceptor are hypothesized to outcompete other subsurface microbes, the most-energetic available
3
expectation is examined in Chapter 1 of this work, a comparison of the archaeal diversity (as revealed in
16S rRNA clone libraries) of an oxic, ultraoligotrophic sediment column at three near surface sediment
depths and the overlying water sample from a multicore; this study examines potential gradients in
microbial diversity between the sediment and water column, and within the sediment itself, when the same
electron acceptor (oxygen) is shared throughout. Chapter 2 looks at the archaeal and bacterial 16S rRNA
gene diversity of an oligotrophic shallow sediment column with oxic and suboxic strata, in conjunction
with porewater chemical data, the first study to do so at high resolution in oligotrophic sediments. Finally,
Chapter 3 examines the oligotrophic seafloor as a potential distinct microbial habitat, compared to the
better-characterized margin environments, and explores the association of sediment trophic state and the
Chapter 1: Sediment-Associated Microdiversity within the Marine Group I Crenarchaeota
Introduction
Most microbiological studies of deep subsurface sediments have focused on organic-rich, reduced
and anoxic continental margin and slope sediments; these are geochemically and microbiologically distinct
from organic-poor, oxidized sediments of the open ocean (e.g., D'Hondt et al. 2004). The novel, deeply
branching archaeal lineages found in 16S rRNA clone libraries from anoxic marine subsurface sediments
(e.g., Vetriani et al. 1999, Inagaki et al. 2003, Parkes et al. 2005, Sørensen and Teske 2006, Biddle et al.
2006, Inagaki et al. 2006) differ from those in the oxic water column (e.g., DeLong et al., 1992; Fuhrman et
al. 1992; DeLong et al. 1994; Fuhrman and Davis 1997; Massana et al. 2000; Bano et al. 2004). Thus, the
deep marine sedimentary subsurface is regarded as a distinct biome with a specialized, predominantly
heterotrophic microbial community (Biddle et al. 2006, Lipp et al. 2008) and with a distinct genetic
repertoire (Biddle et al. 2008). However, this emerging picture of the deep marine sedimentary community
is strongly biased towards datasets from organic-rich sediments. Oligotrophic marine subsurface sediments
are massively underrepresented in current subsurface studies (Sørensen et al. 2004; Teske and Sørensen
2008; Fry et al. 2008) and are therefore of great interest for microbial community analyses.
The depth distribution of electron acceptors in the subsurface is hypothesized to control the depth
profile and phylogenetic composition of microbial communities (Teske and Sørensen, 2008), since
microorganisms that specialize in the highest-energy electron acceptors available have the energetic
resources to outmultiply and outcompete others. In organic-rich sediments with high rates of organic
carbon input, microbial activity depletes high-energy electron acceptors such as oxygen and nitrate within a
few millimiters or centimeters of the sediment-water interface; in oligotrophic ocean basins, the oxic zone
extends to a scale of tens of centimeters or a meter (Wenzhöfer and Glud 2002). Ultra-oligotrophic
sediments underlying the centers of subtropical gyres may be oxic throughout the entire sediment column,
5
in structuring marine sedimentary microbial communities, oxidized sediments could host the same
microbial assemblage as the overlying oxic water column. To test the working hypothesis of overlapping
microbial community structure in oxic water column and sediments, this study aims at a detailed
comparison of aerobic, oligotrophic subsurface communities and aerobic water column communities from
the South Pacific gyre.
The principal target microorganisms of this investigation are pelagic Crenarchaeota, the major
archaeal assemblage in the marine water column, based on quantitative studies using abundance of
crenarchaeotal lipids (Damsté et al. 2002) and FISH probes specific to Crenarchaeota (Karner et al. 2001,
Church et al. 2003, Teira et al. 2006, Varela et al. 2008). The pelagic Crenarchaeota consist predominantly
of the Marine Group I (MG-I) phylum, based on 16S rRNA clone libraries (DeLong et al., 1992; Fuhrman
et al. 1992; DeLong et al. 1994; Fuhrman and Davis 1997; Massana et al. 2000, Bano et al. 2004), but also
include other crenarchaeotal phyla (e.g., Mincer et al. 2007, Coolen et al 2007, Agogué et al. 2008). Two
cultured representatives of the MG-I crenarchaeota exist: the pure culture isolate Nitrosopumilus maritimus
(Könneke et al. 2005), and the candidate species Cenarchaeum symbiosum from a natural enrichment
growing within the tissue of a marine sponge, Axinella sp. (Preston et al. 1996).
Here, we focused on different phylogenetic groups within the MG-I archaea, and identified groups
that are specifically recovered from sediments, as opposed to water column MG-I archaea. Previous work
has delineated several clades within the MG-I phylogeny, based on 16S rRNA gene sequences and
bootstrap support for mutually exclusive clusters (Massana et al. 2000, Takai et al. 2004). Massana et al.
(2000) adopted a Greek alphabetical nomenclature for the MG-I subphyla, which was followed by Takai et
al. 2004 and expanded by Sørensen et al. (2004) and this study. Of these, clade MG-I α (alpha) is the
best-represented in public databases and contains most of the water-column sequences, including
Nitrosopumilus maritimus. The sponge-associated candidate species Cenarchaeum symbiosum is rather
divergent from other MG-I 16S rRNA clades and appears in a separate clade β (beta) (Massana et al. 2000).
The MG-I γ (gamma) group includes clones from ambient seawater at Indian and Pacific Ocean
hydrothermal vents (Takai et al. 2004) and from the North Pacific mesopelagic water column (Mincer et al.
2007). The MG-I δ (delta) group is a smaller cluster that appears to group within the MG-I γ. Other clades
6
2004).
Results.
Geochemical and site description data.
In this study, we examined the phylogenetic structure of MG-I crenarchaeotal communities from
two oligotrophic South Pacific gyre sites, one from within the gyre abyssal plain at 5076 m depth, at
41°51’S and 153°06’W (SPG11), and another from just outside the gyre proper at 5306 m depth and
45°58’S and 163°11’W (SPG12), in conjunction with available geochemical data. Both sediments represent
the oligotrophic endmembers of microbial community studies. The SPG12 samples are from a gravity core.
The SPG11 sediment samples were obtained from a multicorer push core; SPG11 supernatant water was
taken from the same pushcore. Intact microstructures of very fine-grained clay sediment at the
sediment-water interface, and undisturbed oxygen profiles determined ex situ on fresh multicores collected
simultaneously with the cores sampled in this study, indicated an intact sediment/water interface (Fischer et
al. 2009). Cores affected by sediment resuspension were easily recognized due to the extremely slow
settling rate of fine clay sediments, and were not sampled.
Sedimentation rates and the resulting carbon flux to the sediment are approximate indicators of
sediment trophic states (D’Hondt et al. 2002). All available geochemical data indicate that sites SPG 11 and
12 are strongly oligotrophic, SPG11 more so than SPG12. The sedimentation rates for SPG Sites 11 and 12
are 0.9m/My and 1.8 m/My, respectively; they are 4-10 and 2-5 times lower than the rates of the
slowest-accumulating site studied on ODP Leg 201, Peru Basin Site 1231 (D’Hondt et al. 2003; D’Hondt et al.,
2009; Figure 1). The sediment DIC concentrations, indicators of microbial net metabolism, are lower at the
SPG sites than at the oligotrophic Peru Basin Site 1231 (D’Hondt et al. 2003). For SPG11, alkalinity (96%
of which is DIC at in situ pH) does not change from the overlying water values (Figure 1A). Total organic
carbon (TOC), as determined by the subtraction of total inorganic carbon (TIC) from total carbon (TC) as a
weight-percent of sediment, was 0.594% in the surface 1cm at SPG11, decreased to 0.49% at 2 cm depth,
and then more gradually to 0.45% by 9 cm depth (D’Hondt et al. 2009). Values for SPG12 were not
available at time of writing.
7
c[O2] declines from 176.59 µM at 5 cmbsf to 160.95 µM at 25-30 cm depth, a 15.64 µM decrease (Figure
1A). In-situ dissolved oxygen profiles of bottom water at different SPG sites, including nearby SPG Site
10, revealed a bottom-water oxygen concentration of ~220 µM across the SPG.
8
Thus, the overall drawdown of oxygen over the upper ~30 cm depth at SPG11 is ~60 µM, after which little
change is observed (Figure 1A). Oxygen appears not to be depleted throughout the ~70m sediment column
(Fischer et al. 2009). The SPG11 nitrate concentration profile revealed a sharp increase in concentration
over the upper ~30 cm of sediment, from 33.3 µM in the overlying water to 43.2 µM at 25-30 cmbsf
(Figure 1A). The deepest interval sampled for nitrate from the multicore, 30-35 cmbsf, showed a slight
decline to 41.7 µM, which is consistent with the deep sediment measurements made with the trigger core
(D’Hondt et al. 2009).
At Site SPG12, the nitrate, oxygen, and alkalinity profiles indicate slightly more reducing
conditions than at SPG 11 (Figure 2A). Oxygen declines from 114.76 µM at 0.05 cmbsf to ~2 µM at 179
cmbsf, while nitrate declines from 43.8 µM at 10-15 cmbsf to zero at 253-258 cmbsf, suggesting a
successive depletion or near-depletion of oxygen followed by depletion of nitrate. No multicore or
overlying water sample was taken for Site SPG12. The drawdown profile of oxygen appears exponential
over the upper 100-150 cmbsf, while the buildup of DIC over the same interval appears linear until it
reaches nearly its maximum value at around 100-150 cmbsf (Figure 2A). Taken together, rates of
sedimentation, oxygen and nitrate depletion depths, and maximum DIC values indicate that SPG12 is
significantly more oligotrophic than the most nutrient-limited marine sediments examined during ODP Leg
201 (D’Hondt et al. 2004).
Cell counts at site SPG11 revealed a peak in cell densities (4.27x10⁶ cells/mL) at the sediment
water interface, followed by a 20-fold decline to 2.29x10⁵ cells/mL at 30 cmbsf (Figure 1A). A slightly
higher cell density of 3.63x10⁵ was detected at the next deepest interface, 45 cmbsf, and afterwards cell
concentrations decline more slowly with depth, by less than an order of magnitude from 3.46x10⁴ at 75
cmbsf to 7.41x10³ cells/mL. Site SPG12 exhibited higher cell abundances than Site SPG11 (Figure 2A).
The highest recorded densities at Site SPG12 occur not at the very surface but at 70-119 cmbsf; a gravity
corer could have resulted in the loss of the more-active sediment-water interface. The subsurface peak in
cell densities at ~1m depth may be associated with a redox interface between oxygen and reduced nitrogen
9
10
alkalinity maximum begins. Heterotrophic metabolism likely also plays an important role both through the
dissimilatory oxidation of organic matter as well as by providing the reducing equivalents responsible for
generating reduced metals or by production of ammonia or organic N. This is in contrast with Site SPG11,
where geochemical profiles suggest dominance of aerobic respiration, and where electron donors are
insufficient to spark redox cycling of NOX or metals (Figure 1A, 2A).
Molecular survey results and phylogenetic analysis.
For Site SPG11, 226 nearly full length archaeal 16S rRNA gene clones derived from 3 different
sediment horizons and from overlying water were sequenced and analyzed. For Site SPG12, 49 nearly full
length archaeal 16S rRNA gene clones were obtained from the 60-70 cmbsf horizon and 11 from 153-163
cmbsf. All sediment-derived sequences and all but 2 water column-derived sequences collected at Site
SPG11 grouped with the Marine Group I (MG-I) Crenarchaeota (DeLong 1992). One of the remaining two
clones grouped with Marine Group II (DeLong 1992), the other with Marine Group III (Fuhrman and Davis
1997). Archaeal clone libraries from the 60-70 cmbsf horizon at SPG12 (Figure 2B) yielded solely MG-I
sequences. Although few clones were recovered from the 153-163 cmbsf interval, MG-I archaea were also
recovered in significant proportions at this horizon (4/11 sequences, ~36%), in a putatively suboxic zone
well into the nitrate drawdown interval. Remaining sequences from this depth belonged to deeply
branching Euryarchaeotal lineages (Durbin, 2009).
A total of 29 unique phylotypes at the 3% OTU level (Figure 3; Table 1) and 76 unique phylotypes
at the 1% OTU level (Appendix A, Appendix B) were identified. MG-I subgroups were defined based on
the major secondary or tertiary clusters visible in the tree with interior branch (IB; Sitnikova et al. 1995)
support greater than 95%, with the exception of subgroups θ (theta) and ζ (zeta), which had IB support
>90%. Non-chimeric representatives of previously delineated subgroups (e.g., Massana et al. 2000, Takai
et al. 2004, Sørensen, et al 2004) were used to assign labels to subgroups recovered in the current trees.
The identified clades were found to be stable, and had the same high interior branch support in both trees.
Major subgroups for the SPG dataset overall were α, η (eta) and υ (upsilon), together accounting for
253/277 MG1 clones (~90%). A between-group distance matrix revealed maximum divergences for most
11
Ta bl e 1 . R ep re se nt at iv e p hy lo ty pe s f or M G -I, b ased on 3
% O TU de fin tion. Ta bl e 1. R ep re se nt at iv e p hy lo ty pe s f or M G -I, b as
ed on 3
% O TU de fin tion. R el ev an t i nf or m at
ion on b
es t B LA ST m at ch is in cl ud ed, al on g w ith M G -I subg roup de si gn at io n, and ph yl ot yp e abund an ce fo r e ac h sa m pl e fro m w hi ch M G -I w as re co ve re d. D as h ind ic at es if no sub cl ad e d es ig na tion cou ld b e m ad e. C lo ne n am e A cc es si on nu m be r Be st B LA ST % ID Be st N C B I m at ch ac ce ss io n # Be st N C B I m at ch c lo ne na m e M G -I sub gr oup O ve rly in g w at er SP G 11 3-4 cm bs f SP G 11 10 -1 1 cm sb f SP G 11 26 -28 cm bs f SP G 12 60 -70 cm bs f SP G 12 153
-163 cmbs
12
Table 2. Average between-clade, within-clade, and maximum within-clade divergence levels for major MG-I subgroups recovered in this study.
Table 2. Mean between-clade, within-clade, and maximum within-clade divergences for MG-I subgroups. Average between-clade, within-clade, and maximum within-clade divergence levels for major MG-I
subgroups recovered in this study. Within-clade distances were not calculated for γ and ι clades, since very
few representatives of these were recovered. All distances were estimated using a composite maximum likelihood (ML) substitution model with gamma-corrected site rates. Maximum within-clade distances
approximately reflect the phylogenetic depth of clades. α:Nitrosopumilus shows the intragroup diversity
within the crown-group MG-I α clade containing Nitrosopumilus and most of the SPG α diversity.
Between-clade distances are not included for α:Nitrosopumilus as a subset of MG-I α.
from 2.6-6.2% maximum values, and mean within-group distances of 2.4-3.6%. The ζ-ε-θ cluster, with by
interior branch (IB) support of 92%, is of approximately the same phylogenetic depth as the other major
subgroups. The MG-I α clade containing the cultured MG-I representative, Nitrosopumilus maritimus, was
supported by an IB value of 99%.
The phylogenetic differentiation of MG-I archaea between the water column and sediment, and
amon g sediment layers, was clear at a finer taxonomic resolution. At SPG11, the dominant MG-I
subcluster in the overlying water was MG-I α, comprising 67/84 MG-I clones (~80%). Fewer clones were
found for MG-I γ (1 clone), ι (3), η (1) ζ (4), ε (1), and θ (3); 4 sequences were not affiliated with any of
these groups (Figure 1B, Figure 3). At 3-4 cm sediment depth, MG-I α clones contributed 13 of 32 (~41%)
clones, along with 3 MG-I η (~9%), 7 υ(~22%), 1 ε, 2 θ, and 6 ungrouped clones (Figure 1B). Notably,
MG-I υ and η, both uncommon groups in the overlying water sample, were proportionally more abundant
at 3-4 cm depth, representing ~22% and ~9% of the archaeal 16S rRNA clone library, respectively. At
10-11 cm sedi ment depth, MG-I υ increased to 61% of all clones. At 26-28 cm, the deepest depth analyzed for
SPG 11, the
Mean between-clade distance
Mean within-clade
Max. within-clade
α: Nitrosopumilus 0.01938 0.0489
α 0.02887 0.0617
υ 0.0858 0.02654 0.0343
η 0.0839 0.0555 0.02364 0.0262
γ 0.0891 0.0827 0.0769
ζ-ε-θ 0.0946 0.0788 0.0797 0.0872 0.03641 0.0445
13
Figure 3. MG-I 16S rRNA gene phylogeny for representative phylotypes from SPG11 and SPG12, using 3% OTU definition. Distances were estimated using a neighbor-joining algorithm with gama-corrected site rates in MEGA4 (Tamura et al. 2007), using interior-branch node support, on an 800-bp alignment.
entire archaeal 16S rRNA clone library consisted of MG-I υ (49/57, ~86%) and η (8/57, ~14%). Site
SPG12 lacked a fine-scale depth resolution, and therefore the depth trend of MG-I archaea is harder to infer
14
consisted almost exclusively of MG-I υ and η. At the shallowest depth analyzed at SPG12, 60-70cmbsf,
MG-I υ and η were predominant, with ηthe most abundant group at 41/49 clones (~84%), along with 7 υ
clones (~14%) and 1 α clone (Figure 2B). The deepest sample at SPG12 to yield any MG-I clones,
153-163cmbsf depth, resulted in a small number of MG-I η clones, four out of 11 archaeal clones (Figure 2B).
At deeper sediment depths, MG-I archaea could not be detected, and the archaeal community of SPG 12
shifted towards entirely different archaeal phyla (Durbin 2009).
Diversity analysis.
Based on a whole-phylogeny-based analysis (Schloss and Handelsman 2006), each archaeal
assemblage at SPG11 was revealed to have a structure significantly different from any other (P <0.00001).
However, further analysis revealed some statistical similarities between successive communities, in line
with expectations from the observed depthwise changes in MGI clade relative abundances (Figure 1B,
Figure 2B). Comparison of the shared Chao1 richness estimates of the overlying water and 3-4 cmbsf
assemblages with the estimates for the two assemblages by themselves revealed a large overlap in
community memberships at both the 1% and 3% OTU levels (Table 3A, B). Chao1 comparisons between
3-4 cmbsf and 10-11 cmbsf revealed a small degree of shared diversity at the 1% level, but the Chao1
estimate for shared 3% OTUs between these communities was greater than the estimate for 10-11 cmbsf
3% OTU alone, suggesting that these comparisons may be unreliable at extremely low diversity levels and
small sample sizes.
The Jaccard index, which considers the total abundance of overlaps in phylotype membership (Yue
and Clayton 2001), suggested approximately 5-25% of sequences in the SPG11 overlying water (OW) and
3-4 cmbsf sample sets belonged to shared OTUs (Table 3B). The ThetaYC estimate, which considers the
“overlap” in both membership and library-specific relative abundance of OTUs (Yue and Clayton 2005),
for any comparison involving the overlying water (OW) was highest (~50%) between the OW and 3-4
cmbsf samples; comparisons of the OW with deeper horizons quickly declined to 0. Both Jaccard and
16
Ta bl e 3 (B ). D iv er si ty ind ic es fo r S PG 11 /S PG 12 M G -I, 3 % O TU d ef in iti on. Sa m pl e in di ce s C om pa ra tiv e in di ce s # M G -I cl on es C ha o1 s pe ci es d iv er si ty (9 5% C .I. ) Si m ps on di ve rs ity in de x O W 3-4 cm bs f 10 -11 c m bs f 26 -28 c m bs f O W 83 15 .5 (13 .4 -30 .0) 0. 0476 3-4 cm bs f 32 22 .5 (14 .0 -66 .2) 0. 0645 7. 5 0. 357 (+ /-0. 207) 0. 470 (+ /-0. 115) 10 -11 cm bs f 52 5. 0 (5 .0) 0. 0897 5 7. 5 0. 183 (+ /-0. 267) 0. 624 (+ /-0. 206) 0. 102 (+ /-0. 045) 0. 318 (+ /-0. 120) 26 -28 cm bs f 57 2. 0 (2 .0) 0. 6165 0 5 3 0 0. 188 (+ /-0. 127) 0. 769 (+ /-0. 208) 0 0. 153 (+ /-0. 079) 0. 760 (+ /-0. 114) 60 -70 cm bs f (S PG 12 ) 49 3. 0 (3 .0) 0. 1598 0 8. 5 3 3 0 0. 219 (+ /-0 .137) 0. 616 (+ /-0. 219) 0. 755 (+ /-0 .208) 0 0. 0749 (+ /-0 .044 8) 0. 373 (+ /-0. 109) 0. 195 (0 .0650) Ta bl e 3. D iv er si ty ind ic es fo r M G -I cl on e lib ra rie s f ro m S PG 1 1 and SP G 12 b ased on 1
17
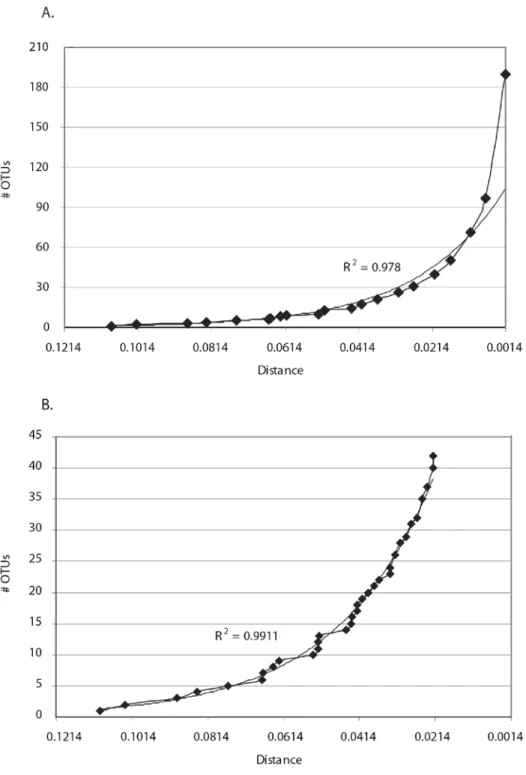
Figure 4. time plots of cumulative abundance of OTUs vs. distance. (A) Lineage-through-time plot of number of OTUs vs distance, in 0.5% increments. (B) Lineage-through-Lineage-through-time OTU/distance plot, excluding OTUs of less than 2% divergence. An exponential distribution trendline is included in both. (B) shows putative discontinuous bursts in cladogenesis rates, possibly associated with the divergence of
the major MG-I subgroups recovered in this study, particularly MG-I α. A value of 0.14% was chosen as
18
(i.e., values increase up and to the right in Table 3); an exception to this pattern was the comparison of
60-70 cmbsf with 26-28 cmbsf; in this case, although these two samples were the closest depthwise, their
comparison did not exhibit the highest ThetaYC value for any 60-70cmbsf, consistent with these two
samples deriving from different cores. In some cases ThetaYC error values overlapped, likely due to low
sample size. This pattern of higher similarity for adjacent sediment depths found much stronger statistical
support in the Jaccard values. Together, the Jaccard and ThetaYC values for the archaeal 16S rRNA clone
library data in the SPG11 sediment column are consistent with an archaeal assemblage that transitions in
structure from one depth to the next: at least one shared 16S rRNA phylotype is abundant in one of two
adjacent depths, while overall community structure of adjacent horizons is distinct. These observations are
consistent with the trend observed from the percent-abundance plots (Figure 1, Figure 2), from an MG-I α
-dominated overlying water sample to an MG-I ηand υ dominated sediment community at 3-4 cmbsf and
below.
Simpson’s indexes sharply decrease both with shallower depth and when OTUs are defined at 1%
rather than 3% divergence levels (Table 3), indicating a sharp increase in overall species richness and
evenness both spatially (towards the water column) and at finer phylogenetic scales. The Simpson’s indices
for all MG-I combined (not shown) were 0.003741 for a 0% (unique) OTU, 0.04112 at 1% OTU and
0.1632 at 3% OTU.
A lineage-through-time plot of number of OTUs vs OTU definition distance level revealed that
~58% of MG-I diversity, or branches, are less than 1% divergent from their closest relatives, with 79 OTUs
detected at a 1% OTU, compared to 190 unique OTUs, after adjustment for Taq error (see Materials and
Methods; Acinas et al. 2004), and ~49% of diversity (branches) occurred at less than 0.5% divergence from
closest relatives (Figure 4A). This high contribution of finest-scale diversity to total diversity was also
noted in an extensive sequence effort on coastal bacterioplankton (Acinas et al. 2004). In the current study,
an exponential trendline was found to describe the OTU abundance distribution with an r2 value of 0.978,
although clearly the data depart from this distribution at certain distance levels, particularly at the
finest-scale divergences (Figure 4A). A consideration of only higher-level OTUs raised the possibility of
discontinuous intervals of rapid cladogenesis between 3 and 6% divergence levels (Figure 4B), possibly
19
which also has maximum internal divergence levels of ~5-6% (Table 2).
Discussion
A central question of this study was to determine if the oxic, oligotrophic sediments underlying the
majority of the ocean surface represent a distinct microbial habitat, as revealed by a transition in
community structure from the water column. The same archaeal phylum, the Marine Group I
Crenarchaeota, was found to dominate in clone libraries from both the multicore overlying water and the
sediment at SPG11, illustrating the major role the shared terminal electron acceptor, oxygen, has in shaping
available microbial niches. However, finer-scale analysis revealed that distinct MG-I clades occur in the
sediment and overlying water. A distinct transition from a putative pelagic to a sedimentary-associated
MG-I assemblage was observed at SPG11, despite sharing a dominant terminal electron accepting activity with
the water column. SPG12 shared the same dominant sediment-associated lineages as SPG11 sediment,
although in a different relative ratio. These results suggest that different controls and constraints impact
microbial community structure in the oxic water column and in oxic, ultraoligotrophic sediments.
At SPG 11, M G-I subphylum α accounts for ~80% of archaeal clones recovered from the
overlying water, becomes less abundant at 3-4 cm and 10-11 cm depth, and is not found at 26-28 cm depth.
This is reflected in the decreasing community-structural similarity (ThetaYC) between the overlying water
and sediment as deeper horizons are considered (Table 3). Conversely, groups found sparingly (0-1%) in
the overlying water, MG-I υ and η, became steadily more abundant with depth, comprising nearly all
clones at 10-11 cm depth and all at 26-28. The high Jaccard similarities but low ThetaYC similarities
between successive depths, combined with low Jaccard and Theta similarities comparing 3-4 cmbsf with
26-28 cmbsf, indicate that diversity and abundance overlaps are greatest between successive depths. This
supports the characterization of the observed diversity pattern as a transition from a water-column (or
shallowest sediment) MG-I assemblage to a sediment-associated assemblage in deeper sediments. The
diversity maximum observed at 3-4 cm depth, where MG-I α, υ and η clones co-occur with some of the
minor clusters found in the overlying water, e.g. MG-I ε and θ, can be explained as an example of an
ecotone, wherein the boundary between two biomes hosts greater biodiversity due to the co-occurrence of
20
Interestingly, a lineage-through-time plot of number of OTUs vs sequence divergence revealed
that more than 50% of 16S rRNA gene sequence diversity (i.e., number of branches) occurred at <1%
divergence (Figure 4A). The same pattern was observed in studies of coastal marine bacterioplankton
using extensive rRNA clone library sequencing (Acinas et al. 2004, Thompson et al. 2005). Here, diversity
at less than 1% 16S rRNA divergence doubled the cumulative number of branches in a whole-community
phylogenetic tree, compared to diversity seen at more than 1% divergence. This microdiversity below the
1% sequence divergence level is interpreted as functionally neutral variation, as judged by genome size
variation (genome size variation in prokaryotes is principally driven by functional and not junk DNA
content); competitive and selective forces are too weak to favor a single microhabitat-adapted organism in
the bulk water column (~1 mL or greater). In contrast, the reduced number of branches at levels at and
above 1% divergence are indicative of periodic selective sweeps reducing diversity at higher levels
(Thompson et al. 2005). Since the MG-I subgroups are posited here to be adapted to sedimentary (or water
column) conditions, one might expect a similar jump in diversity across the divergence thresholds
associated with the MG-I subgroups, with putative selective sweeps associated with the foundation of these
habitat-associated clades (founder effects), followed by relaxed selection which allowed greater diversity to
accumulate and persist. The MG-I dataset shows some “jumps” of increasing OTU numbers at moderate
(4-6.5 %) divergence levels when excluding finest-scale (<2%) diversity (Figure 4B). The major
habitat-associated MG-I subgroups identified in this study, namely MG-I α, υ and η, have intergroup divergences
of approximately the same divergence level (Table 2). These intergroup divergences could result from
selective sweeps or adaptation to certain environments. Subsequent intragroup evolution and accumulation
of 16S rRNA microdiversity may represent variation that is more or less functionally neutral within the
context of sediment or water-column environments.
At SPG11, t he decline in species-level Chao1 diversity with depth, particularly at the 3% OTU
level (Table 3B), may indicate that deeper sediments are populated by remnants of the near-surface
community. The cell counts are consistent with a surface-associated peak in microbial diversity and
activity that undergoes a sharp dropoff over the upper 30 cm, wherein a much reduced community persists
deeper into the sediment and declines slowly with depth. Notably, many of the cell counts made for SPG11
21
estimated for ODP Leg 201 (D’Hondt et al., 2003), and are lower than any other published number for the
equivalent sediment horizon in marine sediments (D’Hondt et al. 2003, 2009). Accurate and precise cell
counts for such low-biomass sediments were made possible by the recent development of a novel technique
for separating cells from sediments prior to counting (Kallmeyer et al. 2008).
This apparent decline in species diversity also may result from diminishing DNA concentration
with depth, leading to stochastic PCR bias where only a few phylotypes being amplified during initial PCR
cycles, and subsequently dominate the reaction. Yet given a conservative 25% recovery of DNA from ~10
mL of sediment containing at least 100,000-300,000 cells per mL of sediment, and using 10-15% of this in
each PCR reaction, at least 10,000 MG-I 16S rRNA gene molecules should be present in each PCR,
assuming the 2/5 ratio of Crenarchaeota to Bacteria found in the deep North Pacific water column (Karner
et al. 2001). Low DNA concentrations would result in jackpot amplification of only a few sequences being
amplified early on and dominating all subsequent rounds of amplification. PCR inhibition could impact the
amplified sequence diversity similarly, since inhibition result in a few templates randomly amplifying past
some point at which the reaction is no longer inhibited, resulting in a selective sampling of 16S genes. In
this study, three PCR reactions were combined during cloning to minimize jackpot amplification bias.
Quantitative studies and powerful amplification techniques (e.g., ϕ29 polymerase; Biddle et al. 2008), are
needed to confirm that a depth-related decline in sequence diversity results from low survivorship and not
low DNA yield.
Metabolic activity of MG-I crenarchaeota in ultra-oligotrophic sediments.
Cultivation and genomic analysis suggest that the pelagic Crenarchaeota, and the MG-I in
particular, are either obligate (Nitrosopumilus maritimus; Könneke et al. 2005) or facultative (Cenarchaeum
symbionsum; Preston et al. 1996, Hallam et al. 2006) nitrifiers. MG-I Crenarchaeota have been shown to
be the dominant nitrifiers in the North Sea and northern North Atlantic (Wuchter et al. 2006). MG-I also
appear to be the dominant supplier of nitrite to the anammox reaction in the Black Sea, via a tight coupling
between anaerobic ammonium oxidation (anammox) and microaerophilic or transiently oxic nitrification
(Lam et al. 2007); through this linkage, pelagic Crenarchaeaota may be responsible for a significant portion
of fixed nitrogen loss in oxygen minimum zones (Lam et al. 2007, Kuypers et al. 2005). Estimates based
22
and bathypelagic Crenarchaeaota may regenerate all of the export flux of reduced N below the photic zone
(Ingalls et al. 2006). However, comparative quantifications of 16S rRNA genes and ammonia
monoxygenase genes from the North Atlantic suggests that nitrification is the dominant metabolism for
MG-I populations only in waters north of 30 °N and in the subphotic zone (Agogué et al. 2008).
The upper 35 cm of sediment at SPG11 displays a clear vertical mirroring of oxygen and nitrate
profiles, compatible with nitrification as a net metabolic activity that proceeds to at least ~30 cmbsf. This
finding is consistent with the dominance of the putatively nitrifying MG-I crenarchaeota. Interestingly, the
sharp decline in clade MG-I α from the water column to 3-4 cmbsf mirrors the sharp drawdown in oxygen
over the same depth interval, and may also track the decline of substrates consumed by water
column/sediment-water interface MG-I archaea. Thus, the shift to the MG-I η and υ groups at SPG11 may
represent a shift in abundance of electron donors within the sediment, either reduced carbon or nitrogen,
compared to the water column. Other explanations may include changes in the lability or accessibility of
carbon substrates, availability or presence of specific reduced nitrogen species, size constraints due to pore
size, and differences in viral predation pressure (e.g., Corinaldesi et al. 2007).
The MG-I sequences at SPG 12 originate from a sediment with different geochemistry; oxygen is
found in lower concentrations (10-20 µM) at 60-70 cmbsf, compared to near-seawater concentrations
throughout the sediment column of SPG11. Oxygen is nearly absent from SPG12 153-163 cmbsf layer
(<10 uM), where nitrate is being drawn down. Despite these differences in oxygen availability, the MG-I η-
and υ-dominated deep SPG12 and SPG11 sediment clone libraries are more similar to each other than
either is to that of SPG11 overlying water. This supports the interpretation of the MG-I η and υ clades as
consistently sediment-associated lineages in SPG11 and SPG12 sediments, excluded from the SPG11 water
column.
One explanation for differing MG-I assemblage composition is a transition from a predominantly
nitrifying, autotrophic metabolism to one based on heterotrophic substrates. Agogué et al. (2008) found a
roughly one-to-one ratio between 16S rRNA genes and amoA, the marker gene for archaeal nitrification,
only at the base of the euphotic zone and in subtropical-to-subpolar mesopelagic waters; noting that
ammonia is in extremely low concentrations elsewhere, they propose that MG-I and other Crenarchaeota in
23
ammonia oxidation, presumably heterotrophy. Further, Agogué et al. (2008) found that the proposed
metabolic provinces were associated with different phylogroups of MG-I, principally α in the nitrifying
regions, and γ elsewhere (results not shown). Thus, the community structure transition observed between
the overlying water sample and the SPG11 and SPG12 sediment samples, and between SPG11 and SPG12
sediments, may be due to changing availability of key substrates, and perhaps the energetic feasibility of
autotrophic nitrification versus heterotrophy.
The MG-I archaea are found in many different oxic marine environments, and have a strong
potential to contaminate sediment cores and generally confound habitat-specific phylogenetic signatures of
any marine biome, if the phylogenetic fine structure and habitat-associated diversification are not
considered. Finding a specific association between a habitat within the marine realm, namely between
oxic/suboxic marine sediments and the MG-I η to MG-I υ clades within the Marine Group I phylum, may
therefore be important to future investigations of archaeal diversity in the oceans and sediments. The
specific biogeochemical controls influencing the differentiation of sediment and water column lineages
remain to be determined; they may possibly reflect a transition from autotrophic nitrification to
heterotrophic nitrification or heterotrophy, as observed in Agogué et al. (2008). Here, studies of additional
sites, perhaps also including fine-scale measurements of organic-N availability and rates of enzyme
activity, as well as overlying water column samples taken independently of coring, will be required to
further characterize the oxic marine sediment niche and to discriminate between explanatory hypotheses of
the observed differences in community structure. Oxic gyre sediments thus represent a microcosm where
most-energetic available electron acceptor is shared with the overlying water column, removing a key
variable and allowing a window into the constraints structuring subsurface microbial communities.
Methods.
Geochemical and sedimentation data.
The sedimentation rate, estimated as a function of the age of the underlying crust and the thickness
24
abundances and porewater chemistry measurements, including alkalinity, oxygen, and DIN, were
determined as described elsewhere (Fischer et al. 2009; D’Hondt et al. 2009).
Sample collection.
Samples were obtained during the Knox02-RR cruise in January 2007 from two sites, one on the
edge of the South Pacific gyre center, South Pacific Gyre Site 11 (SPG11) at 41 51.1281 S, 153 06.3849 W,
water depth 5076m, and the other, SPG12, in the gyre margin at 45 7.855 S, 163 11.051 W at a water depth
of 5306m. All SPG11 samples used in this study were taken from a multicoring device that sampled the
upper 20-40 cm of sediment, as well as the overlying water. As soon as the multicorer came on deck,
multicores containing sediment and overlying water were removed to a 4° C chamber, where all multicore
subsampling took place. The near-bottom water column was sampled by dipping two 50-mL Falcon tubes
into the overlying water of the multicore, which were subsequently frozen at -80° C. SPG11 multicore
sediments were sampled by three autoclaved 60mL syringes with the tip cones cut off. To sample
sediments, the core barrel was pulled down so that it was nearly flush with the sediment surface. Syringes
were then pushed into the sediment, taking care to avoid sampling within ~1cm of the core barrel. Pulling
the core barrel down further to just above the bottom of the cutoff syringe, the syringes were pulled
laterally out of the core. The sediment was then extruded from the syringe and rounds of sediment were
sliced off at specific intervals using a flame-sterilized scraper. Sampling intervals were 1 cm for 0-20 cm
depth, 2 cm for 20-30 cm depth, and 5 cm for 30-40 cm depth. Samples from the same interval were
pooled in a sterile Whirl-Pak bag and then frozen at -80° C. The sampling horizon was reestablished after
each syringe sampling by using a flame-sterilized scraper to scrape the sediment flush with the syringe
depressions.
SPG12 sediments used in this study were collected via a gravity core, of which total recovery was
401 cm. Cores were split into approximately 1m-long sections, which were then further sectioned into ~30
cm rounds. Cores were sampled by pushing autoclaved cut-off 60 mL syringes into the core cross section,
avoiding an approximately 1-2 cm margin inside the core barrel, and then extruding the sample 1 cm at a
time while slicing off subsamples using a flame-sterilized spatula. Subsamples were stored in sterile
25
Nucleic acid extraction, amplification and sequencing.
Genomic DNA for SPG12 samples was extracted from samples collected from 60-70 centimeters
below the sediment surface (cmbsf) and 153-163 cmbsf, using a standard phenol-chloroform extraction
protocol (Zhou et al. 1996) with some modifications. For SPG11, sediment horizons at 3-4 cmbsf,
10-11cmbsf, and 26-28 cmbsf were extracted for DNA, as well as overlying water (OW) from the multicore.
Blank extractions with only buffer were also carried out under the same conditions as the appropriate
sample.
DNA extraction of overlying water was undertaken using ~50 mL of frozen bottom water. For the
DNA extraction of SPG11 overlying water, approximately 50 mL of -80 C frozen water was melted and
filtered first through a 0.2 -µm Anodisc filter (Millipore). The filtrate was pipetted out of the receiving
flask, and refiltered through a 0.02-µm Anodisc filter. Both filters were then frozen at -80 °C until DNA
extraction. All tools and glassware contacting either the filter or filtrate were baked at 160 °C overnight,
and previous to use filters were UVC-irradiated for approximately 30 min at a distance of 30 cm from a
15-watt UVC source.
To extract genomic DNA, filters were first added to a 60-mL Teflon tube (Oak Ridge) that had
been baked at 160 °C overnight, and crushed using a baked spatula. Next were added 5 mL of phenol, 5
mL of extraction buffer (100 mM phosphate, 250 mM sodium acetate, 50 mM EDTA, 50 mM NaCl, pH 8),
5g of a 60/40 wt% mix of 0.1 µm and 0.2 µm low-binding zirconium silicate beads (OPS Diagnostics), 10
µg of poly[dIdC] (Barton et al. 2006) and 20% UVC-irradiated SDS to a final concentration of 0.9%. This
mixture was then vortexed at highest speed for 2 minutes, frequently turning the tube on its side to mix
beads thoroughly. The remainder of the extraction followed a standard phenol-chloroform protocol (Zhou
et al. 1996), except that organic phases were extracted twice. The crude DNA extract was then precipitated
by adding, sequentially, 2.5 ul/mL of UVC-irradiated GenElute linear polyacrylamide coprecipitant (LPA)
(Sigma) to maximize precipitation of dilute nucleic acids, 0.5 volume of 7.5 M ammonium acetate
(NH4CH3COO), and 1 volume of isopropanol. The precipitation was carried out at -20 °C overnight.
Beads used for all SPG12 extractions were a 60/40 mix of 0.1 mm and 0.2 mm
26
sediments of SPG11, a larger amount of sediment (12 g) was used for 10-11 cmbsf and 26-28 cmbsf, and a
relatively higher bead-to-sediment mass ratio of ~0.0.4 was used. Additionally, beads used for SPG11
3-4 cmbsf sample were 0.1 mm zirconium silicate beads (Biospec). All other SPG11 extractions were
performed with the same 60/40 mix of low-protein-binding zirconium silicate beads.
Sediment extraction for both SPG12 and SPG11 proceeded similarly with a few differences, based
on what resulted in successful DNA recovery. For SPG12, 7-8 g of sediment was slurried in 7.5 mL of
extraction buffer (100 mM phosphate, 250 mM sodium acetate, 50 mM EDTA, 50 mM NaCl, pH 8), and
then added to pre-baked bead-beating canisters containing zirconium beads with a sediment-to-beads mass
ratio of ~0.6-0.7. Approximately 30 µg of a carrier DNA, polydeoxyinosine-polydeoxicytosine
(poly[dIdC]) (Barton et al. 2006), was then added to act as a blocking agent and to soak up nucleases to
protect sample DNA. No carrier DNA was added to the SPG12 70 cmbsf and SPG11 3-4 cmbsf samples,
as higher cell densities nearer the sediment surface reduced the need for a carrier DNA. Next, 15 mL of
pH 8 buffered phenol and 875 µL of 20% sodium dodecyl sulfate were added, and the samples were
subjected to bead-beating in a Braun MSK Cell Homogenizer for 20 s at high speed. The remainder of the
extraction protocol followed a standard phenol-chloroform extraction and cleanup protocol, except that the
sediment pellet was reextracted with a second volume extraction buffer with no SDS added, and this second
aqueous phase was processed through the same organic phases as the first, thus re-extracting the organic
phases and reducing DNA loss. The crude DNA extract was precipitated by addition of, in order, 2.5 ul/mL
of UVC-irradiated GenElute linear polyacrylamide coprecipitant (LPA) (Sigma) to maximize precipitation
of dilute nucleic acids, 0.5 volume of 7.5 M ammonium acetate, and 1 volume of isopropanol. The
precipitation was carried out at -20 °C overnight. Following resuspension in PCR-grade water, the crude
DNA extract was then processed through a MoBio PowerSoil kit as per manufacturer’s instructions, with
the omission of Solution C1, used in the cell-disruption step.
The primers A8f/A1492r (Teske et al. 2002) were used to amplify an approximately 1500-base
pair (bp) fragment of the 16S gene of Archaea, for both sample and blank extractions. Sample PCRs were
carried out in triplicate and then combined to maximize yield and to minimize “jackpot” amplification bias
(e.g., Cha and Thilly 1993), wherein by chance a few sequences are amplified early on, and due to low
27
PCR reaction contained 1 µL (SPG12 60-70 cmbsf), 2 µL (3-4 cmbsf), 10 µL (10-11cmbsf) or 15 µL
(26-28cmbsf) of DNA template, 2.0 µL of dNTP solution (2.5 mM each dNTP), 0.250 µL (1.25 units) Takara
Bio Inc. SpeedSTAR hot-start Taq enzyme, 2.5 uL of Takara Fast Buffer I (30mM Mg2+), 1 µL of 100
mg/mL bovine serum albumin (BSA), and 1.5 uL each of 10 mM forward and reverse primers. The
conditions for PCR were as follows: denaturation at 94 °C, followed by 35 cycles, each consisting of 5 s
denaturation at 94 °C, 15 s at the annealing temperature, and 20 s of elongation at 72 °C, followed by one
10-minute elongation cycle at 72 °C. . Triplicate PCR reactions were then combined, target bands
extracted and purified from a 2.0% low-melting-point (LMP) agarose (Promega) gel using SYBR Gold and
the Invitrogen S.N.A.P. Miniprep kit, following the manufacturer’s instructions. A gel fragment at
approximately 1500 bp was also extracted and purified for the PCR and extraction negative controls,
whether or not a band was present. All purified PCR products were further concentrated by precipitation
with 0.5 µL of GenElute linear polyacrylamide (LPA) (Sigma). The pellets were then dried, and
resuspended in 4-20 uL of PCR H2O.
Sequencing was performed at the Josephine Bay Paul Center for Molecular Biology and Evolution
at the Marine Biological Laboratory (Woods Hole, MA), using an ABI Prism 3730 sequencer and the same
primers used in the initial PCR amplification of each sample. Sequence traces were trimmed, visually
checked, and then assembled in Sequencher 4.7 (Genes Codes Corp.). All SPG sequences, as well as
closest GenBank relatives identified via BLAST searches, were aligned in ARB (Ludwig et al. 2004) with
final adjustments made by eye. Initial NJ trees were made in ARB, containing the GenBank and NCBI
sequences that would be included in the final phylogenies. These datasets were then checked for chimeric
sequences using the GreenGenes pipeline, which first requires alignment using the NAST aligner (DeSantis
et al. 2006). Aligned sequences were then submitted to Bellerophon 3, using a window size of 200 bp, a
“similarity to core set threshold” set to 99%, and the divergence-ratio set to 1.10, the last indicating that a
sequence will be identified as a chimera if fragments derived from it have ‘parent’ sequences in the
database that are more than 10% divergent from each other (Huber et al., 2004). MG-I Crenarchaeota
sequences were additionally submitted to a more stringent chimera-check, with the same settings as above
28
resulted in a much smaller number of identified chimeras, and the third identified none, indicating the
dataset was completely sanitized at that stringency level.
Operational taxonomic units (OTUs) were defined using DOTUR (Schloss and Handelsman
2005), and a single representative sequence was then selected from each OTU defined at the 1% level to be
included in phylogenies. Additionally, 3% OTU representative phylotypes were selected for MG-I
sequences. The best model of sequence evolution was then determined using Modeltest 3.7 (Posada and
Crandall 1998) according to the Akaike information criterion (AIC), and was always a general time
reversible (GTR) model with a proportion of invariant sites and a gamma distribution of site evolutionary
rates. For the MG-I tree, a different approach than bootstrap resampling was necessary, since high
numbers of sequences can result in serious underestimation of branch support using bootstrap methods
(Rodrigo 1993, Sitnikova et al 1995, Sanderson and Wojciechowski 2000). The neighbor joining method
with gamma corrected site rates can exceed the ability of the ML algorithm to calculate the correct topology
and branch lengths, at least when a gamma-correction is not also used for the ML algorithm (Tateno et al.
1994), and performs equally well when considering at least ~1000 sites and low (<~5%) sequence,
characteristics that nearly approximate the MG-I dataset. Therefore, a neighbor-joining tree (Saitou and
Nei 1987), with a maximum-likelihood-estimated model of evolution and a gamma-corrected rate
distribution, was calculated for the MG-I dataset using MEGA 4.0 (Kumar et al. 2008). Branch support
estimated using a 1000-replicate interior branch test (Nei and Kumar 2000), which uses a
hypothesis-testing approach to determine the probability that a particular interior branch has a length greater than 0,
i.e., that the node in question should not be collapsed into a polytomy. Values greater than 95% should be
considered strong support for a particular node (Nei and Kumar 2000). Using these methods, phylogenies
were estimated for both the 1% and 3% MG-I OTUs, using the same sequences downloaded from GenBank
as markers.
Treeclimber (Schloss and Handelsman 2004) was used to test the hypothesis that the overall
structure of two communities is statistically the same. P values indicate the probability that a similar
association between phylogeny and sample origin would occur by chance (Schloss and Handelsman 2006).
SONS (Schloss and Handelsman 2006) was used to estimate the Chao1 (Chao 1984) species diversity of
29
al. 1996, Yue et al. 2001) and Theta (Yue and Clayton 2005) diversity indices. Both individual community
Chao1 estimates and estimates of the Chao1 diversity shared between two communities (shared Chao1)
were calculated. The abundance-based Jaccard index measures the intersection of the combined
assemblage of phylotypes, and can be considered the probability that given a phylotype present in one
assemblage, it is present in both assemblages (Schloss and Handelsman 2006). By contrast, ThetaYC
corrects for the differences in relative abundance of phylotypes in each assemblage, taking into account
both the incidence of shared phylotypes and the similarity of their relative abundances in each assemblage.
Thus, it can be considered a percentile measure of the similarity of community structures.
Additionally, a plot of number of unique OTUs versus distance was made based on a collector’s
curve using all SPG11 and SPG12 MG-I sequences as input, calculated in DOTUR. A calculation of the
contribution of Taq error to divergence was made according to Acinas et al. (2004), using an error rate of
2x10⁻⁵ per site per duplication (Klepac-Ceraj et al. 2004) and an average amplicon length of 1400 base
pairs, yielding an average of 1.6 errors per sequence, or ~0.11%. This was used as a correction when
Chapter 2
Microbial diversity of oligotrophic abyssal sediments at the southern edge of the South Pacific Gyre
Introduction.
The organic-rich sediments of continental shelves and slopes are the chief sites of carbon burial on
Earth, representing ~98% of marine carbon burial by one estimate (Dunne et al. 2007). Numerous
microbiological studies of deep subsurface sediments with the Ocean Drilling Program (ODP) have focused
on these locations and have recovered phylogenetically diverse, metabolically active bacterial and archaeal
communities (D'Hondt et al. 2004, Parkes et al. 2005, Webster et al. 2006; Inagaki et al. 2006, Biddle et al.
2006, 2008; Lipp et al. 2008; Teske and Sørensen 2006; Teske and Sørensen 2008, Fry et al. 2008). In these
organic-rich sediments, microbial activity depletes high-energy electron acceptors such as oxygen and
nitrate within the surface few millimeters to centimeters; beyond this thin surface layer, subsurface
sediments are entirely dominated by carbon remineralization processes with low standard Gibbs free
energy, such as sulfate reduction, methanogenesis and fermentations.
In contrast, only a few microbiological studies have focused on the deep subsurface sediments of
oligotrophic, open ocean sediments and abyssal basins, e.g., the Peru Basin (ODP Site 1231) and the
eastern equatorial Pacific (ODP Site 1225) (Sørensen et al. 2004, Teske and Sørensen 2008). The more
limited the carbon substrate and electron donor supply, the greater the depth of oxygen penetration. The
upper few centimeters to meters of the sediment column contain the zones of maximal metabolic activity
and cell numbers, which coincide with oxygen depletion and nitrate drawdown (D’Hondt et al., 2004,
2009). The microbial communities of these oligotrophic sediments are composed in part of species closely
related to aerobic seawater Archaea (Sørensen et al. 2004, Durbin et al., 2009) and differ from the microbial
communities in anoxic, organic-rich sediments (Teske and Sørensen 2008, Fry et al. 2008).
Microbial analyses of oligotrophic marine sediments require undisturbed cores of the upper
31
response to oxygen and nitrate consumption. However, these critical upper sediment layers are generally
heavily perturbed, resuspended and mixed with seawater by borehole initiation during deep subsurface
drilling (Lever et al. 2006). To account for missing or low quality data from surficial sediments, deep
subsurface modeling studies ha ve focused on sediments below threshold depths (1.5 meter, D’Hondt et al.
2002).
In this study, we examined the phylogenetic structure of archaeal and bacterial communities from
an abyssal, oligotrophic, oxic to suboxic sediment column (water depth 5306 m) from the margin of the
ultraoligotrophic South Pacific Gyre (Site SPG12, position 45°58’S, 163°11’W), by 16S rRNA clone
library sequencing, in comparison with cell counts and geochemical profiling, using undisturbed gravity
core samples. The results are discussed with special attention to similar microbial communities from
surficial marine sediments (7-100cm) of moderately to highly oligotrophic sites (Inagaki et al. 2001, Wang
et al. 2004, Xu et al. 2005, Wang et al. 2005, Li et al. 2008).
Results.
Geochemistry. Rates of sedimentation, oxygen and nitrate depletion depths, and maximum DIC
values indicate that SPG12 is significantly more oligotrophic than the most nutrient-limited marine
sediments examined from ODP Leg 201. Net heterotrophy due to remineralization of organic matter to
CO2 causes an increase in DIC concentration (D’Hondt et al. 2003). The maximum alkalinity value (of
which ~96% is DIC at seawater pH) for SPG12 revealed this site to be more oligotrophic than sites 1231
and 1225, at 3.23 mM vs. 3.6 and 3.98 mM, respectively, and is much lower than the maximum alkalinity
values found for ODP Leg 201 Peru Margin sites, which range from ~20 mM to ~160 mM DIC (D’Hondt
et al. 2003, 2009; Figure 5). The increase in alkalinity (DIC) with depth at SPG12 appears to be linear and
not exponential in shape, and reaches its maximum and stable value of ~3.2 meq at about 100 cmbsf
(Figure 5). As at Leg 201 oligotrophic sites, oxygen is depleted on a scale of tens of centimeters of the
surface (D’Hondt et al. 2004, 2009). Oxygen decreases exponentially from a value of 114.76 µM at 5
cmbsf to an apparent detection limit of 2-10 µM below ~100-150 cmbsf from, while nitrate declines from a