Cochlear hearing loss and the detection
of sinusoidal versus random amplitude modulation
John H.Grose,1Heather L.Porter,2EmilyBuss,1and Joseph W.Hall III1
1
Department Otolaryngology – Head and Neck Surgery, University of North Carolina at Chapel Hill, 170 Manning Drive, Chapel Hill, North Carolina 27599-7070, USA 2
Hearing and Speech Department, Children’s Hospital, Los Angeles, California 90027, USA [email protected], [email protected], [email protected],
Abstract: This study assessed the effect of cochlear hearing loss on detection of random and sinusoidal amplitude modulation. Listeners with hearing loss and normal-hearing listeners (eight per group) gener-ated temporal modulation transfer functions (TMTFs) for envelope fluctuations carried by a 2000-Hz pure tone. TMTFs for the two groups were similar at low modulation rates but diverged at higher rates pre-sumably because of differences in frequency selectivity. For both groups, detection of random modulation was poorer than for sinusoidal modulation at lower rates but the reverse occurred at higher rates. No evidence was found that cochlear hearing loss, per se, affects modula-tion detecmodula-tion.
VC2016 Acoustical Society of America [QJF]
Date Received:March 22, 2016 Date Accepted: July 5, 2016
1. Introduction
Cochlear hearing impairment is often characterized by diminished nonlinear function-ing of the inner ear. This loss of nonlinearity contributes not only to elevated absolute thresholds, but also to a broadening of auditory filters and a general loss of amplitude compression (for review, seeMoore, 1996; Oxenham and Bacon, 2003). Because of the loss of amplitude compression, the internal representation of a fluctuating stimulus could, in theory, be more pronounced in the hearing impaired (HI) ear than in the normal-hearing (NH) ear. This latter notion gives rise to the expectation that the more pronounced internal representation of fluctuation in HI ears should be beneficial to tasks involving envelope processing. There is some evidence for this in tasks of supra-thresholdenvelope processing: (1) for listeners with unilateral hearing impairment, less modulation depth is required for a fluctuating stimulus presented to the impaired ear than to the normal ear to obtain perceptual equivalence of fluctuation across ears (Moore et al., 1996); (2) for narrow bands of noise with perceptually pronounced inherent fluctuations, gap detection is poorer for HI listeners presumably because of the greater propensity for confusion between the imposed gap and the inherent fluctua-tions (Grose et al., 1989); and (3) masking period patterns are usually more shallow for HI ears than NH ears (Wojtczaket al., 2001).
It is less clear whether the benefit of a more pronounced internal representa-tion of fluctuarepresenta-tion in HI ears extends to tasks involving the detection of modulation. Some studies have found no effect of HI on the detection of modulation (Grose and
Hall, 1994; Moore and Glasberg, 2001; Koopman et al., 2008), some studies have
found poorer performance for HI listeners (Grant et al., 1998), and yet other studies have reported superior performance for HI listeners (Ernst and Moore, 2012; Shen, 2014;Seket al., 2015). Even within a particular study, the effect of hearing impairment on modulation detection can be varied (cf. Desloge et al., 2011). Comparisons across these studies are complicated by confounding factors of age and presentation level. One purpose of this study was to add clarity to the issue of the effect of hearing impairment on modulation detection.
thresholds for random and deterministic modulation—at least for lower average rates of modulation (Mendoza et al., 1995; Ozimek et al., 1998; Sek et al., 2015). Thus, in ears with normal compression there is no suggestion of a detection benefit associated with the sporadic large peaks of random modulation. In terms of HI ears, Shen and
Lentz (2010) measured modulation detection thresholds for random envelopes carried
by a 500-Hz pure tone carrier and found that detection thresholds were quite similar for HI and NH listeners, suggesting that loss of compression does not confer a benefit for the detection of random modulation. Logically, therefore, since modulation detec-tion thresholds are similar for random and sinusoidal moduladetec-tion in the NH ear, and modulation detection thresholds are similar for random modulation for HI and NH ears, it follows that modulation detection thresholds should be similar for random and sinusoidal modulation in the HI ear. This reasoning runs counter to the speculation that the sporadic large peaks associated with random modulation might aid detection in the (non-compressing) HI ear. However, the detection of random and sinusoidal modulation has not been compared for the HI ear, to our knowledge. A second pur-pose of this study, therefore, was to address this lacuna in the literature.
In summary, the purpose of this study was to measure temporal modulation transfer functions (TMTFs) in HI and NH ears for both deterministic (sinusoidal) and random modulation. The objectives were to further clarify the effect of HI on modula-tion detecmodula-tion, and to determine whether the presumed absence of compression in the HI ear confers any benefit for the detection of random modulation.
2. Method 2.1 Participants
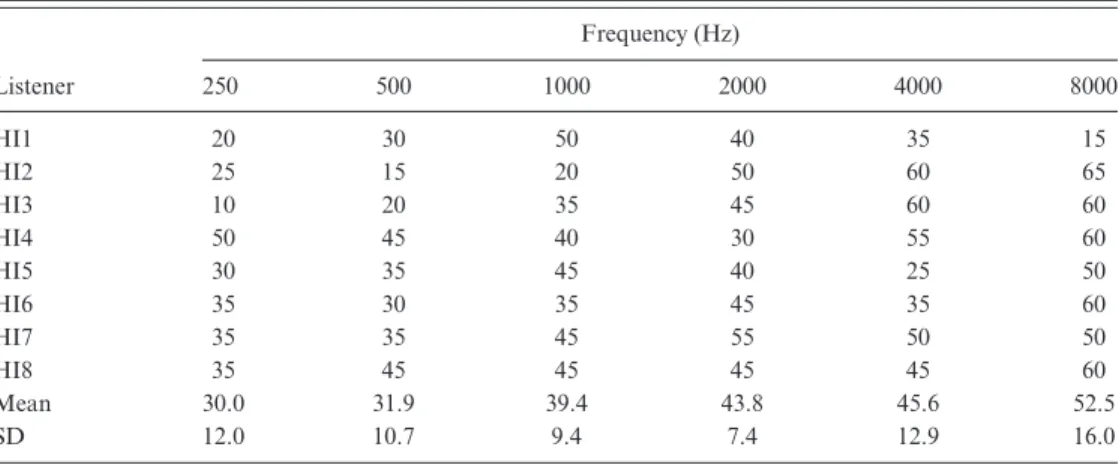
Eight listeners with mild-to-moderate sensorineural hearing loss and eight listeners with normal hearing participated. The NH listeners had pure tone thresholds 20 dB hearing level (HL) at octave frequencies from 250 to 8000 Hz. Air conduction thresh-olds for the test ear of each HI listener (HI1–HI8) are shown in Table 1. In order to avoid the age confound that is present in some earlier studies of modulation detection by HI listeners, care was taken to have substantial age overlap between the two groups. The HI group had a mean age of 50 years (standard deviation¼14 years), and the NH group had a mean age of 47 years (standard deviation¼12 years).
2.2 Stimuli
The signal was an amplitude modulated (AM) sinusoid with a carrier frequency (fc) of 2000 Hz. The modulator was either a raised sinusoid or the raised envelope of a nar-row band of Gaussian noise. The two types of AM stimuli will be referred to as sinu-soidal AM (SAM) and Gaussian AM (GAM).
To generate SAM, the carrier tone was multiplied by a DC-shifted modulator using the equation
s tð Þ ¼ 1þm sin 2pfmtþ 3p
2
sin 2ð pfctþhÞ; (1)
where mis the modulation index, and the modulator frequency (fm) was either 8, 16, 32, 64, 128, or 256 Hz. The starting phase of the modulator was fixed at 3p/2 radians whereas the starting phase of the carrier (h) was randomly selected for each
Table 1. Air conduction thresholds (dB HL) for the test ear of listeners with cochlear hearing loss. Group mean and standard deviation (SD) is also shown for each audiometric frequency.
Listener
Frequency (Hz)
250 500 1000 2000 4000 8000
HI1 20 30 50 40 35 15
HI2 25 15 20 50 60 65
HI3 10 20 35 45 60 60
HI4 50 45 40 30 55 60
HI5 30 35 45 40 25 50
HI6 35 30 35 45 35 60
HI7 35 35 45 55 50 50
HI8 35 45 45 45 45 60
Mean 30.0 31.9 39.4 43.8 45.6 52.5
presentation. To maintain a constant output level of the SAM prior to final stage attenuation, the amplitude of the signal waveform was scaled as a function of modula-tion depth by the factor
1
ffiffiffiffiffiffiffiffiffiffiffiffiffiffi
1þm 2
2
r : (2)
To generate GAM, the 2000-Hz carrier tone was modulated by the envelope of a nar-row band of noise. A range of noise bandwidths was selected to yield average modula-tion rates that coincided with the SAM frequencies (8, 16, 32, 64, 128, and 256 Hz) based on the principle that the average modulation rate of a narrow band of Gaussian noise is approximately 0.64 times the bandwidth (Rice, 1954). To construct a GAM signal having a particular average modulation rate and a particular modulation depth, the stipulated narrow band of noise was first digitally generated and the Hilbert enve-lope extracted. This enveenve-lope was then down-shifted to have a mean amplitude of zero, and subsequently normalized to have a root mean square (RMS) amplitude of 1=pffiffiffi2 (equivalent to the RMS amplitude of a pure tone with peak amplitude¼1). To vary the depth of modulation, this normalized envelope was multiplied by a factor of m. The adjusted envelope was then up-shifted by a constant of 1.0 and multiplied by the carrier to obtain the desired GAM signal. Finally, the GAM signal was scaled to maintain a constant output level prior to final stage attenuation.
For each type of AM, a new stimulus sample was generated for each and every presentation at a sampling rate of 24 414 Hz. Each stimulus was 400 ms in dura-tion, including 50-ms raised cosine rise/fall ramps, and presented at a constant output level of 85 dB sound pressure level (SPL).
2.3 Procedure
Modulation detection thresholds were measured with a three-alternative, forced-choice procedure (3AFC) that incorporated a three-down, one-up stepping rule to converge on the 79.4% correct point. Lights on a response box indicated observation intervals and, following each trial, feedback was provided to participants by illuminating the correct interval. The initial step size for modulation depth adjustment was 4 dB [in units of 20 logðmÞ], and this was halved after the second and fourth reversals to result in a final step size of 1 dB. A threshold estimation track was terminated after ten rever-sals, and the mean of the modulation depths at the final six reversal points was taken as the threshold estimate. At least three estimates of threshold were obtained for each modulation rate, with a fourth obtained if the range of the first three exceeded 3 dB. All estimates obtained were averaged to give the final threshold value.
2.4 Statistical analyses
Repeated measures analyses of variance (ANOVAs) were used to assess group differ-ences between conditions and interactions within variables. Greenhouse-Geisser correc-tions were applied when Mauchly’s tests indicated violacorrec-tions of sphericity. Significant interactions were assessed using simple effects testing. Cohen’sdwas used as a measure of effect size, in which values of 0.20, 0.50, and 0.80 designate small, medium, and large effect sizes, respectively (Cohen, 1992).
3. Results
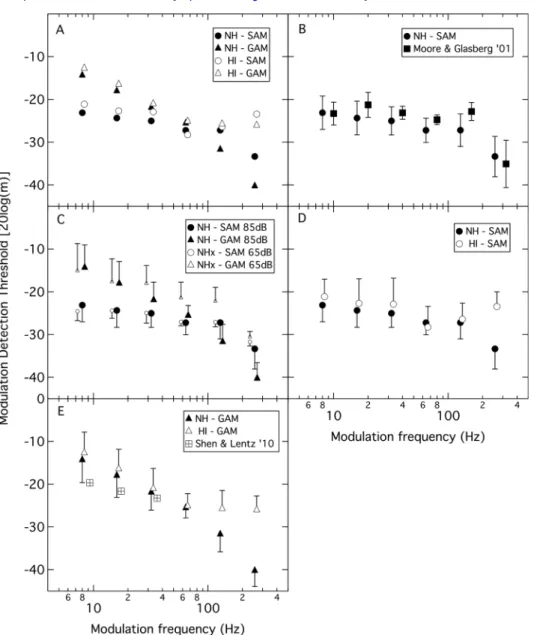
Performance was reasonably similar within each group and is well represented by the group means. The results are shown in Fig.1, where the data have been broken down into sepa-rate panels, with some replication across panels, in order to highlight particular features.
Figure 1(A) provides a general overview of the data pattern, showing the mean data for both groups and modulation types. This portrayal highlights that for both SAM (circles) and GAM (triangles), HI listeners (open symbols) and NH listeners (filled symbols) had similar modulation sensitivity for lower modulation rates. However, performance for NH listeners improved at higher rates, whereas that for HI listeners remained relatively stable. For SAM the divergence occurred at 256 Hz; for GAM the divergence occurred at 128 Hz. At these higher rates, the two listener groups also showed a difference in behavior: whereas the NH listeners exhibited greater sensi-tivity to GAM than SAM at the two highest rates, the HI listeners exhibited relatively similar sensitivity to the two modulation types. For both listener groups, sensitivity to modulation was more acute at the lower rates for SAM than for GAM.
Glasberg (2001)for a 2-kHz carrier (squares). Although the modulation rates, stimulus durations (400 ms vs 540 ms), and presentation levels (85 dB SPL vs 80 dB SPL) dif-fered across studies, the resulting form of the TMTF was similar. Detection thresholds were relatively stable for modulation rates less than about 160 Hz and then improved markedly for the highest rate.
Figure 1(C) shows the SAM (filled circles) and GAM (filled triangles) detec-tion thresholds for the NH listeners. (The smaller open symbols are supplemental data collected at a lower presentation level and are discussed later.) Unlike the SAM data, the GAM thresholds improved monotonically with increasing modulation rate. The SAM and GAM functions crossed, such that the GAM thresholds were poorer than SAM thresholds for lower modulation rates but better than SAM thresholds at higher rates. Statistical analysis showed a significant effect of modulation type [F(1,7)¼5.70; p¼0.048, d¼1.00], a significant effect of modulation rate [F(1.65,11.51)¼67.22; p<0.001, d¼3.10], and a significant interaction between these two factors [F(5,35)¼25.84; p<0.001, d¼1.92)]. The interaction was further evaluated, revealing that the SAM and GAM thresholds were significantly different at each modulation rate (p0.03, d¼0.96–2.92].
Figure 1(D) shows the SAM detection thresholds for both the HI listeners (open circles) and NH listeners (filled circles). There is a close correspondence between
mean thresholds across listener groups for all of the modulation rates except the high-est rate of 256 Hz. Here, the NH listeners showed a marked improvement relative to lower modulation rates whereas the HI listeners showed a slight worsening. This pattern of results was confirmed with analyses revealing no significant effect of group [F(1,14)¼3.36, p¼0.088, d¼0.49], a significant effect of modulation rate [F(3.15,44.12) ¼8.25; p<0.001, d¼0.77], and a significant interaction between these two factors [F(3.15,44.12)¼4.50; p¼0.007, d¼0.57]. The interaction term was assessed, and only the threshold difference at the highest modulation rate was statistically significant [F(1,14)¼23.21; p<0.001, d¼2.40].
Figure1(E) shows the GAM detection thresholds for both the HI listeners (open triangles) and the NH listeners (filled triangles). [The hatched square symbols show data fromShen and Lentz (2010), and are discussed later.] Similar to the SAM data, there was a close correspondence between mean thresholds across listener groups for the lower mod-ulation rates but then a divergence occurred – here, for the highest two rates. Statistical analyses revealed a significant effect of group [F(1,14)¼6.89; p¼0.020, d¼0.70], a signifi-cant effect of modulation rate [F(2.40,33.53)¼92.55; p<0.001, d¼2.58], and a signifi-cant interaction between these two factors [F(2.40,33.53)¼12.33; p<0.001, d¼0.94]. Assessment of the interaction revealed that the two groups did not differ for the lower modulation rates but did for the rates of 128 Hz [F(1,14)¼8.25; p¼0.12, d¼1.44] and 256 Hz [F(1,14)¼66.94; p<0.001, d¼4.09].
4. Discussion
The data pattern for SAM conformed to expectations based on previous work. For NH listeners, detection thresholds remained relatively stable across low modulation fre-quencies but then reached an inflection point above which thresholds improved mark-edly. This improvement at the highest rate reflects audibility of the now-resolved mod-ulation sidebands, wherein the task transitions from one of modmod-ulation detection to one of pure tone (sideband) detection. The modulation rate at which this occurs depends on the carrier frequency (Kohlrausch and Fassel, 2000). Because the band-widths of auditory filters (expressed in Hz) increase with increasing center frequency, the modulation rate at which the side bands become resolved increases with carrier fre-quency. The fact that the HI listeners did not improve at the highest rate for either SAM or GAM supports the interpretation that their auditory filters in the 2-kHz region were abnormally wide, such that the modulation sidebands remained unresolved at the highest rate tested here (cf.Moore and Glasberg, 2001).
Some aspects of the GAM data pattern also conformed to expectations. As just noted, the presumably greater frequency selectivity of the NH listeners enabled them to benefit from sideband detection at the highest modulation rates, unlike the HI listeners, leading to a divergence in thresholds across the two groups at these rates. Sideband detection also likely accounts for the superior thresholds for GAM relative to SAM at the highest modulation rates for the NH listeners. Because of the random fluctuations in frequency of the modulation sidebands for the GAM stimuli, these side-bands would sporadically become resolved at loweraveragemodulation rates than for fixed-rate SAM with the same average rate; in addition, the frequency-modulating nature of these GAM sidebands might enhance their salience and consequently their detectability. Ozimek et al. (1998) also found better detection thresholds for GAM than for SAM at high modulation rates.
level relative to the 65-dB SPL level was offset by the reduced frequency resolution at the higher level. For GAM, there was little effect of level at the two lowest modulation frequencies; however, modulation detection thresholds for the 65-dB SPL stimuli became progressively poorer than for their higher-level counterparts as the modulation rate increased. This suggests that, with the wider frequency dispersion of the modula-tion sidebands associated with the GAM stimuli, the benefit of increased audibility of the resolved sidebands at the 85-dB SPL presentation level was not completely offset by the reduced frequency resolution at that level.
Although the SAM data pattern and some aspects of the GAM data pattern for the full data set at 85 dB SPL conformed to expectations, other aspects of the GAM data pattern were not anticipated, particularly the poorer GAM thresholds at the lower modulation rates relative to the SAM thresholds. Although there is an indi-cation in the results ofShen and Lentz (2010)of a decline in detection threshold as the average rate of a random modulator decreased for both NH and HI listeners, as shown by the hatched squares in Fig.1(E)which are averages across both NH and HI listeners, their pattern is not as strikingly monotonic as in the present dataset. Comparison with their study is limited by the fact that they did not include sinusoidal modulation for reference. Normative tonal TMTFs measured by Ozimek et al. (1998)
andSek (1993) did not show a difference between sinusoidal and random modulation
detection thresholds at lower modulation rates (i.e.,64 Hz). The reasons for this dis-parity at the lower modulation rates are not clear. One likely factor is the difference in the nature of the random modulator across studies. In the present experiment, the modulator was the envelope of a narrow band of noise. In the study of Sek (1993), and some conditions of the study ofOzimek et al.(1998), the envelope randomization was implemented by varying the period-to-period amplitude of a base sinusoidal modulator. The maintenance of constant zero crossings in the modulator imposes a uniform envelope rate. However, Ozimek et al. (1998) also varied both amplitude and frequency on a period-by-period basis in some conditions, and this did not have a pronounced effect at lower frequencies. The various studies also differed in terms of stimulus duration, which determines the number of modulation cycles in the stimulus. The duration of 400 ms employed here contrasts with the durations of 1000 ms and 1500 ms used by Ozimek et al. (1998) and Sek (1993), respectively. Further work is required to clarify the origin of these differences across studies.
5. Summary and conclusion
In summary, this study measured TMTFs for HI and NH listeners using both sinusoi-dal and random modulation carried by a pure tone. Similar performance was observed for the two listener groups at low modulation rates. At higher rates of modulation, there was a divergence between listener groups presumably because the greater fre-quency selectivity of the NH listeners allowed them to benefit from the detection of resolved sidebands, whereas these sidebands were less resolved for the HI listeners. In both groups of listeners, detection thresholds were poorer for random modulation than sinusoidal modulation at low modulation rates.
Acknowledgments
We thank Brian C. J. Moore for his helpful comments on an earlier version of this manuscript. This work was supported by the National Institute on Deafness and Other Communication Disorders R01DC001507 (J.H.G.).
References and links
Cohen, J. (1992). “A power primer,”Psychol. Bull.112, 155–159.
Desloge, J. G., Reed, C. M., Braida, L. D., Perez, Z. D., and Delhorne, L. A. (2011). “Temporal modula-tion transfer funcmodula-tions for listeners with real and simulated hearing loss,”J. Acoust. Soc. Am.129, 3884–3896.
Ernst, S. M., and Moore, B. C. J. (2012). “The role of time and place cues in the detection of frequency modulation by hearing-impaired listeners,”J. Acoust. Soc. Am.131, 4722–4731.
Glasberg, B. R., and Moore, B. C. J. (2000). “Frequency selectivity as a function of level and frequency measured with uniformly exciting notched noise,”J. Acoust. Soc. Am.108, 2318–2328.
Grant, K. W., Summers, V., and Leek, M. R. (1998). “Modulation rate detection and discrimination by normal-hearing and hearing-impaired listeners,”J. Acoust. Soc. Am.104, 1051–1060.
Grose, J. H., Eddins, D. A., and Hall, J. W. (1989). “Gap detection as a function of stimulus bandwidth with fixed high-frequency cutoff in normal-hearing and hearing-impaired listeners,”J. Acoust. Soc. Am.
86, 1747–1755.
Grose, J. H., and Hall, J. W. (1994). “Modulation detection interference (MDI) in listeners with cochlear hearing loss,”J. Speech Hear. Res.37, 680–686.
Koopman, J., Houtgast, T., and Dreschler, W. A. (2008). “Modulation detection interference for asynchro-nous presentation of masker and target in listeners with normal and impaired hearing,”J. Speech Lang. Hear. Res.51, 1588–1598.
Mendoza, L., Hall, J. W., and Grose, J. H. (1995). “Modulation detection interference (MDI) using ran-dom and sinusoidal amplitude modulation,”J. Acoust. Soc. Am.97, 2487–2492.
Moore, B. C. J. (1996). “Perceptual consequences of cochlear hearing loss and their implications for the design of hearing aids,”Ear Hear.17, 133–161.
Moore, B. C. J., and Glasberg, B. R. (2001). “Temporal modulation transfer functions obtained using sinu-soidal carriers with normally hearing and hearing-impaired listeners,” J. Acoust. Soc. Am. 110, 1067–1073.
Moore, B. C. J., Wojtczak, M., and Vickers, D. A. (1996). “Effect of loudness recruitment on the percep-tion of amplitude modulapercep-tion,”J. Acoust. Soc. Am.100, 481–489.
Oxenham, A. J., and Bacon, S. P. (2003). “Cochlear compression: Perceptual measures and implications for normal and impaired hearing,”Ear Hear.24, 352–366.
Oxenham, A. J., and Plack, C. J. (1997). “A behavioral measure of basilar-membrane nonlinearity in lis-teners with normal and impaired hearing,”J. Acoust. Soc. Am.101, 3666–3675.
Ozimek, E., Konieczny, J., Suzuki, Y., and Sone, T. (1998). “Detection of random amplitude modulation,” Acustica84, 1109–1118.
Rice, S. O. (1954). “Mathematical analysis of random noise,” inSelected Papers on Noise and Stochastic Processes, edited by N. Wax (Dover, New York).
Sek, A. (1993). “Perception of irregular amplitude changes of sinusoidal signals,” Acustica77, 262–269. Sek, A., Baer, T., Crinnion, W., Springgay, A., and Moore, B. C. (2015). “Modulation masking within and
across carriers for subjects with normal and impaired hearing,”J. Acoust. Soc. Am.138, 1143–1153. Shen, Y. (2014). “Gap detection and temporal modulation transfer function as behavioral estimates of
auditory temporal acuity using band-limited stimuli in young and older adults,”J. Speech Lang. Hear. Res.57, 2280–2292.
Shen, Y., and Lentz, J. J. (2010). “Effect of fast-acting compression on modulation detection interference for normal hearing and hearing impaired listeners,”J. Acoust. Soc. Am.127, 3654–3665.