GOVERNMENT INVOLVEMENT IN RELIGION: CAUSES AND EFFECTS OF OPEN RELIGIOUS MARKETS
Tim Cupery
A dissertation submitted to the faculty at the University of North Carolina at Chapel Hill in partial fulfillment of the requirements for the degree of Doctor of Philosophy in Sociology in the College of Arts
and Sciences.
Chapel Hill 2013
iii ABSTRACT
Tim Cupery: Government Involvement in Religion: Causes and Effects of Open Religious Markets (Under the direction of Kenneth A. Bollen)
This dissertation examines measurement of government policies toward religion, country-level predictors of those policies, and the impact of policies on religiosity. I use the term Government Involvement in Religion (abbreviated GIR) to denote multiple dimensions by which government policies may impact the religious market.
The first chapter builds measures for multiple dimensions of GIR. I improve on prior
measurement strategies by combining the best available data with theoretical definitions distinguishing between dimensions, and testing multi-dimensional measurement models. I test confirmatory factor analysis models and present difference tests showing that dimensions are empirically distinct.
The second chapter analyzes which sorts of countries are most likely to be involved in the religious market, and in what ways. The data show an unsurprising strong inverse relationship between Liberal Democracy and GIR, vetted against concerns of endogeneity. However, over-time changes in democracy do not predict over-time changes in GIR. Financial Favoritism appears to be empirically compatible with Democracy, but Legislative Favoritism does not. Most interestingly, multivariate analyses show a significant positive relationship between GDP and GIR, in both between-country
differences and over-time changes. While simple correlations show that more-developed countries tend to have less GIR, when controlling for other factors – particularly Liberal Democracy – GDP tends to predict more government involvement in the religious market.
iv
dimension(s) drive the oft-observed negative relationship with religiosity. The analyses find no
v
ACKNOWLEDGEMENTS
During my ample time in graduate school, I have received support and encouragement from many people. My greatest thanks go to my dissertation committee members, and especially to Ken Bollen for giving feedback on numerous drafts, applying pressure as needed, and for generally not showing up in unexpected places if I was trying to avoid him. To Jackie Hagan, I am particularly thankful for moral support, including pointing out the positives of being a well-rounded person. To Guang Guo, Francois Nielsen, and Mike Shanahan, I am thankful for continued encouragement.
Thanks to Jonathan Fox and Brian Grim for collecting data and making it publicly available. I owe thanks and great appreciation to many friends, for their help in my completing this dissertation and keeping me sane in the process. To Mark Elliott, I have appreciated the friendship and conversation. To Hank Tarlton, for support and encouragement. To Jason Staples, for helping me stay focused toward work, as well as fit and injured and with some life-of-the-body balance. To Jennifer Donnally for dinners, concerts, talking through the big questions of graduate school, and providing outside-of-the-box perspective. To Sarah Chisolm, for working as a (hopefully mutually beneficial) study partner during summer 2013. To Ben Sammons for being a regular study partner in previous years. And to Victor Wong, for friendship and conversations about life and structural equation modeling.
I am grateful to my family for many things, some of which are relevant to my completing this dissertation. Teaching me to think and question sometimes came back to bite you, but it was probably a necessary condition for my eventual grad school. I am ever grateful for your support and love. And to my brother Dave, your own doctoral work has impressed me, and motivated me to finish ahead of you.
vi
TABLE OF CONTENTS
INTRODUCTION ... 1
CHAPTER 1 – MEASURING GOVERNMENT INVOLVEMENT IN RELIGION ... 4
Review of Concepts and Theories ... 5
Prior Measures of Government Involvement in Religion ... 7
Defining Dimensions of GIR ... 15
Building Measures of Specified Dimensions ... 16
Restrictions on Minority Religions ... 19
Restrictions on Proselytizing and Conversion ... 21
Restrictions on Majority Religion or All Religions ... 22
Legislative Favoritism ... 23
Financial Favoritism ... 26
Defending Dimensions as Distinct ... 26
Minority Restrictions vs. Majority Restrictions ... 28
Minority Restrictions vs. Legislative Favoritism ... 30
Excursus: Is Difference Testing Trustworthy? ... 30
Restrictions on Proselytizing or Conversion ... 33
Legislative and Financial Favoritism ... 35
Conclusion ... 35
CHAPTER 2 – STATE STRUCTURE AND GOVERNMENT INVOLVEMENT IN RELIGION ... 36
Theory and Definitions ... 37
Government Involvement in Religion ... 37
Why do governments engage in GIR? ... 39
Democracy ... 40
GDP and Development ... 44
vii
Combining Theorized Factors ... 47
Measurement... 48
Government Involvement in Religion ... 48
Democracy and Endogeneity with GIR ... 49
Religious Diversity ... 51
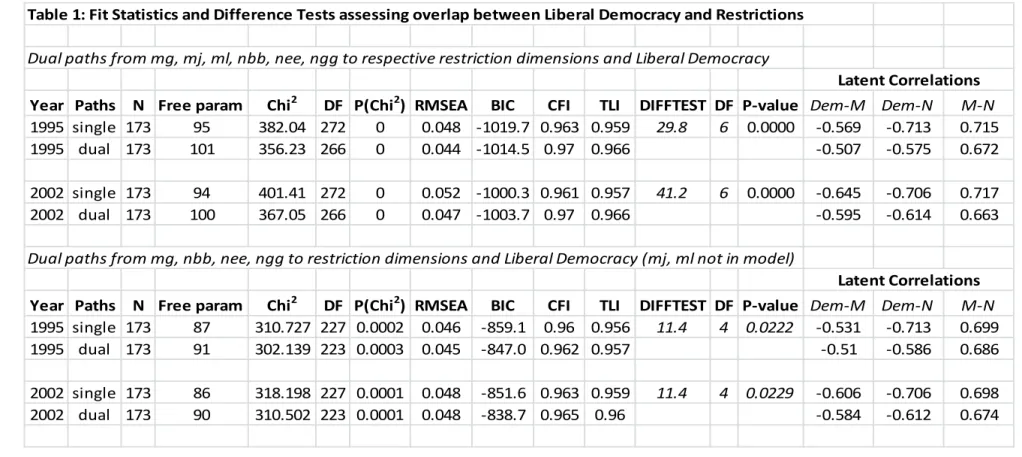
Assessing measurement-overlap between Liberal Democracy and Religious Restrictions... 51
Panel Analyses predicting GIR Dimensions ... 56
Modeling Strategy ... 57
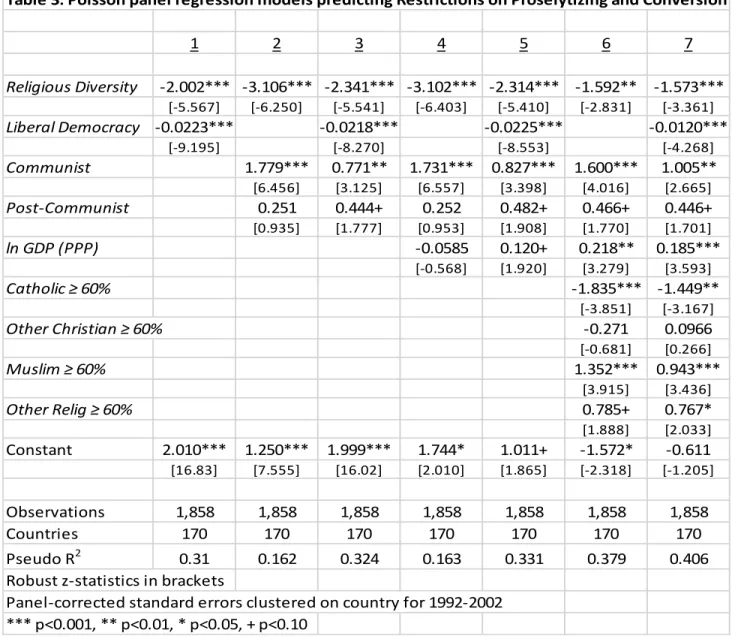
Results of Panel Regression Models ... 60
Results of Fixed-Effect models ... 75
Conclusion ... 76
CHAPTER 3 – GOVERNMENT POLICY AND RELIGIOSITY ... 81
Theoretical Background: Religious Economies ... 82
Defining Religiosity ... 85
Prior Measures of GIR and Associated Findings ... 87
Defining Dimensions of GIR ... 91
Causal Mechanisms and Hypotheses ... 92
Research Design ... 96
Measuring Religiosity ... 97
Measuring GIR ... 99
Control Variables ... 99
Results and Discussion ... 100
Conclusion ... 107
CONCLUSION ... 111
APPENDIX – MEASURES OF GOVERNMENT INVOLVEMENT IN RELIGION ... 114
1 INTRODUCTION
The past two and a half years have been eventful for those interested the relationship between religion and state. The events of the Arab Spring have collapsed regimes, initiated civil wars, and more generally seen a number of countries publicly wrestling with the role that religion should play in politics – and the role that government should have to protect or regulate religion. This dissertation is not about the Arab Spring or the role of religion in democratic transitions, but my topic is relevant to these
questions. My focus is on the other side of this issue: government policy toward religion. The relationship between religion and the state plays an important role in national and international politics, and has been increasingly recognized as such by social scientists (Smith and Woodberry 2001; Wald and Wilcox 2006). Government policy toward religion is relevant to
understanding a wide range of outcomes, including democratization (Woodberry 2012), group-on-group persecution and civil conflict (Grim and Finke 2007, 2011), and levels of religious activity (Iannaccone 1991; Chaves and Cann 1992; Gill 1998; Stark and Finke 2000; Froese 2001, 2004). Social science historically ignored the relationship between religion and state, presuming religion would decline as a casualty of modernity (Fox 2008; Stark and Finke 2000). While it is possible that this prediction may prove correct, religion has not gone quietly. Events such as the Iranian Revolution and the rise of the Religious Right in the United States captured public opinion, and religion has remained a focus of government policies across the world.
2
where consumers choose between a range of religious and ideological options offered by various suppliers (Iannaccone 1991, 1992; Stark and Finke 2000). Government favoritism may create religious monopolies, and governments can also restrict some or all religions. Due to the substantial range of government policies toward religion, I use the term Government Involvement in Religion (abbreviated GIR) to denote multiple dimensions by which government policies may impact the religious market.
What sorts of countries are most likely to restrict religious practice within their borders? How do various government policies affect religious vitality in a country? The three chapters composing this dissertation examine grouping and measurement of the dimensions of GIR, country-level predictors of government policies, and the impact of GIR policies on religiosity.
The first chapter of the dissertation deals with measurement of GIR; I improve on prior measurement strategies by combining the best available raw data with careful theoretical definitions distinguishing between dimensions, and testing model fit and statistical differentiability of dimensions. There are numerous specific government policies, such as laws against blasphemy, restrictions on the ability of minority religions to purchase property, or government subsidies to pay the salaries of clerical personnel for a certain religion. In order to effectively study government regulation of religion, it is important to define and measure distinct sub-dimensions of GIR, aggregating groups of policies to create indices. To this end, I review theoretical and empirical research on GIR, define sub-dimensions, assess available data, test measurement models, and finally present difference tests showing that dimensions are statistically differentiable.
3
democracy. As a result, prior findings may overestimate the strength of any causal relationship between democracy and GIR, which may also bias other coefficients in multivariate analysis. I assess which indicators of GIR have potential overlap as measures of democracy, and exclude those indicators from indices of GIR used in this chapter. Among other variables of interest, the chapter highlights the positive association between GDP and GIR, and theorizes the mechanism by which this occurs.
The third chapter examines the relationship between GIR and institutional religiosity. An open religious market allows the conditions for competition between religions, and subsequent increased incentive to recruit members, and increased recruitment activity should result in higher rates of religious practice. While most prior research evidences this negative relationship (higher GIR leads to lower religiosity), findings have not always been consistent, and prior studies have rarely used quality data with a large sample of countries. As such, research in this field has rarely distinguished between the impacts of different dimensions of GIR. I use multiple dimensions of GIR (as defined and measured in the previous chapter) to better address the question of which dimension(s) drive the frequently-observed negative relationship. While the analysis finds no significant predictors of over-time change in religiosity – partly because of a limited sample of countries and time – cross-sectional analysis shows that
4
CHAPTER 1 – MEASURING GOVERNMENT INVOLVEMENT IN RELIGION
Relationships between religion and state are increasingly recognized as important to national and international politics. There are many reasons to pursue cross-national study of religion-state relations. In addition to the many people who care about religious freedom (whether for its own sake, or more frequently for the sake of their own religious group), the relationship between different social and civic freedoms is important to scholarship on democracy (e.g., Sen 1999; Woodberry 2004). Tensions between religious groups often play a role in civil conflicts, throughout history and continuing today. Scholars studying governmental policies toward religion find that countries where religion is more regulated tend to have lower levels of religious participation and attendance (e.g., Chaves and Cann 1992; Chaves, Schraeder, and Sprindys 1994; North and Gwin 2004; Fox and Tabory 2008), as well as more religious persecution and conflict (Grim and Finke 2007, 2011). While the United Nations supports freedom of religious belief and practice, and most countries have constitutional statements with some respect for religious freedom, actual governmental regulation of religion varies widely between countries (Grim and Finke 2007) and is not strongly-predicted by constitutional content (Fox 2011b).
5
project are coded back to 1800, little quality data on religion-state relations exists prior to 1990.1 With
the recent development of quality datasets on government policies toward religion, there is a need for standardization of measures. Two quality datasets have been assembled within the past decade: Jonathan Fox’s Religion and State data (see Fox and Sandler 2003; Fox 2008, 2011a) and Grim and Finke’s International Religious Freedom data (see Grim and Finke 2006) both offer indices multiple dimensions of governmental policies and action toward religion, and are coded for the majority of countries in the world.
I examine these data sources and use the raw data to build optimized measures. This paper adds to existing literature by distinguishing, theoretically and empirically, between multiple dimensions of government policies and actions toward religion. First, I review relevant concepts and theories. Second, I review past and present measures. Third, I define dimensions to measure. Fourth, I test measurement models based on these theoretical definitions. And fifth, I test whether these dimensions are statistically differentiable.
Review of Concepts and Theories
Governmental regulation of religion became a focal point of social-scientific research with the advent of the Religious Economies approach to religion. Sometimes referred to as the Supply Side perspective or the New Paradigm (Warner 1993), this perspective views religion as a market where religious consumers choose between a range of religious and ideological options offered by various suppliers (Iannaccone 1991, 1992; Stark and Finke 2000). While this perspective developed in attempt to
6
explain religious activity in the United States (Finke and Stark 1989, 1992; Finke 1990), it has been applied in cross-national research on religion, as well as case studies in Eastern Europe, Latin America, Japan, (Froese 2001, 2004; Gill 1998; Iannaccone, Finke, and Stark 1997; Stark and Finke 2000).
Finke and Stark (1989, 1992; also see Finke 1990) first discussed the relevance of regulation versus an open religious market. Their historical-sociological focus on the U.S. case details how the lack of an established, state- supported religion and resulting deregulation of the religious market allowed for entrepreneurial-driven religious activity and growth, as well as religious toleration and religious freedom. While social pressures on individuals still existed, the state did not actively limit the religious market, either by restricting individual choice of religious affiliation or by restricting the operation of some religious brands.
There are multiple mechanisms by which governmental regulation is theorized to impact religious activity. An open religious market creates the conditions for competition between religions, and subsequent increased incentive to recruit members. Conversely, Governmental policies that give preferential status to a given religion or establish an official state religion decrease this competition, so that monopolistic religions have less incentive to be responsive to the demands and preferences of the population. Restrictions on minority religions result in greater costs of entry and operation in the religious market. As a result, individuals have less choice of religion, whether directly (by restrictions against converting or adhering to certain religions) or indirectly (because the market is suppressed). Additionally, state-supported religions may be viewed in a negative light because of its preferential treatment or enforced status. Government enforcement of religious laws and norms can lead to resentment against state religion (Iannaccone 1995), and state-supported religion may become
7
Countries (Chaves et al. 1994; Finke and Stark 1992; Finke 1997; Froese 2001; Iannaccone et al. 1997; North and Gwin 2004; Stark and Finke 2000; Stark and Iannaccone 1994; Yang 2006).
Supply-side mechanisms do not always link decreased regulation with increased religious activity. Froese and Pfaff (2001), for example, argue that new freedom in post-communist Poland and East Germany allowed for more competition from secular options, which in a sense are also players in the religious marketplace. Similarly, Gill and Lundsgaarde (2004:424) note that less governmental involvement in religion, "individuals are correspondingly more free to not only express belief in a minority religion, but non-belief as well."
More recent research shows a connection between governmental regulation of religion and religious persecution, a link that is also expected within the Religious Economies perspective. Stark and colleagues (Stark and Finke 2000:199–202; Stark and Iannaccone 1994:232) note that religious
monopolies depend on the coercive force of the state in order to maintain their privileged status. A religion having monopolistic status does not require that other (typically minority) groups be persecuted, but it does imply the political ability to do so, and the gap between giving one’s group political advantage through law, and directly persecuting other groups, is not large. Grim and Finke (2007, 2011) explore this link empirically, and find that governmental regulation of religion is positively linked to religious persecution. These processes can provide a baseline for civil conflict, as religious groups who are shut out of the political process are more likely to radicalize. For example, Moaddel (2005:342) links the rise of militant fundamentalism in Algeria, Egypt, Iran and Syria to state suppression of the social functions of religion.
Prior Measures of Government Involvement in Religion
8
abbreviated GIR) to denote multiple dimensions by which governmental policies may impact the religious market. The term "religion-state relations" is too vague, and "governmental regulation of religion" is too specific, as certain governmental interventions in the religious market (e.g., financial subsidies toward a favored religion) do not qualify as regulation.
Data on GIR is more useful to the extent that it measures specific practices or multiple
dimensions, and most data used by scholars meets at least one of these criteria. As a contrary example, Freedom House offers a single scale of religious freedom (Marshall 2008) where each country is
assigned a single value ranging from 1 (most free) to 7 (least free), similar to Freedom House’s rankings of political rights and civil liberties. The most recent edition of these data includes 100 countries, but is of limited usefulness because it does not distinguish different factors contributing to religious freedom.
Most GIR-related research prior to the past decade used measures based on the reports in Barret et al’s World Christian Encyclopedia (most recently published in 2001). While assembled to aid Christian missionary efforts, the WCE is generally well-regarded by scholars and is considered a credible resource about religion across countries (Grim and Finke 2006). The WCE includes cross-national data on religious affiliation and activity for all major religions, with some measures available back to the 1970’s. While the specific measures coded by the WCE are problematic, the reports and data have been used in conjunction with other sources to code multiple items measuring GIR.
9
2008). The WCE also includes a dichotomous measure for the existence of a state religion (specifically, whether a state has a “religious philosophy”) but the meaning is unclear and there is no evidence of degree. While this measure has been used in a number of scholarly studies, there are clearly significant gradations (as well as multiple dimensions) to having a “state religion.”
Chaves and Cann (1992; also used in Chaves et al. 1994) coded 6 dichotomous items measuring various aspects of governmental policies toward religion in 18 European countries.2 The items were
chosen to reflect "a direct financial subsidy or benefit to a religious institution, exactly the kind of ‘public’ support that should produce monopolistic laziness, according to the economic theory” (Chaves and Cann 1992:280), but the range of measured behaviors include state control of religion (appointing or approving church leaders) as well as preferential treatment and subsidies. This index was later expanded to 20 items and also used in later studies with different country samples (Gill 1999; Norris and Inglehart 2004). However, this wider range of items was again used to construct a single index instead of separating out multiple dimensions of GIR, and some of the individual items are themselves
multidimensional. For example, “The state appoints or approves church leaders, church leaders appoint or approve government officials, and/or church leaders have specific positions in the government” is coded based on both directions of influence and control between religion and state. Moreover, each coded item is dichotomous, and so do not capture variation degree of specific practices.
Recent better-quality data have come at least in part from coding of the U.S. State Department’s International Religious Freedom Reports. Grim and Finke (2006, 2007) defend the reports as a data source, noting that the reports appear to be “honest fact-finding” independent of diplomatic considerations – for example, despite the generally friendly relationship between the U.S. and Saudi Arabia, reports for that country note that “religious freedom does not exist.” Similarly, Fox (2011a:18) notes that in coding the Religion and State dataset, which relied on multiple sources, the International
10
Religious Freedom Reports were found to be extremely reliable, although sometimes incomplete. However, Fox notes the value of relying on multiple sources because of significant (unwarranted) skepticism within the academic community that “any branch of the U.S. government can produce an unbiased report.” Multiple researchers have coded these data for scholarly use.
North and Gwin (2004) coded 9 dichotomous items using the State Department reports, for a sample of 59 countries. They used two of these items as predictor variables, but also built a simple summed index and did not present any tests for validity, and the dichotomous variables do not give any measure of degree of each form of regulation. The 9 items measure a range governmental actions and policies, including restrictions on conversion and missionaries, governmental oversight or censorship of religious groups, and funding of certain groups.
The measures discussed thus far coded dichotomous items measuring a range of GIR behaviors. However, they were used in single scales, treating GIR as a single dimension. More recently-coded data has organized items into indices measuring multiple dimensions of GIR.
The first clear distinction of GIR dimensions is between restrictions and favoritism. Following Durham (1996), Stark and Finke (2000) distinguish between suppression and subsidies, noting that suppression represses innovation in the religious market, whereas subsidies simply remove some incentive for the majority religion to be attuned to religious preferences of the public by making majority religious institutions less dependent on their adherents. Gill (2008) similarly distinguishes between two main ways that governments can be involved with religion and limit the existence of an open religious market. The government can place negative restrictions on religious liberty, from barriers on the entry of missionaries and limitations of specific practices to requirements that religious groups must register, and barriers to the purchase or rental of property for religious groups to meet.
11
It is worth noting that restrictions and favoritism are not necessarily opposites. Both constitute GIR and would not exist in a free religious market. Often, the two methods are combined, such that the preferred religious group faces fewer negative restrictions. Additionally, supportive policies can
sometimes serve as indirect instruments of government control. Government support of a dominant majority religion doesn't always mean freedom for that religion; support usually comes with strings attached, with some degree of state control over the religion being supported. A "state religion" can mean that religion has power over the government, or that government keeps control over religions and uses support-with-strings to keep the majority-religion in-line. For example, Shia Islam is the official religion of Iran, and the Iranian regime has repeatedly used force to stifle theological debate that is normal within the religion's history (Kurzman 2001).
In their substantial coding of the U.S. State Department’s International Religious Freedom Reports, Grim and Finke (2006, 2007) follow this typology by separately measuring restrictions and favoritism. They define these dimensions as follows:
Government Regulation: “the restrictions placed on practice, profession or selection of religion by official laws, policies, or administrative actions of the state.” They note that restrictions are not limited to formal laws or constitutional statements (Grim and Finke 2006:7).
Religious Favoritism: “subsidies, privileges, support, or favorable sanctions provided by the state to a select religion or small group of religions.” This includes official support as well as de facto support, from direct financial subsidies to the teaching of religion in state-run schools (2006:8).3
Each is treated as a single dimension; Grim and Finke do not differentiate between different sorts of restrictions or between different sorts of favoritism. The items composing their Government Regulation Index (GRI) and Government Favoritism Index (GFI) are shown in the appendix. These items appear to be
12
reasonable measures of their specified dimensions. However, the items tend to be somewhat vague and are not always measuring a distinct or specific practice, and therefore leave more room for subjective judgment by the coder. While “Missionary work is restricted or prohibited” (mssnry) is specific, “Government interferes with individual’s ability to worship” (gvintf) and “to what extent is there a favored or established religious brand” (estrel) could cover a wide range of governmental practices.
Since Grim and Finke’s data is based only on the State Department reports, it does not include countries to which the U.S. has limited access (e.g., North Korea, Libya) or the U.S. itself or U.S.-controlled territories. These data were initially coded for 2003, and are now also available for 2001, 2005, and 2008.
The most ambitious data-collection on governmental regulation of religion is the Religion and State project, headed by Fox (2008, 2011a). These data are currently coded for each year from 1990-2002, for 175 countries. Unlike Grim and Finke’s data, the RAS data are coded from a variety of available sources, including the World Christian Encyclopedia, various journalistic and country-specific academic sources, as well as the U.S. State Department’s International Religious Freedom Reports. Reports were written for each country and then coded. About 25%, selected for even representation across region, majority religion, coder, and country size) were double-coded to ensure reliability.
Fox (2008, 2011a) builds indices measuring three dimensions of GIR. Like Grim and Finke, he builds separate indices measuring restrictions and favoritism, but also separates two types of
restrictions: those that apply to the majority religion or all religions in a country, and restrictions that apply specifically to minority religions. These dimensions are defined as follows (Fox 2011a:13–15):
Religious Discrimination: limitations that are placed on the religious practices or religious institutions of minority religions but not those of the majority religion.
Religious Regulation: restrictions that are placed on all religions or the majority religion. Religious Legislation: the extent to which the government supports religion. This includes
13
Fox’s two measures of restrictions (Religious Discrimination and Religious Regulation) are effectively sub-dimensions of Grim and Finke’s Governmental Regulation, and distinguish regulations that apply only to minority religions from regulations that apply to all religions. Restrictions that are specifically applied to minority religions can, in conjunction with favoritism, be part of an overall position of state-supported religion. Scholars studying civil conflict and democracy are frequently interested in the treatment of minority groups4 for reasons that also hold true regarding religious discrimination.
Restrictions on minority religions are an easy political way to curry favor of the majority population in a country that does not place a high value on freedom.5 However, not all restrictions on religion single out
minority groups. Many countries have regulations on religion that apply to all religions, including any majority religion(s). These approaches to regulating religion are conceptually differentiable: while either type of restriction limits the religious market, they do so in different ways, and for potentially different motives. Consider the ideal-type cases of Saudi Arabia and China. Saudi Arabia has a single privileged religion, and all other (minority) religions are basically illegal. China places heavy restrictions on all religions. It could be argued that these motives are very different (e.g., Saudi Arabia protects the status of Wahabbi Islam, while China considers all religions a danger) or that they are similar (e.g., both China and Saudi Arabia want to protect the authority and ideology of the State).
It is possible that restrictions on minority religions do not differ much in motive or impact from restrictions on majority religions or all religions. As Froese’s work on former communist countries highlights, non-religious ideological positions can effectively be players in the religious marketplace (Froese and Pfaff 2001; Froese 2004). From this view, restrictions applied to all religions may effectively be part of a monopolistic strategy, giving a privileged position to secularism. Monsma and Soper (2009) note that in some democratic countries (e.g., the United States), secularism is considered a “neutral
4 For example, see work based on the Minorities At Risk data (e.g., Fukuda-Parr et al. 2008; Melander 2009; Öberg, Möller, and Wallensteen 2009; Sorens 2011).
14
space” between religions, while in others (e.g., The Netherlands) secularism is considered another ideology.6 Nevertheless, it is worth separately measuring these dimensions of restrictions, and
empirically testing whether they cluster separately from each other, and have different effects or associations.
While Fox’s definition of Religious Legislation is very similar to Grim and Finke’s definition of Religious Favoritism, the indicators used to construct their measures imply multiple sub-dimensions of favoritism. Grim and Finke define Governmental Favoritism to include a wide variety of preferential policies and actions from the government, four of the five items in their index are specifically about funding or in-kind subsidies, while the other item (estrel) does not specify the nature of favors or establishment of religious brand. As a result, Grim and Finke’s Governmental Favoritism Index is mainly measuring preferential treatment via funding or other subsidies. Fox defines Religious Legislation similarly to Grim and Finke’s definition of Religious Favoritism, intending to measure non-suppressive favoritism. However, the items composing the index cover ties in either direction between government and religion, not all of which are necessarily favoritism or giving advantage to one religion over another. The items clearly measuring favoritism are legislatively-focused, where a favored religion has influence and control within the government (including legislating and enforcing religious precepts as law).
The differences between these two indexes point toward two distinct sub-dimensions of governmental favoritism toward religion. These two forms of favoritism – positive financial support and subsidies, and legislative control or advantage – may or may not be undertaken for similar motives, but in more-democratic countries, legislation of religious laws is less likely to take place than inequitable subsidies toward religious groups. As noted by Driessen (2010), financial favoritism and subsidies do not necessarily infringe on the autonomy of religion and state institutions necessary to democracy, but legislative control or advantage does.
15
There is one more potentially important dimensional distinction. Religious choice is specifically important to conceptions of religious freedom – Article 18 of the Universal Declaration of Human Rights (United Nations 1948) specifically mentions that freedom of religion includes the freedom to change religion. Choice of religion is also central to the idea of an open religious market. Competition in the religious marketplace includes the ability to proselytize, the value of which is predicated on the ability to change one’s religion. While governments obviously cannot directly regulate beliefs and conscience as these exist in people’s minds, proselytizing or changes in affiliation can be regulated (e.g., sanctions against people who convert away from the majority religion, or restrictions on proselytizing by citizens or missionaries). While some forced-secularism regimes such as Soviet Russia have restricted
proselytizing, in most cases restrictions on proselytizing or conversion are used to disadvantage minority religions. However, because of the importance of religious choice to religious market theory, it is worth testing whether they cluster separately from other restrictions on religion.
Defining Dimensions of GIR
In order to best study religion-state relations and governmental policies toward religion, it is important to define and measure clear and distinct dimensions of GIR. This is a balancing act between breadth and parsimony. There are numerous specific governmental actions and policies that can affect religion: for example, the state may directly pay the salaries of personnel for certain religious groups, or restrict the ability of some or all religious groups to publically proselytize. While certain specific practices may be of special interest to researchers, data on GIR will generally be most useful when aggregated into distinct, theoretically-defined dimensions. Future research can show which dimensions are most important in their impacts and associations.
16
funding and subsidies or legislative advantage to some religions over others. This distinguishes five sub-dimensions – three types of restrictions and two types of favoritism.
Restriction sub-dimensions:
o Proselytizing Restrictions: restrictions on conversion or proselytizing, including restrictions on missionaries
o Minority Restrictions: restrictions applied specifically to minority religions, including restrictions against worship, organization, assembly, and teaching, or holding property for these purposes
o Majority Restrictions: restrictions on the majority religion or all religions, including restrictions against worship, organization, assembly, teaching, and holding property for these purposes
Favoritism sub-dimensions:
o Legislative Favoritism, where the religious laws of a specific religion are legislated as the national-civic laws, or the favored religion is given specific forms of governmental control
o Financial Favoritism, where the state gives preferential treatment (via special tax breaks, funding or other subsidies) to one or some religions that are not given to others These dimensions are best measured based on what states actually do. As noted above, most countries have statements about freedom of religion in their constitutions, but such shows have little power in predicting actual enforced policies. In some cases, governments justify restriction of religious speech (or speech about religion) for the purpose of protecting religion. For example, India – under the justification of protecting religion and maintaining peace – prohibits any expression of views which someone might consider insulting to his or her religion. Because of examples like these, it is important to use data measuring actual governmental behaviors and enforcement, rather than official constitutional statements or stances.
Building Measures of Specified Dimensions
17
items, for three reasons: First, each of Fox’s items measures a specific governmental practice or policy toward religion, whereas some of Grim and Finke’s items are more abstract and therefore leave more room for coder judgment. Secondly, Fox’s coding distinguishes between restrictions applied to minority religions and restrictions applied to all religions or the majority religion. Third, Fox’s data are available for a wider range of years. Grim and Finke have coded the U.S. State Department’s International Religious Freedom Reports for 2001, 2003, 2005, and 2008, while Fox’s data are currently available for 1990-2002 and will soon be available through 2008. However, I Grim and Finke’s favoritism index to measure Financial Favoritism, as Fox’s data do not include any such items measuring subsidies to religion.
Indices measuring a dimension should be composed of items that empirically cluster together. This is a more specific criterion than summing all items that could be categorized under a given concept, because some of those items might be negatively related to each other or even mutually exclusive. Many researchers present a Cronbach's alpha to defend the coherence of indices, but this statistic is problematic for use in defense of the co-variation of a group of items.7 I use Confirmatory Factor
Analysis to test how well a group of items measure the same empirical dimension.8 If a group of items
measures the same empirical dimension, then the practices or policies measured by the group tend to cluster together, or co-occur. Since the measurement scale of items in Fox’s data is ordinal and not continuous, the items were treated as ordinal categorical variables using Weighted Least Squares
7 Cronbach's alpha is sensitive to the number of items, with more items producing a larger alpha for a given quality of fit. Additionally, alpha makes a variety of implausible assumptions: equal loadings on items, uncorrelated errors between items, and equal error variances, and the existence of only one dimension.
18
estimation. This technique uses a covariance matrix based on polychoric relationship between the items (Muthén 1984; Bollen 1989).9
I use Confirmatory Factor Analysis to test how closely a group of indicators measure the same empirical dimension. This assumes two things. First, it treats the indicators as effects of the state's underlying propensity, rather than causes of the state's propensity. For example, it makes little sense to say that government restrictions on the purchase of property by minority religions cause the
government's general posture toward restricting minority religions. Secondly, my use of Confirmatory Factor Analysis assumes that the indicators are measuring a continuous underlying latent variable, as opposed to a typology or classification based on different groups. Although Political Economies are often classified in categories, this approach has the downside of reifying the categories when the real world is messy and mixed, usually with gradations. For example, Political Science research often uses
dichotomous measures of democracy, but indices of democracy do not show a bimodal distribution, and dichotomizing such a measure throws away useful variation in the data. Government Involvement in Religion does not appear to be composed of ideal types as might be initially assumed. It is easy to consider extreme cases or “tails” of a distribution to establish ideal types, but this does not imply an actual bimodal distribution of traits, propensities or effects. While we may discuss “the Swedish model” or “the Iranian model” of religion-state relations, actual GIR policies are the result of negotiations and compromises built up over time within each country. Even within “Western Democracies” there is substantial gradation and diversity in treatment of religion (Monsma and Soper 2009). Theoretically, the underlying propensity of a country to regulate religion may be expressed in a variety of ways. Combining multiple indicators, each measuring the degree of a specific practice or policy, produces measures of GIR dimensions with rich gradation.
19
I use two main criteria for choosing and excluding items to measure a given dimension. First, items should validly measure the theoretically specified dimension, both theoretically and empirically. Theoretically, the item should have face validity as a measure of the specified dimension. Empirically, the item should co-vary with other items measuring the same dimension. Secondly, I exclude items that have little variation between categories. For example, mk (forced conversions) has 169 of 175 countries coded as 0. Such items may measure the intended concept, but are better excluded for practical reasons. In a simple additive scale, such items add little variation into the scale, and excluding them has little effect on empirical relationships.10 More importantly, items with little variation across categories
limit our ability to test how well they fit or cluster with other items (effectively a sample size problem). In Structural Equation Modeling context, items with very small populations in one or more categories can cause problems with estimation, particularly when treating items as ordinal categorical variables. Such items can cause problems with estimation because they increase the chance of encountering zero cells or empty cells in the bivariate table between two items, resulting in an extreme fitting as the correlation between those two variables is most easily estimated as 1 or -1. Even without a zero cell, Weighted Least Squares estimation is sensitive to small cell populations, which can cause artifactual improvement or degradation of model fit.11
Restrictions on Minority Religions
Fox’s definition and measurement of Religious Discrimination is consistent with my definition of Minority Restrictions, except that I argue for measuring restrictions on proselytizing or conversion as a separate dimension. Above, I define Minority Restrictions as “restrictions applied specifically to minority
10 This is not to say that such items are not useful. If one is interested in forced conversions, Fox's measure tells where this is practiced.
20
religions, including restrictions against worship, organization, assembly, and teaching, or holding property for these purposes.” Fox’s items measuring Religious Discrimination contains items about restrictions on proselytizing or conversion. I test the fit of this index with and without those items. However, I exclude two of Fox’s items:
mk (forced conversions) is highly-skewed, with 169 of 175 countries coded as 0
mll (minority religions must register to be legal or to receive special tax status) does not necessarily imply restriction, and loads poorly on the latent variable.12
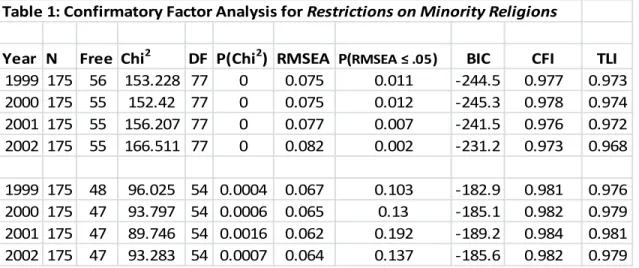
This leaves 12 items measuring restrictions on minority religions other than proselytizing or conversion: ma, mb, mbb, mc, md, me, mee, mf, mg, mh, mi, and mm. The two items measuring restrictions on proselytizing and conversion are mj and ml. Fit statistics for Confirmatory Factor Analysis models are show in Table 1. The first set of models includes the two proselytizing items; the second set of models excludes these items. With or without items measuring restrictions on proselytizing, items measuring Minority Restrictions fit very well together. Fit statistics are very similar between these two sets of models, and while the fit statistics are slightly better for the second set of models (excluding measures of proselytizing restrictions), the differences in fit statistics are marginal. Difference tests presented below show that restrictions on proselytizing or conversion are statistically differentiable from other restrictions on minority religions.
21
Table 1: Confirmatory Factor Analysis for Restrictions on Minority Religions
Year N Free paramChi2 DF P(Chi2) RMSEA P(RMSEA ≤ .05) BIC CFI TLI
1999 175 56 153.228 77 0 0.075 0.011 -244.5 0.977 0.973
2000 175 55 152.42 77 0 0.075 0.012 -245.3 0.978 0.974
2001 175 55 156.207 77 0 0.077 0.007 -241.5 0.976 0.972
2002 175 55 166.511 77 0 0.082 0.002 -231.2 0.973 0.968
1999 175 48 96.025 54 0.0004 0.067 0.103 -182.9 0.981 0.976
2000 175 47 93.797 54 0.0006 0.065 0.13 -185.1 0.982 0.979
2001 175 47 89.746 54 0.0016 0.062 0.192 -189.2 0.984 0.981
2002 175 47 93.283 54 0.0007 0.064 0.137 -185.6 0.982 0.979
There are a variety of ways to evaluate the fit of a Confirmatory Factor Analysis model, all of which show that these models fits well. Since the items are supposed to measure the same underlying concept, each item should load strongly on the latent variable, which is borne out here: each item loads on the latent variable with a standardized coefficient of at least 0.6. CFI (Comparative Fit Index) and TLI (Tucker-Lewis Index)effectively compare the model chi-square statistic to the chi-square statistic of a
null/independence model (Hooper, Coughlan, and Mullen 2008). Values above 0.95 are commonly considered to indicate a good-fitting model (Schreiber et al. 2006), and the values are nearly all above 0.97. The BIC (Bayesian Information Criterion) compares the estimated model to the saturated model, and negative values indicate a good model fit, and BIC is strongly negative for each model.13
Restrictions on Proselytizing and Conversion
I argue for treating Proselytizing Restrictions – defined above as “restrictions on conversion or proselytizing, including restrictions on missionaries” – as a separate dimension. After excluding mk because it has 169 or 175 countries coded as 0, there are two remaining items measuring restrictions on proselytizing or conversion:
mj (restrictions on conversion to minority religions)
22 ml (restrictions on proselytizing)
With only two items, it is not possible to estimate measurement model fit. However, these items both clearly measure the specified dimension, and are correlated (polychoric) at 0.90 to 0.91 for each year 1998-2002. Additionally, difference testing (presented below) shows that these two items cluster distinctly from other dimensions of GIR measured here.
Restrictions on Majority Religion or All Religions
Fox’s definition and measurement of Religious Regulation is consistent with my definition of Majority Restrictions, which I defined above as “restrictions on the majority religion or all religions, including restrictions against worship, organization, assembly, teaching, and holding property for these purposes.” I exclude the following four items from Fox’s list:
ndd (restrictions on public observance of religious practices) has 167 or 168 of 175 countries coded as 0, depending on year
nii (restrictions on religious public gatherings) has 170 of 175 countries coded as 0
njj (restrictions on public display of religious symbols by private persons or organizations) has 169 of 175 countries coded as 0
nzz (other restrictions specified by coder) loads poorly on the latent variable,14 which is
unsurprising as it is an “other” catch-all category.
I test the fit of the remaining 7 items from Fox’s list: naa, nbb, ncc, nee, nff, ngg and nhh.
Table 2: Confirmatory Factor Analysis for Restrictions on Majority/All Religions
Year N Free paramChi2 DF P(Chi2) RMSEA P(RMSEA ≤ .05) BIC CFI TLI 1999 175 24 17.465 14 0.2322 0.038 0.605 -54.8 0.995 0.993
2000 175 24 16.949 14 0.259 0.035 0.635 -55.4 0.996 0.994
2001 175 24 18.623 14 0.18 0.043 0.539 -53.7 0.993 0.99
2002 175 24 18.784 14 0.173 0.044 0.529 -53.5 0.993 0.99
23
Fit statistics for confirmatory factor analysis models are shown in Table 2. Measurement models estimated using Maximum Likelihood, treating each item as a continuous variable, don’t fit consistently well. Model fit is notably better when treating the items as ordinal categorical variables. Each item loads above 0.65, CFI and TLI hover just above 0.99 for each year, and BIC is strongly negative.
Legislative Favoritism
I use selected items from Fox’s Religious Legislation index to measure Legislative Favoritism. Fox’s index is intended as a general measure of non-suppressive governmental favoritism toward religion, but the items composing the index are multi-dimensional, not all of the items measure
favoritism, and the items measuring favoritism are all of the legislative variety.15 Empirically, three of the
33 items in Fox’s index are negatively correlated with the index as a whole.16 Theoretically, these items
do not only measure legislation of laws from a favored religion. Rather, the included items measure various forms of integration between religion and state at a legal and practical level, sometimes having little to do with whether the state treats religions equally. There is some measurement of favoritism or state-church status, but also indicators of general ties between religion and state (whether for control or support) that are not necessarily inequitable between various religious groups. For example, collection of taxes on behalf of religious organizations (lfn) may take place for all (approved) religions, and is not necessarily designed to favor particular religions. Countries may limit which religions are approved to
15 Fox’s index is built by summing 33 dichotomous items. Fox (2008) presents a Cronbach’s alpha of 0.87 for the index, but this is not an ideal statistic because its value is sensitive to the number of items, with more items producing a larger alpha. Additionally, Cronbach’s alpha makes a variety of implausible assumptions: equal loadings on items, uncorrelated errors between items, and equal error variances, and the existence of only one dimension.
24
practice, but collection of church taxes in and of itself does not qualify as favoritism. Although most religious organizations in Germany rely on the government to collect a portion of church members' income, the German system allows for religious organizations to collect taxes directly, even providing income data on church members. Also included are indicators for whether the state makes use of religious groups to do work of the state, whether social welfare functions by religious charities or setting the conditions of marriage. For example, Lebanon has no auspices for secular marriage. The state sanctions marriage rites from each of the 18 approved religious organizations in the country, but for people from different religious groups to marry each other, they must travel abroad. Rather than favoring specific religious groups, this policy inhibits the mixing of people from different religious groups. There are multiple indicators for religious education, in ways that do not necessarily connote favoritism.
To review, Governmental Favoritism is governmental support or preferential treatment of one or some religions over others, such that non-preferred groups suffer relatively higher costs of entry or practice. This includes financial subsidies to favored religion(s), and legislative or governmental control for the favored religion.17 Fox’s data includes items measuring some types of government funding of
religion, but none that necessarily qualify as favoritism.18 Therefore, using my criteria for choosing and
excluding items to measure a given dimension, I use Fox’s data to construct a measure of Legislative Favoritism. I use 13 of the 33 items composing Fox’s Religious Legislation index.
In addition to items which do not measure favoritism, I exclude a few other items from Fox’s data. As noted above, I exclude items which have little variation between categories and thus have relatively empty cells, adding little variation while causing difficulties for Weighted Least Squares
17 While the wording of this definition is mine, it is consistent with the definitions presented by Grim and Finke (2006), Gill (2008), and Fox (2008, 2011a)
25
estimation.19 One item was excluded for poor fit relative to the other items.20 One item was excluded
from the estimation for technical reasons.21
One excluded item warrants more discussion: llt, measuring prohibitive restrictions on abortion, should not be used as a measure of religious favoritism or religious legislation. In the U.S., abortion has been politicized along the right/left political spectrum, and largely motivated by religious ideals. But worldwide, legal restrictions on abortion are more strongly tied to development and demographic-transition status than to religion or laws about religion. I tested this by regressing llt on logged, per-capita GDP and the index built from the remaining Religious Legislation items. GDP – an indicator of development status – is a stronger and more significant predictor of abortion restrictions. This is in contrast to lxx (restrictions on women – education, jobs, freedom to go out in public alone) which might be expected to behave similarly but is much more strongly related to Liberal Democracy and the index of Fox’s remaining Religious Legislation items (built without lxx) than to logged per-capita GDP.
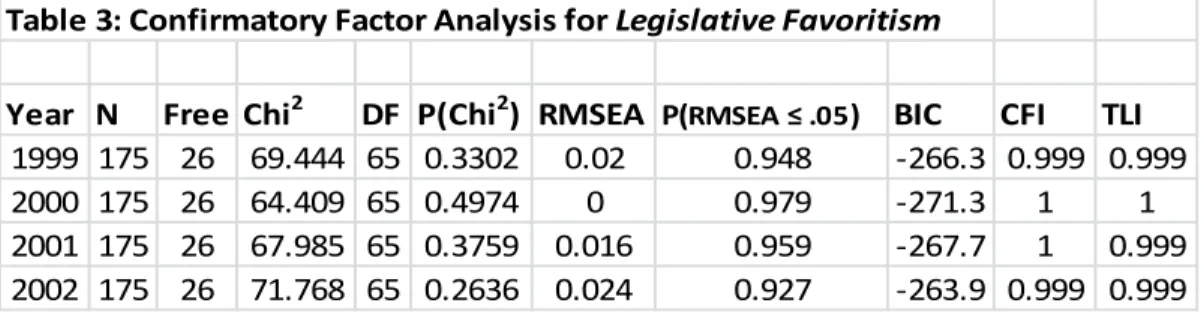
Table 3: Confirmatory Factor Analysis for Legislative Favoritism
Year N Free paramChi2 DF P(Chi2) RMSEA P(RMSEA ≤ .05) BIC CFI TLI 1999 175 26 69.444 65 0.3302 0.02 0.948 -266.3 0.999 0.999
2000 175 26 64.409 65 0.4974 0 0.979 -271.3 1 1
2001 175 26 67.985 65 0.3759 0.016 0.959 -267.7 1 0.999
2002 175 26 71.768 65 0.2636 0.024 0.927 -263.9 0.999 0.999
The remaining 13 items22 each measure some form of legislative or governmental control for the
favored religion, forming a quality measure of Legislative Favoritism. Confirmatory Factor Analysis
19 Depending on the year, ldi has 170 of 175 countries coded as 0, ljk has 166-168 items coded as 0, and ljj has 165-166 items coded as 0.
20lyy (other religious prohibitions or practices that are mandatory) is by definition an “other” category, to classify practices or policies that didn’t fit into items already defined. As such, it is no surprise that its standardized loading on the latent variable (slightly over 0.4) is much lower than other indicators.
26
indicates that these items fit extremely well together, with CFI/TLI at 0.999 or 1 and BIC strongly negative for each year 1999-2002. These results are presented in Table 3. Only two items load less-strongly on the latent variable: llu (presence of religious symbols in the state flag) and ldh (mandatory closing of businesses for religious holidays or the Sabbath or equivalent) load at ~0.55 and ~0.50, respectively, with slight variation depending on year. However, these items have face validity as indicators of religious favoritism, and do not warrant being excluded ex post facto.
Financial Favoritism
As noted above, Grim and Finke’s data contain items measuring Financial Favoritism, while Fox’s do not. I define Financial Favoritism as the degree to which “the state gives preferential treatment (via special tax breaks, funding or other subsidies) to one or some religions that are not given to others.” The majority of items composing Grim and Finke’s Government Favoritism Index measure inequitable
funding or subsidies of religion. Fox’s data contain four items measuring forms of governmental support for religion, but as noted above, none of these items necessarily measure favoritism. Therefore I use Grim and Finke’s items to build this measure. Grim and Finke (2006) present a good-fitting confirmatory factor analysis results for this measure, using 2003 data. I was able to replicate their fit statistics for 2003, and the measurement model also fit well for other available years of data (2001, 2005, and 2008).
Defending Dimensions as Distinct
In this chapter, I argue for the measurement of multiple theoretically-distinct dimensions of GIR. Here, I show that these dimensions are empirically distinct from each other. Empirically, there are two components to this question: descriptive and predictive clustering. This paper focuses on descriptive clustering: do countries that do X (e.g., place restrictions on minority religions) cluster somewhat
27
separately from countries that do Y (e.g., place restrictions on all religions, including the majority religion).23
I conducted difference tests that compare the fit of a model with two latent variables, to a model where the indicators of two dimensions are combined to load on one latent variable. For
example, if Minority Restrictions and Majority Restrictions are meaningfully different, then a model with two latent variables should fit better than a model that combines the indicators from these dimensions to load on one latent variable. If a model where the indicators load onto a single latent variable fits as well as a model with two latent variables, we can conclude that the two dimensions are not
meaningfully different in these data.
These tests were handled using difference testing of nested measurement models. To form a pair of nested models, the two latent variables were constrained to be perfectly correlated in one model (so they are effectively the same dimension), and allowed to vary independently in the other
(unconstrained) model. 24 A Chi-square statistic is generated, corresponding to the degree of confidence
that the model fits are not equal, indicating whether the two latent variables are statistically
differentiable.25 Although a correlation of 1 might seem an easy-to-reject null hypothesis, difference
tests of the null hypothesis r=1 control for random variation in sample composition, so an arbitrary sorting of items into two groups does not produce a significant difference test.
23 In my third chapter, I test whether these GIR dimensions have different effects on religiosity.
24 To ensure that the two models were nested, the variance for each latent variable was constrained to 1, so that when the constrained model specified the two latent variables are correlated at 1, this is a meaningful equality. Additionally, since the variance of each latent was constrained, the coefficient of each item loading on the latent was allowed to be free (whereas by default in Mplus, the first item loading on each latent variable is set to 1).
28 Minority Restrictions vs. Majority Restrictions
While Fox defines and codes separate sets of items measuring restrictions against minority religions and against all religions or the majority religion, it is possible that these co-vary such that they are not empirically distinguishable as separate dimensions of governmental behavior. Fox does not present statistical defense of these dimensions as distinct from each other. Some items are effectively shared between the two indices, though obviously coded differently (depending on whether they apply particularly to minority religions vs. applying to all religions including the majority). For example, ngg measures restrictions on the publication or dissemination of written religious material applied to
majority or all religions, and mg measures the same restrictions applied specifically to minority religions. Latent variables constructed from these “shared” items do not correlate more strongly between
minority and majority restrictions, than do latent variables constructed from the “unshared” items. This is further evidence that the groups of indicators measuring Minority Restrictions and Majority
Restrictions differ from each other.
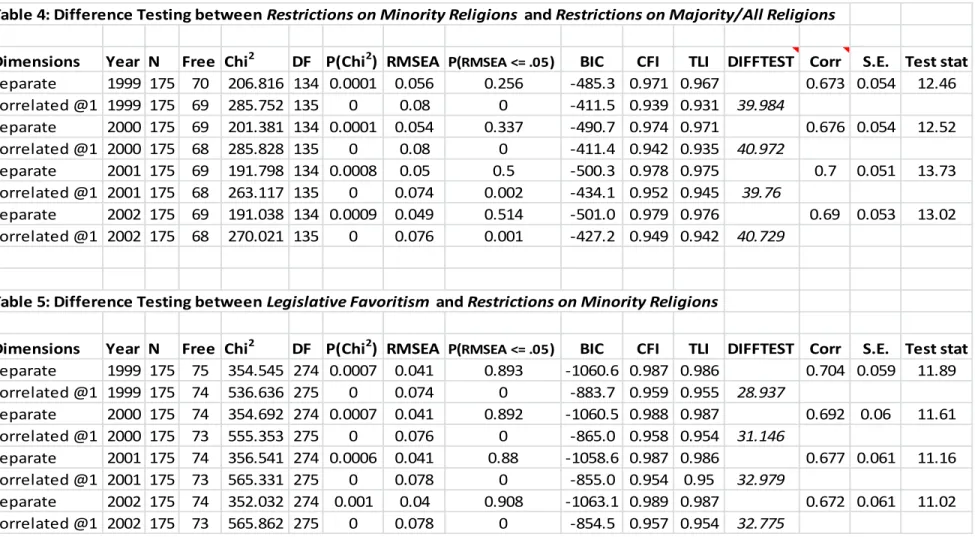
Difference testing results are presented in Table 4. While the items are best treated as categorical, difference testing is presented treating the items as continuous as well as categorical, to show that these groups of items are distinct under either form of estimation. One item (nff, restrictions on access to places of worship for majority or all religions) was excluded from these models because it caused a zero-cell conflict with two of the minority-restriction items (the item was not excluded for the continuously-estimated nested models). Table 4 shows that the two latent variables are correlated at approximately 0.7 in the unconstrained model, and the Chi2 statistic differentiating between the nested
29
Note: Tables 4 and 5 exclude items measuring restrictions on proselytizing and conversion (mj and ml) from the estimation of Restrictions on
Minority Religions. However, models estimated including these items show very similar statistics.
Table 4: Difference Testing between Restrictions on Minority Religions and Restrictions on Majority/All Religions
Dimensions Year N Free paramChi2 DF P(Chi2) RMSEA P(RMSEA <= .05) BIC CFI TLI DIFFTEST Corr S.E. Test stat
separate 1999 175 70 206.816 134 0.0001 0.056 0.256 -485.3 0.971 0.967 0.673 0.054 12.46
correlated @1 1999 175 69 285.752 135 0 0.08 0 -411.5 0.939 0.931 39.984
separate 2000 175 69 201.381 134 0.0001 0.054 0.337 -490.7 0.974 0.971 0.676 0.054 12.52
correlated @1 2000 175 68 285.828 135 0 0.08 0 -411.4 0.942 0.935 40.972
separate 2001 175 69 191.798 134 0.0008 0.05 0.5 -500.3 0.978 0.975 0.7 0.051 13.73
correlated @1 2001 175 68 263.117 135 0 0.074 0.002 -434.1 0.952 0.945 39.76
separate 2002 175 69 191.038 134 0.0009 0.049 0.514 -501.0 0.979 0.976 0.69 0.053 13.02
correlated @1 2002 175 68 270.021 135 0 0.076 0.001 -427.2 0.949 0.942 40.729
Table 5: Difference Testing between Legislative Favoritism and Restrictions on Minority Religions
Dimensions Year N Free paramChi2 DF P(Chi2) RMSEA P(RMSEA <= .05) BIC CFI TLI DIFFTEST Corr S.E. Test stat
separate 1999 175 75 354.545 274 0.0007 0.041 0.893 -1060.6 0.987 0.986 0.704 0.059 11.89
correlated @1 1999 175 74 536.636 275 0 0.074 0 -883.7 0.959 0.955 28.937
separate 2000 175 74 354.692 274 0.0007 0.041 0.892 -1060.5 0.988 0.987 0.692 0.06 11.61
correlated @1 2000 175 73 555.353 275 0 0.076 0 -865.0 0.958 0.954 31.146
separate 2001 175 74 356.541 274 0.0006 0.041 0.88 -1058.6 0.987 0.986 0.677 0.061 11.16
correlated @1 2001 175 73 565.331 275 0 0.078 0 -855.0 0.954 0.95 32.979
separate 2002 175 74 352.032 274 0.001 0.04 0.908 -1063.1 0.989 0.987 0.672 0.061 11.02
30 Minority Restrictions vs. Legislative Favoritism
Legislative advantage given to a favored religion can, unlike subsidies, sometimes exact costs on other religions. Legislative Favoritism and Minority Restrictions might be highly-correlated, or even co-occur to the extent that they are not differentiable dimensions. First, countries that give favored status to one religion are more likely to restrict other religions. Secondly, some actions of states could be classified in either dimension (e.g., laws against blasphemy help to enshrine the status of a favored religion, but also may restrict the speech of minority religions). Table 5 presents difference-test results showing that Legislative Favoritism is empirically distinct from Minority Restrictions.
The dimensions are highly-correlated, yet are statistically differentiable. The Chi2 test statistic is
consistently in the low 30s (which is very significant). The correlation between the dimensions is stronger (0.77 to 0.79) when including restrictions on proselytizing or conversion as part of Minority Restrictions, compared to when excluding items measuring restrictions on proselytizing (0.67 to 0.70). This implies that restrictions on proselytizing or conversion may be strongly-related to Legislative Favoritism.
Excursus: Is Difference Testing Trustworthy?
With the high correlation observed between latent variables for different dimensions of GIR, one may wonder whether the significant Chi2 statistics obtained from difference testing are simply a
31
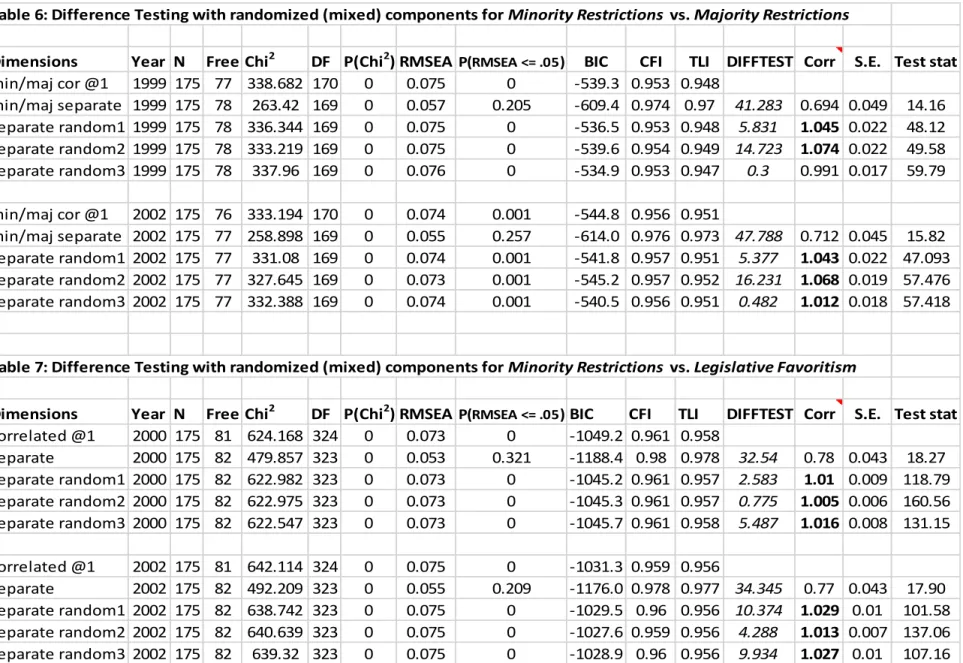
I estimated multiple variations of the difference tests presented in Tables 4 and 5, dividing the indicators proportionally between two latent variables of equal size to the original model. Minority Restrictions is measured by 14 indicators, while Majority Restrictions is measured by 6 indicators. I generated three "randomized" groupings of these 20 indicators into groups of 14 and 6, using two indicators of Majority Restrictions in the group of 6 and randomly choosing 4 indicators of Minority Restrictions to complete the group of 6. Results of difference tests between the one-latent model and the three two-latent models are presented in Table 6. I similarly divided the indicators from Minority Restrictions and Legislative Favoritism into three randomized groups of two. Results of these difference tests are presented in Table 7. In both cases, I estimated difference tests for 1999 and 2002 data.
These “randomized difference test” models show that happenstance distribution of items between two latent variables cannot be responsible for significant difference observed in difference tests. The randomized two-latent models mostly show correlations greater than 1. Correlations or standardized coefficients over 1 are not uncommon with Structural Equation Models (Jöreskog 1999), and simply mean that the two latent variables cannot be statistically differentiated. In these cases, significant Chi2 statistic from the difference tests is a result of the correlation being greater than 1, and is
32
Table 6: Difference Testing with randomized (mixed) components for Minority Restrictions vs. Majority Restrictions
Dimensions Year N Free paramChi2 DF P(Chi2) RMSEA P(RMSEA <= .05) BIC CFI TLI DIFFTEST Corr S.E. Test stat
min/maj cor @1 1999 175 77 338.682 170 0 0.075 0 -539.3 0.953 0.948
min/maj separate 1999 175 78 263.42 169 0 0.057 0.205 -609.4 0.974 0.97 41.283 0.694 0.049 14.16
separate random1 1999 175 78 336.344 169 0 0.075 0 -536.5 0.953 0.948 5.831 1.045 0.022 48.12
separate random2 1999 175 78 333.219 169 0 0.075 0 -539.6 0.954 0.949 14.723 1.074 0.022 49.58
separate random3 1999 175 78 337.96 169 0 0.076 0 -534.9 0.953 0.947 0.3 0.991 0.017 59.79
min/maj cor @1 2002 175 76 333.194 170 0 0.074 0.001 -544.8 0.956 0.951
min/maj separate 2002 175 77 258.898 169 0 0.055 0.257 -614.0 0.976 0.973 47.788 0.712 0.045 15.82
separate random1 2002 175 77 331.08 169 0 0.074 0.001 -541.8 0.957 0.951 5.377 1.043 0.022 47.093
separate random2 2002 175 77 327.645 169 0 0.073 0.001 -545.2 0.957 0.952 16.231 1.068 0.019 57.476
separate random3 2002 175 77 332.388 169 0 0.074 0.001 -540.5 0.956 0.951 0.482 1.012 0.018 57.418
Table 7: Difference Testing with randomized (mixed) components for Minority Restrictions vs. Legislative Favoritism
Dimensions Year N Free paramChi2 DF P(Chi2) RMSEA P(RMSEA <= .05)BIC CFI TLI DIFFTEST Corr S.E. Test stat
correlated @1 2000 175 81 624.168 324 0 0.073 0 -1049.2 0.961 0.958
separate 2000 175 82 479.857 323 0 0.053 0.321 -1188.4 0.98 0.978 32.54 0.78 0.043 18.27
separate random1 2000 175 82 622.982 323 0 0.073 0 -1045.2 0.961 0.957 2.583 1.01 0.009 118.79
separate random2 2000 175 82 622.975 323 0 0.073 0 -1045.3 0.961 0.957 0.775 1.005 0.006 160.56
separate random3 2000 175 82 622.547 323 0 0.073 0 -1045.7 0.961 0.958 5.487 1.016 0.008 131.15
correlated @1 2002 175 81 642.114 324 0 0.075 0 -1031.3 0.959 0.956
separate 2002 175 82 492.209 323 0 0.055 0.209 -1176.0 0.978 0.977 34.345 0.77 0.043 17.90
separate random1 2002 175 82 638.742 323 0 0.075 0 -1029.5 0.96 0.956 10.374 1.029 0.01 101.58
separate random2 2002 175 82 640.639 323 0 0.075 0 -1027.6 0.959 0.956 4.288 1.013 0.007 137.06
33 Restrictions on Proselytizing or Conversion
As noted above, Fox’s data includes three items which measure restrictions related to proselytizing or conversion:
mk (forced conversions)
ml (restrictions on proselytizing)
mj (restrictions on conversion to minority religions)
However, forced conversions are not common, and mk has all but 6 countries coded as zero so is therefore excluded from these tests. While a Confirmatory Factor Analysis measurement model with a single factor must have at least three separate items to be identified, difference testing needs a
minimum of two items in each group. Hence it is possible to test whether Restrictions on Proselytizing or Conversion (as measured by ml and mj) are empirically distinct from other dimensions of GIR,
particularly Restrictions on Minority Religions. Difference Tests presented in Table 8 show that Restrictions on Proselytizing or Conversion is clearly differentiable from each of the three dimensions described and defended previously in this paper. While the two items measuring Proselytizing
Restrictions were taken from the items measuring Restrictions on Minority Religions, the dimensions are correlated at 0.82 to 0.84 (depending on year), and the Chi2 statistic is very significant, ranging from 15
to 20. Proselytizing Restrictions is less-strongly correlated with Restrictions on Majority/All Religions (from 0.70 to 0.72, depending on year), with the Chi2 statistic ranging from 19 to 22.5. Interestingly,
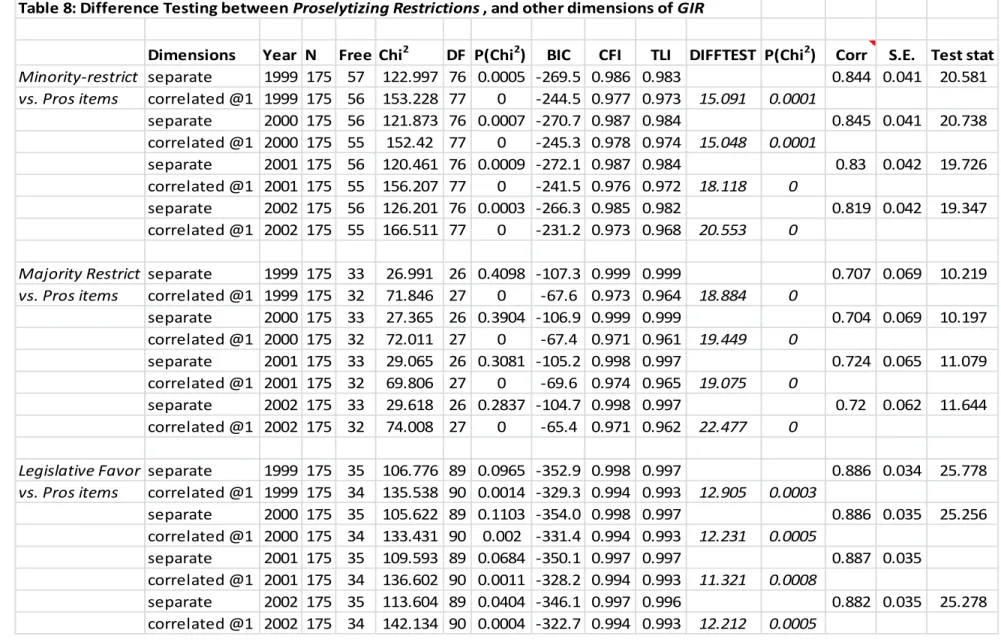
![Table 5: Poisson panel regression models predicting Restrictions on All Religions, including Majority 1 2 3 4 5 6 7 Religious Diversity 0.0053 -0.809 -0.397 -0.933+ -0.486 -0.861 -0.733 [0.0107] [-1.449] [-0.734] [-1.753] [-0.895] [-1.110] [-1.006] Libera](https://thumb-us.123doks.com/thumbv2/123dok_us/8285871.2194206/70.918.110.841.108.757/regression-predicting-restrictions-religions-including-majority-religious-diversity.webp)
