SIK2 Restricts Autophagic Flux To Support Triple-Negative Breast
Cancer Survival
Kimberly E. Maxfield,a,b*Jennifer Macion,bHariprasad Vankayalapati,cAngelique W. Whitehurstb
Department of Pharmacology, University of North Carolina at Chapel Hill, Chapel Hill, North Carolina, USAa; Simmons Comprehensive Cancer Center, UT-Southwestern
Medical Center, Dallas, Texas, USAb; Early Discovery & Medicinal Chemistry, Arrien Pharmaceuticals, Salt Lake City, Utah, USAc
Triple-negative breast cancer (TNBC) is a highly heterogeneous disease with multiple, distinct molecular subtypes that exhibit
unique transcriptional programs and clinical progression trajectories. Despite knowledge of the molecular heterogeneity of the
disease, most patients are limited to generic, indiscriminate treatment options: cytotoxic chemotherapy, surgery, and radiation.
To identify new intervention targets in TNBC, we used large-scale, loss-of-function screening to identify molecular
vulnerabili-ties among different oncogenomic backgrounds. This strategy returned salt inducible kinase 2 (SIK2) as essential for TNBC
sur-vival. Genetic or pharmacological inhibition of SIK2 leads to increased autophagic flux in both normal-immortalized and
tu-mor-derived cell lines. However, this activity causes cell death selectively in breast cancer cells and is biased toward the
claudin-low subtype. Depletion of ATG5, which is essential for autophagic vesicle formation, rescued the loss of viability folclaudin-lowing SIK2
inhibition. Importantly, we find that SIK2 is essential for TNBC tumor growth
in vivo. Taken together, these findings indicate
that claudin-low tumor cells rely on SIK2 to restrain maladaptive autophagic activation. Inhibition of SIK2 therefore presents
itself as an intervention opportunity to reactivate this tumor suppressor mechanism.
B
reast cancer is an extremely heterogeneous disease that is
clas-sified by the presence of estrogen receptor (ER), progesterone
receptor (PR), and human epidermal growth factor receptor 2
(HER2). Cases where
⬍
1% of cells express ER, PR, or HER2 are
considered triple-negative breast cancer (TNBC) (
1
). These
mo-lecular markers can serve as a critical stratification tool for
tailor-ing effective therapies to sensitive patients. For example,
anties-trogens such as tamoxifen are highly effective in ER-positive
patients, and HER2-positive tumors are responsive to
trastu-zumab (
2
,
3
). Conversely, TNBC tumors lack these targetable
pro-teins, limiting first-line treatment to a combination of radiation
and chemotherapy. This approach has changed little over the last
20 years and is characterized by high toxicity and frequent relapse
of chemorefractory disease (
4
). Furthermore, levels of overall and
disease-free survival in TNBC are significantly worse than those of
other subgroups of breast cancer (
5
). Thus, for TNBC there is a
dire need for less toxic therapies that target the major fulcrums
supporting tumor cell survival.
In addition to clinical and pathological markers, extensive gene
expression profiling efforts by a number of groups have identified
multiple intrinsic molecular subtypes within breast cancer. These
subtypes include luminal A and B, which comprise the majority of
ER- and PR-positive cases, as well a HER2-enriched clade.
Impor-tantly, this analysis has revealed substantial heterogeneity within
TNBC. Broadly, TNBC can be subclassified into 2 intrinsic
sub-types, basal like and claudin low, but up to 6 additional subclasses
have been identified (
6–9
). Significantly, these groups can be
aligned with sensitivity to specific therapies and overall patient
survival (
4
,
6–8
,
10
). A number of recent studies have indicated
that the spectrum of subtypes found
in vivo
is represented among
existing tumor-derived cell lines (
8
,
9
,
11
). Thus, these cell lines
offer a model system that faithfully recapitulates the heterogeneity
of the human disease and could reveal subtype-selective
vulnera-bilities.
Here, we have applied genome-scale loss-of-function
screen-ing in both the claudin-low and basal-like subtypes to discover
molecular targets for TNBC. We find that salt-inducible kinase 2
(SIK2) is essential for survival, particularly in the claudin-low
sub-type. There are 3 salt-inducible kinases (SIK1, SIK2, and SIK3),
which are best characterized as regulators of gluconeogenesis.
Upon glucagon stimulation, protein kinase A (PKA) inactivates
SIK, thereby relieving inhibitory phosphorylation of CRCT2/3,
which then cooperates with CREB to activate gluconeogenic
tran-scriptional programs (
12
,
13
). Importantly, tissue-specific
dele-tions of SIK proteins in mice can lead to altered glucose and lipid
metabolism (
14–16
). Additional findings have also implicated
SIK2 proteins in modulating autophagy and inflammatory
re-sponses (
17–21
). With respect to cancer, two reports have
indi-cated that SIK2 is essential for centrosome splitting and mitotic
progression, and SIK1 loss can inhibit anoikis and promotes
me-tastases (
22–24
).
The contribution of SIKs to biological processes that are often
misregulated in human disease has driven efforts to develop
small-molecule inhibitors. SIKs are members of the AMPK family
but are unique in this group, as they contain a
low-stearic-hin-drance residue (threonine) at their gatekeeper site (
25
,
26
). This
small residue creates an extended hydrophobic pocket that
en-Received30 June 2016 Returned for modification23 August 2016 Accepted23 September 2016
Accepted manuscript posted online3 October 2016
CitationMaxfield KE, Macion J, Vankayalapati H, Whitehurst AW. 2016. SIK2 restricts autophagic flux to support triple-negative breast cancer survival. Mol Cell
Biol 36:3048 –3057.doi:10.1128/MCB.00380-16.
Address correspondence to Angelique W. Whitehurst, [email protected].
*Present address: Kimberly E. Maxfield, Food and Drug Administration, Silver
Spring, Maryland, USA.
Supplemental material for this article may be found athttp://dx.doi.org/10.1128
/MCB.00380-16.
hances flexibility and, thus, autoactivation of the kinase (
27
,
28
).
This pocket can also selectively accommodate small-molecule
in-hibitors that would otherwise be occluded by a bulky side chain.
For example, AMPK contains a methionine at this residue,
sug-gesting that SIK inhibitors would have minimal off-target activity.
We find that in TNBC, SIK2 functions to restrict autophagy,
which in the claudin-low subtype is essential for viability. The
contribution of autophagy to tumorigenesis has been somewhat
contentious. Autophagy is reported to function both as a tumor
suppressor mechanism as well as a survival mechanism,
depend-ing on the tumor cell context (
29
). With respect to TNBC, a recent
study found that a subset of ER-negative tumors exhibit
down-regulation of the critical autophagic protein and tumor
suppres-sor, beclin-1. These patients exhibited poorer overall survival,
suggesting that restriction of autophagy in receptor-negative,
ad-vanced disease promotes tumor survival (
30
). Our findings
sug-gest inhibition of SIK2 could release this brake on autophagy and
thus presents a therapeutic strategy in the claudin-low subtype.
MATERIALS AND METHODS
Cell lines.Cell lines were obtained from the ATCC with the following
exceptions: SUM159, SUM149, and HuMEC (Charles Perou, University of North Carolina at Chapel Hill [UNC]); HME50-hTERT (Jerry Shay, UT Southwestern [UTSW]); WHIM12 (Matthew Ellis, Baylor College of Medicine); HCC1806, HCC1143, and HCC1395 (Gray Pearson, UTSW); HCC1937, HCC1954, HCC38, U2OS, and U2OS-GFP-LC3 (Michael White, UTSW); 293T, MDA-MB-231, and Hs578t (Gary Johnson, UNC); and MDA-MB-157 and HCC1569 (Ganesh Raj, UTSW). All cell lines were cultured in the provider’s recommended medium. Cell lines were authenticated using short tandem repeat analysis (STR).
Antibodies and reagents.The following antibodies were used for
im-munoblotting: SIK2 (6919; 1:1,000), LC3B (3868; 1:1,000), total ULK1 (8054; 1:1,000), phospho-ULK1 (serine 555) (5869; 1:1,000), p62 (8025; 1:1,000), CRTC2 (3926; 1:1,000), and ATG5 (1:1,000) (all from Cell Sig-naling Technologies); extracellular signal-related kinase 1/2 (ERK1/2) (sc-93; 1:1,000; Santa Cruz); SIK2 (636702; 1:1,000; BioLegend); phos-pho-CRTC2 (serine 275) (1:1,000; gift from Olga Goransson, Lund Uni-versity); phospho-histone 3B (serine 10) (1:200; Millipore); and pericen-trin (1:1,000; AbCam). Antibodies used for immunofluorescence were V5 (Life Technologies) and p62 (sc-28359; 1:100; Santa Cruz). The SIK2 in-hibitor ARN-3236 was obtained from Arrien Pharmaceuticals, Inc. HG-9-91-01 was obtained from Fisher Scientific. CellTiter-Glo (CTG) was purchased from Promega. Lipofectamine RNAiMAX was purchased from Thermo Fisher Technologies. Opti-MEM and Hoechst 3342, trihydro-chloride, trihydrate were obtained from Thermo Fisher Scientific. Pacli-taxel was obtained from Tocris Bioscience.
Expression plasmids and mutagenesis. Human SIK2 (clone
IOH45349) was obtained in pENTR221 from the Ultimate ORF (open reading frame) collection from Thermo Fisher Technologies (housed at UTSW). pENTR221 SIK2 was cloned into pLX302 using the Gateway cloning system (Thermo Fisher Scientific). Kinase-dead SIK2 (K49M) was generated using site-directed mutagenesis using the following primers: forward, ACCAAGACGGAGGTGGCAATAATGATAATCGATAAGTC TCAGC; reverse, GCTGAGACTTATCGATTATCATTATTGCCACCTC CGTCTTGGT.
Viral packaging plasmids pCMV-dr8.91 and pCMV-VSV-G were a gift from Michael White (UTSW). pCDH-GFP-LC3 (Channing Der, UNC) was used for GFP-LC3 SUM159 cells. For SIK2 short hairpin RNA (shRNA), PLKO.1 SIK2 shRNA clones TRCN0000196955 and TRCN0000037494 and PLKO.1 nonsilencing control (from the Broad Institute RNAi Consortium) were purchased from Sigma.
Cell viability assays.Cells were reverse transfected in 96-well format.
One hundred twenty hours postplating, luminescence values were read following addition of 15l of Cell Titer-Glo on a PHERAstar Plus (BMG)
plate reader. Where indicated, cells were exposed to a final concentration of 1 nM paclitaxel 48 h postplating. For ARN-3236 treatment, cells were plated and simultaneously treated with 2M ARN-3236 or vehicle con-trol. Forty-eight hours later, cells were treated again with 2M ARN-3236. Viability readings were taken 96 h after plating. For HG-9-91-01 treatment, cells were treated as described above with 1M the inhibitor.
siRNA transfections.Short interfering RNA (siRNA) pools were
ob-tained from GE Healthcare (M-004778-03; siGENOME siRNA) or Sigma (SASI_Hs01_00054682, SASI_Hs01_00054683, and SASI_Hs01_00054684; Mission). Control siRNA (siCTRL) used was a nontargeting control (D-001206-14 and D-001210-05; GE Healthcare) or siRNA targeting FNDC3B (MU-017856-00; GE Healthcare), which was innocuous in pan-genomic screening. Cells were reverse transfected with 8.6 pmol siRNA for CTG and 4.3 pmol siRNAs for all other assays. A toxic siRNA, UBB (M-013382-01; GE Healthcare), was used to monitor transfection efficiency. CTG values for UBB transfection must result in viability loss of⬎90% compared to the control transfected cells for inclusion.
Pangenomic siRNA screen and data processing.An siGENOME
SMARTpool siRNA library targeting 18,171 genes was purchased from GE Healthcare in 96-well plate format. siRNA pools (4.3 pmol) were transfected into cells using Lipofectamine RNAiMax solution. Forty-eight hours later, cells (SUM159, SUM149, HCC1806, and WHIM12) were treated with either vehicle or 1 nM paclitaxel. Ninety-six hours postplat-ing, cell viability was measured using CellTiter-Glo according to the man-ufacturer’s protocol, modified to use 15l per well. Measurements were made with a PHERAstar Plus (BMG) plate reader. Individual values were normalized to the medians of their respective rows. The normalized pa-clitaxel-treated values were divided by the untreated values to derive a synthetic lethal value. Z-scores, based on the means and standard devia-tions from each plate, then were calculated for each gene for both direct (no paclitaxel) and synthetic behavior. See Table S1 in the supplemental material for Z-scores and normalized viability scores.
Lentiviral infections.Lentivirus was produced through
cotransfec-tion of HEK293T cells with 3g of viral expression vector, 3g of pCMV-dr8.91 packing vector, and 300 ng of pCMV-VSV-G envelope vector using Fugene according to the manufacturer’s protocol. Virus-conditioned me-dium was harvested, passed through 0.45-m filters, and then used to infect target cells in the presence of 10g/ml Sequa-brene. Following infection, stable populations were selected using appropriate antibiotics. For shSIK2, knockdown was validated 2 days following infection (by quantitative PCR [qPCR] and immunoblotting), and downstream assays were performed without selection.
Colony formation assay.One hundred twenty hours after siRNA
transfection, cells deemed viable by trypan blue exclusion assay were re-plated at limiting dilution in 6-well format. Cells were fed twice weekly until control colonies began to merge. Samples were fixed with 3.7% formaldehyde and stained with Giemsa.
Soft-agar assays.For siSIK2 soft-agar assays, SUM159 cells were
re-verse transfected with 10 pmol of siRNA. Seventy-two hours posttrans-fection, cells were resuspended in 0.375% Bacto agar in complete me-dium, and 2⫻103viable cells were plated over a layer of solidified 0.7% Bacto agar in a 24-well dish. Cells were fed once weekly for 2 weeks and then stained with Giemsa. For SUM159 shSIK2 soft-agar assays, SUM159 cells stably expressing the indicated shRNAs were resuspended in 0.375% Bacto agar in complete medium, and 2⫻103cells were plated over a layer of solidified 0.7% Bacto agar in 24-well dishes. Colonies were fed once a week for 2 weeks and then stained with Giemsa. For ARN-3236 soft-agar assays, SUM159 cells were resuspended in 0.375% Bacto agar in complete medium, and 2⫻103cells were plated over a layer of solidified 0.7% Bacto agar in 24-well dishes. Cells were treated with 1M ARN-3236 each day for 9 days. Cells were fed once with 2⫻serum on the sixth day. The cells were stained with 0.05% crystal violet in 10% ethanol. All soft-agar assays were manually counted using a Leica M7z stereoscope.
Gene expression.Total RNA was isolated using an RNA isolation kit
transfection kit (Life Technologies) according to the manufacturer’s in-structions. An Applied Biosystems real-time PCR system and TaqMan real-time PCR gene expression assays were used to measure gene expres-sion for SIK2 (Hs01568566_m1) and RPL27 (Hs03044961_g1). Expres-sion values relative to those of RPL27 were calculated using the compar-ative threshold cycle (CT) method.
Immunoblotting.Whole-cell lysates were prepared in 2⫻Laemmli
sample buffer and resolved using SDS-PAGE. Gels were transferred to Immobilon polyvinylidene difluoride (PVDF; Millipore), blocked in Tris-buffered saline containing 0.1% Tween 20 (TBST) and either 5% nonfat dry milk or bovine serum albumin (BSA), and incubated with the indi-cated primary antibodies overnight. After washes in TBST, appropriate horseradish peroxidase (HRP)-coupled secondary antibodies (Jackson ImmunoResearch) were used for chemiluminescence. ImageJ was used to quantitate band intensity.
Immunofluorescence.Cells plated on glass coverslips were fixed with
3.7% formaldehyde and then permeabilized with 0.5% Triton X-100 for 10 min. Cells were blocked and washed in 1% BSA, 0.1% Tween 20 in 1⫻ phosphate-buffered saline (PBTA). Cells were incubated with primary antibodies for 1 h, followed by three washes in PBTA. Coverslips were then incubated with Alexa Fluor-conjugated secondary antibodies (Thermo Fisher Scientific) for 30 min, followed by 3 washes in PBTA and a wash in H2O. Prolong Gold antifade reagent with 4= ,6-diamidino-2-phenylindole (DAPI; Thermo Fisher Scientific) was used to mount slips on glass slides. Images were acquired on either a Leica DM55000 B upright microscope, a Zeiss Axio Imager upright microscope, or a Zeiss LSM510 confocal microscope.
FACS.U2OS GFP-LC3 cells were reverse transfected with 10 pmol of
siRNA. Sixteen hours prior to fluorescence-activated cell sorting (FACS) analysis, cells were treated with either vehicle or 50M Cq. Seventy-two hours posttransfection, cells were trypsinized, washed twice with PBS, and fixed with ethanol (EtOH) for 30 min at 4°C. Cells were then washed twice with PBS and sorted by green fluorescent protein (GFP) fluorescence with a Beckman Coulter CyAn ADP using Summit 4.3 and analyzed with Mod-Fit 4.0 DNA analysis software. A minimum of 1.0⫻104events was used for analysis.
shSIK2 xenograft injections.A total of 8⫻105SUM159 cells stably
expressing pLKO.1 shSIK2 or a nontargeting control hairpin (200l) were injected in the right flank of NOD.cg-PRKDCSCIDIl2rgtm1Wjl/SzJ (NSG) female mice, aged 4 to 6 weeks. Tumors were measured twice weekly using a digital caliper, and volume (V) was calculated using the following equation:V⫽(length of the longest side)⫻(length of the side perpendicular to the longest side)2/(/6). According to IACUC guide-lines, mice bearing tumors greater than 2,000 mm3or exhibiting signifi-cantly diminished health were sacrificed. Tumors were surgically re-moved, weighed, and formalin fixed for 48 h. All studies were conducted in accordance with a UTSW IACUC-approved protocol.
RESULTS
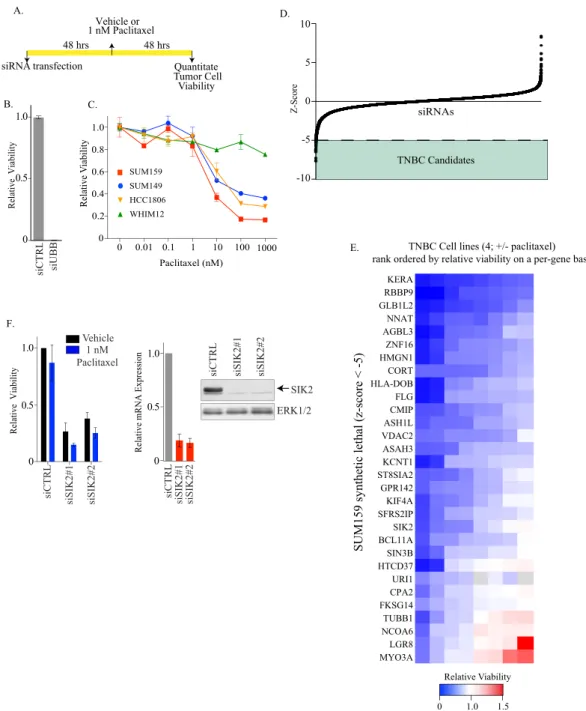
To identify targetable vulnerabilities in TNBC, we implemented a
tiered siRNA screening strategy to enrich for concordant
re-sponses among diverse oncogenomic backgrounds found in cell
models of this disease. Given that the majority of TNBC tumors
are classified as either claudin-low or basal-like subtype, we used
cell lines representing both of these subtypes to account for biased
vulnerabilities (
7–9
,
11
). In the first tier of the analysis, we
per-formed a genome-wide siRNA toxicity screen in the SUM159
claudin-low cell line (
Fig. 1A
and
B
; see also Table S1 in the
sup-plemental material). As paclitaxel is a first-line chemotherapeutic
in TNBC, we performed a 2-condition screen to assess
conse-quences of gene depletion alone and in the presence of an
innoc-uous dose (1 nM) of this agent (
Fig. 1C
). Here, we identified 30
candidate targets whose viability ratio (paclitaxel
treated/un-treated) was
ⱖ
5 standard deviations below the means (
Fig. 1D
).
These 30 siRNAs were then evaluated for their activity in the
WHIM12 (claudin-low), HCC1806 (basal-like), and SUM149
(basal-like) cell lines in the presence and absence of paclitaxel
(
Fig. 1E
). This strategy identified SUM159-idiosyncratic siRNAs
(NCOA6, LGR8, and MYO3A) as well as siRNAs with broad
pen-etrance under all conditions tested (RBBP9, GLB1L2, KERA, and
NNAT). We focused on siRNAs exhibiting selectivity within the
panel, reasoning that these would be the least likely to target
housekeeping functions in both tumor and normal cells. Among
these, we identified salt-inducible kinase 2 (SIK2), whose
deple-tion led to a dramatic loss in viability of SUM159 cells, moderate
defects in WHIM12 and HCC1806, and no effect on SUM149
cells. This phenotype was observed with 2 independent siRNAs,
both of which led to a strong reduction of SIK2 mRNA and
pro-tein levels (
Fig. 1F
). Knowledge of SIK2’s contribution to
tumor-igenesis is limited to only two reports, which suggest an oncogenic
function of this kinase in ovarian and prostate cancers (
22
,
23
).
Importantly, small-molecule SIK2 inhibitors are under active
de-velopment to treat a number of human diseases, making this an
actionable target in the near future (
17
,
31
). Given the relative
dearth of information on this therapeutically tractable protein, we
focused follow-up efforts on its function in TNBC.
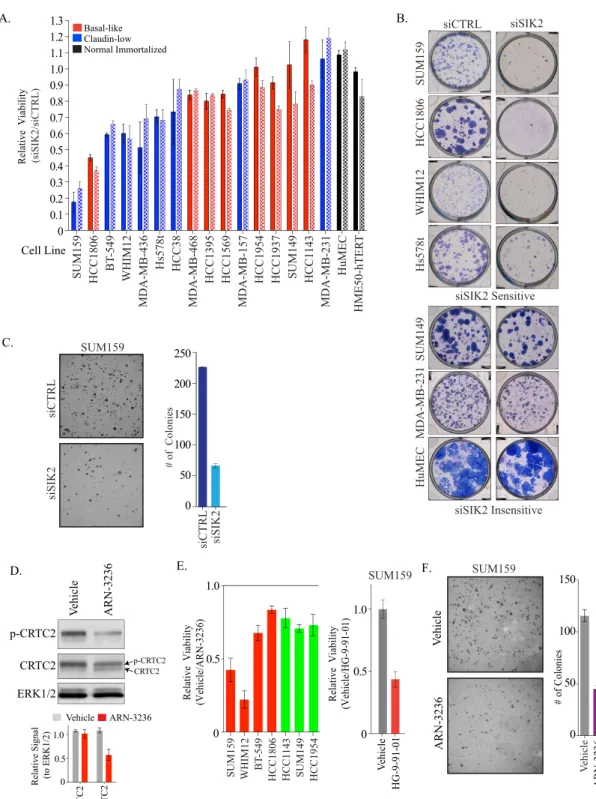
We further assessed the specificity of the SIK2 dependency in a
panel of TNBC cell lines composed of 8 claudin-low, 8 basal-like,
and 2 normal-immortalized cell lines (
Fig. 2A
). Here, 6 of the 8
claudin-low cell lines exhibited a loss of viability following siSIK2
transfection with 2 independent siRNAs. In contrast, only 1 of the
8 basal-like cell lines, HCC1806, appeared sensitive. Notably, this
basal-like outlier is the only cell line derived from a primary
acan-tholytic squamous cell carcinoma, a pathology distinct from that
of ductal carcinomas. We observed minimal defects in the normal
setting, indicating that the dependency on SIK2 was unique to the
tumorigenic state. The viability decrease in the siSIK2-sensitive
lines was not complete, as 30 to 40% of the population remained.
Thus, we replated SIK2-depleted cells at limiting dilution to assess
growth capacity of the residual population. Here, we observed a
dramatic reduction in colony formation, suggesting that the
ma-jority of remaining cells were not viable following siSIK2
transfec-tion (
Fig. 2B
). Furthermore, SIK2-depleted cells exhibited
atten-uated anchorage-independent growth, suggesting that SIK2 is
required for tumorigenicity in TNBC (
Fig. 2C
).
tumorige-nicity, particularly in the claudin-low subtype of TNBC, and
phar-macological inhibition of this kinase is sufficient to reduce tumor
growth.
A number of recent reports have implicated SIK2 in the
mod-ulation of autophagy (
18
,
21
). Also, the expression of the tumor
suppressor beclin-1 is lost in a subset of TNBC, suggesting that
autophagy is altered in a subset of TNBC tumors (
30
). Thus, we
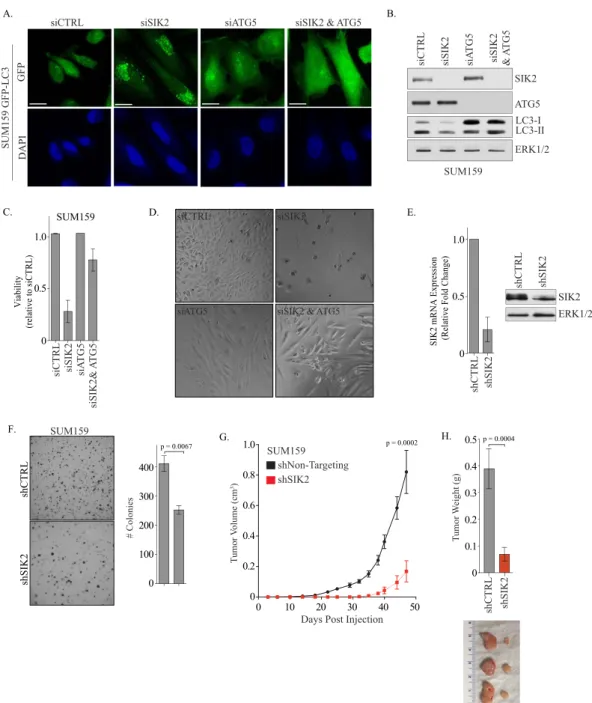
examined the consequences of SIK2 depletion on accumulation of
microtubule-associated protein light chain 3 (LC3), which
associ-ates with the autophagosomal membrane and can be used to
mon-itor autophagic activity. Depletion of SIK2 led to a pronounced
decrease in both LC3-I and -II accumulation in tumor and normal
cell lines, irrespective of the effect of SIK2 on viability (
Fig. 3A
).
Similarly, accumulation of p62, an adaptor protein found on
au-A.
siRNA transfection
Vehicle or 1 nM Paclitaxel
Quantitate Tumor Cell Viability
48 hrs 48 hrs
B.
E.
0 0.5 1.0
Relative Viability
0
Z-Score
5
-5
-10 10
siRNAs
siCTRL
siSIK2#1
0 0.5 1.0
siCTRL
siSIK2#1 siSIK2#2
Relative mRNA Expression
SIK2
ERK1/2
GLB1L2
SIK2 siCTRL siSIK2#1 siSIK2#2
D.
SUM159 synthetic lethal (z-score < -5)
TNBC Cell lines (4; +/- paclitaxel) rank ordered by relative viability on a per-gene basis
TNBC Candidates
0 1.0 1.5 Relative Viability RBBP9
NNAT KERA
CMIP AGBL3
VDAC2 FLG HLA-DOB
ASH1L
KCNT1 ST8SIA2 GPR142 KIF4A SFRS2IP
BCL11A ASAH3
FKSG14 SIN3B CORT HMGN1 ZNF16
HTCD37
TUBB1 URI1 CPA2
NCOA6 LGR8 MYO3A F.
siCTRL siUBB 0 0.5 1.0
Relative Viability
Vehicle 1 nM Paclitaxel
SUM149 SUM159
WHIM12 HCC1806
0.2
Relative V
iability
0.4 0.6 0.8 1.0
0
0.01 0.1 1
0 10 100 1000
Paclitaxel (nM) C.
siSIK2#2
FIG 1Pangenomic loss-of-function screen identified SIK2 as essential for TNBC. (A) Schematic for pangenomic siRNA screen. (B) SUM159 cells were
Hs578t
WHIM12
SUM159 HuMEC
HME50-hTER
T
MDA-MB-436 MDA-MB-468
SUM149 HCC1
143
HCC1806
Relative Viability (siSIK2/siCTRL)
MDA-MB-231
HCC1806
SUM159
WHIM12
siSIK2
Hs578t
MDA-MB-231
SUM149
A. B.
siSIK2
siCTRL
SUM159
HuMEC
siSIK2 Sensitive
siSIK2 Insensitive siCTRL
siCTRL siSIK2 0 50 100 150 200 250
# of Colonies
C.
HCC38
V
ehicle
ARN-3236
p-CRTC2
CRTC2
ERK1/2
ARN-3236
V
ehicle
# of Colonies
0 50 100
D. E.
BT
-549
HCC1395 HCC1954 HCC1937
0 0.5 1.0
Relative Viability (Vehicle/HG-9-91-01)
0 0.5 1.0
V
ehicle
0.6
0.1 0.2 0.3 0.4 0.7 0.8 0.9 1.1 1.2 1.3
HCC1569
MDA-MB-157
HG-9-91-01
V
ehicle
150 F.
ARN-3236
Cell Line
SUM159 Basal-like
Claudin-low Normal Immortalized
Vehicle ARN-3236
0 0.5 1.0
CR
TC2
p
-CR
T
C2
Relative Signal (to ERK1/2)
p-CRTC2
CRTC2
WHIM12
SUM159 BT HCC1806
-549
SUM149
HCC1
143
HCC1954
0 0.5 1.0
Relative Viability (Vehicle/ARN-3236)
SUM159
FIG 2SIK2 is essential for viability in a subset of TNBC. (A) Indicated cell lines were transfected with siCTRL or siSIK2 for 120 h. Bars represent relative viability
tophagic vesicles, was also decreased in SIK2-depleted cells (
Fig.
3B
). The reduction of LC3 and p62 is consistent with enhanced
vesicle flux through the pathway. To further evaluate this
possi-bility, we assayed the activation of ULK1, which is phosphorylated
on Ser555 by AMPK kinase as an initial step in autophagosome
formation (
32–34
). Depletion of SIK2 led to a robust increase in
phosphorylation on Ser555, indicating that autophagy was
acti-vated (
Fig. 3C
). We then stably expressed GFP-LC3 in SUM159
cells (SUM159-GFP-LC3) to monitor the accumulation of
au-tophagic vesicles in single cells. We exposed cells to chloroquine
(Cq), a lysosomotropic agent that leads to vesicle accumulation by
preventing autophagosomal maturation. Under these conditions,
SIK2 depletion led to a significant increase in the accumulation of
GFP-LC3-positive vesicles (
Fig. 3D
and
E
). FACS analysis in
A.
siCTRL siSIK2
SUM159
siCTRL siSIK2
HCC1806
siCTRL siSIK2
WHIM12
ERK1/2 LC3-II LC3-I SIK2
siCTRL siSIK2
SUM149
siCTRL siSIK2
HuMEC
pSER555 ULK1
Total ULK1
ERK1/2
siCTRL siSIK2
B.
siCTRL
siSIK2#1
siSIK2#2
GFP DAPI
+ 50μM Chloroquine siSIK2 Sensitive siSIK2 Insensitive
F.
siCTRL
siSIK2#1 siSIK2#2 0
50 100 150
# GFP-LC3 puncta/cell
p < 0.0001
p < 0.0001
E.
GFP
ARN-3236 Vehicle
DAPI
Mer
g
e
+ 50μM Chloroquine
0 1 6 12 24 Hours 0
50 100 150
# GFP-LC3 puncta/cell
p < 0.0001
p < 0.0001 p < 0.0001
p62
DAPI
Mer
g
e
siCTRL siSIK2
+ 50μM Chloroquine
Merge
siCTRL siSIK2
# p62 puncta/cell
0 50 100
p < 0.0001
G.
ERK1/2 p62 SIK2
siCTRL siSIK2 #1 siCTRL siSIK2
siCTRL siSIK2
HCC1806
D. C.
siSIK2 #2
SUM159
SUM159 HCC1806
pSER555 ULK1
Total ULK1
ERK1/2
H. I. J.
0 50 100
CTRL
SIK2 K49M
# GFP-LC3 puncta/cell
+ 50μM Chloroquine
p < 0.0001
FIG 3SIK2 restrict autophagy. (A to C) Immunoblots of WCLs from cells transfected with the indicated siRNAs for 72 h. (D) Representative confocal sections
U20S-GFP-LC3 cells revealed that depletion of SIK2 enhanced
GFP-LC3 accumulation, which was increased further upon Cq
exposure (see Fig. S1A in the supplemental material). Notably,
U20S cells also exhibited a reduction in viability upon depletion of
SIK2 (see Fig. S1B). We also used p62 to monitor endogenous
autophagosomes and found that SIK2 depletion and exposure to
Cq led to an enhanced accumulation of p62-positive puncta (
Fig.
3F
and
G
).
To assess whether pharmacological inhibition of SIK2
pheno-copied the siRNA phenotype, we exposed SUM159-GFP-LC3 cells
to ARN-3236 in the presence of Cq. Here, we observed a
time-dependent accumulation of GFP-LC3 vesicles, similar to the
siRNA phenotype (
Fig. 3H
and
I
). We next asked whether the
kinase activity was required for the observed changes in flux by
stably overexpressing a kinase-dead mutant of SIK2 (K49M).
Upon exposure to Cq, we observed an increase in autophagic flux,
indicating that the kinase-dead mutant functions in a
dominant-negative fashion (
Fig. 3J
). These data indicate that SIK2 restrains
autophagy in TNBC, which in a specific subset of tumors is
essen-tial for survival.
We next evaluated whether the activation of autophagy upon
SIK2 loss was responsible for the reduction in tumor cell viability.
To do this, we performed an epistasis experiment in which
au-tophagic vesicle formation was inhibited by depletion of ATG5, a
key lipidation protein essential for the first steps in vesicle
forma-tion. In SUM159 cells, loss of ATG5 alone reduced GFP-LC3
ves-icle accumulation and enhanced LC3-I, which is not associated
with autophagosomes (
Fig. 4A
). Importantly, when SIK2 and
ATG5 were codepleted, the ATG5 phenotype dominated, as we
observed minimal vesicle formation and a stabilization of LC3-I
(
Fig. 4A
and
B
). Moreover, codepletion of ATG5 rescued the loss
of viability observed upon depletion of SIK2 alone (
Fig. 4C
and
D
). These data indicate that inhibition of SIK2 leads to excessive
autophagy, which in certain TNBC settings results in cell death.
Findings thus far suggest that SIK2 is essential for viability, and
its inhibition could be an antitumor strategy. Thus, we next
as-sessed whether inhibition of SIK2
in vivo
would reduce tumor
growth (
30
). To test this possibility, we used shRNA to reduce
SIK2 mRNA and protein in SUM159 cells (
Fig. 4E
). These cells
were attenuated in their capacity to form colonies in soft-agar
assays, mimicking the phenotypes observed with siSIK2 and
ARN-3236 (
Fig. 4F
). Immediately following knockdown, these cells
were implanted into the flanks of NSG mice and tumor growth
was monitored for 6 weeks. Tumor initiation in shSIK2 tumors
was significantly decreased and shSIK2 tumors were much smaller
than those in the control group (
Fig. 4G
), suggesting that SIK2 is
essential for tumorigenesis
in vivo
. Collectively, these results
sug-gest that SIK2 functions in breast tumor and normal cells to
re-strain autophagic flux. In a subset of TNBC this function is
essen-tial for survival, and releasing this brake leads to cell death.
DISCUSSION
Treatment options in TNBC are limited to chemotherapy,
radia-tion, and surgery. The response of individual patients to these
intervention strategies is often unpredictable, incomplete, and
ephemeral. There is an urgent need to identify new therapeutic
entry points with associated predictive biomarkers to improve
long-term outcomes for this patient population. The molecular
classification of tumors into intrinsic subtypes presents an
oppor-tunity to determine if selective vulnerabilities exist among the
dif-ferent phenotypes within TNBC. By capitalizing on the faithful
recapitulation of tumor subtypes in patient-derived cell lines, we
find that SIK2 is selectively essential for survival particularly in the
claudin-low subtype. Notably, this is the first identification of a
molecular vulnerability aligned with the claudin-low disease,
which is less sensitive to first-line chemotherapeutic regimens
than other TNBC subtypes (
7
). Our findings may represent an
important first step in tailoring treatment to this group of patients.
In particular, ARN-3230 is an emerging SIK2 inhibitor for use in
ovarian cancer patients that could be applied to the claudin-low
setting. It is important to note that the alignment of SIK2
sensi-tivity was not uniform among the claudin-low cell lines tested.
Additional investigations into molecular biomarkers that predict
SIK2 sensitivity will be essential for more precisely identifying
responsive patients.
Our findings suggest that SIK2 restricts autophagic flux.
Au-tophagy has been implicated in both pro- and antitumorigenic
function. For example, autophagy can be essential for tumor cell
survival by limiting death due to hypoxia, inflammation, and
che-motherapy (
35–38
). Conversely, suppression of autophagy has
been unequivocally shown to limit tumorigenesis in mouse
mod-els (
39–41
). The contribution of autophagy to tumorigenesis is
likely dependent on many factors, including the disease site and
stage. Our findings suggest that autophagy is a tumor suppressor
mechanism in claudin-low breast cancer. This result is also
sup-ported by human clinical studies demonstrating that beclin-1, an
essential autophagy gene, is frequently lost in TNBC and
corre-lates with poor survival (
30
). Our studies, particularly with ATG
codepletion, suggest that the inhibition of SIK2 leads to an
au-tophagic cell death (
42
). Whether autophagy itself is directly
exe-cuting the cell death is unclear. It is possible that the unrestrained
autophagy is leading to autolysis in sensitive cells (
43
). Perhaps the
endoplasmic reticulum in SIK2-dependent cells is more easily
de-pleted, leading to a rapid loss of viability once high levels of
au-tophagy are activated. Alternatively, auau-tophagy may be triggering
cell death processes, such as necrosis or apoptosis, and SIK2 is
required to prevent these mechanisms. Finally, activation of
au-tophagy could kill only certain sets of tumor cells through the
selective degradation of limiting substrates, including proteins or
organelles such as mitochondria. Perhaps inhibition of autophagy
is essential for maintenance of the mesenchymal and primordial
features of claudin-low tumors, without which these tumor cells
activate cell death programs. Reactivation of tumor suppressor
functions lost during transformation is a particularly difficult
therapeutic strategy. As we find that SIK2 may restrain autophagy,
reinstating this antitumor function could be a feasible strategy
through small-molecule inhibition of SIK2.
(
31
). Low-stearic-hindrance gatekeeper residues, such as SIKs, are
associated with higher basal kinase activity (
27
). Thus, it is
possi-ble that SIK2 activity undergoes negative regulation by upstream
kinases, as has been shown for PKA. Furthermore, the only
well-validated SIK substrates are CRTC1-3 and HDAC4 (
12
,
13
,
44
).
One report suggested that SIK2 resides on autophagic vesicles,
presenting the possibility that it directly phosphorylates key
regu-lators of vesicle formation. Taken together, our findings present a
siSIK2
shCTRL
shSIK2
0 0.5 1.0
shCTRL shSIK2
SIK2
ERK1/2
G.
SIK2 mRNA Expression (Relative Fold Change)
shCTRL shSIK2
ERK1/2 LC3-II LC3-I SIK2
siCTRL siSIK2 siSIK2 & A
T
G5
siA
T
G5
GFP
DAPI
siCTRL siSIK2
A.
SUM159 GFP-LC3
C.
SUM159
SUM159
B.
SUM159
# Colonies
0 100 200 300 400 siCTRL siSIK2
siSIK2& A
T
G5
siA
T
G
5
0 0.5 1.0
siSIK2 & ATG5
E. D. siCTRL
siATG5
siATG5 siSIK2 & ATG5
p = 0.0067
0 0.2 0.4 0.6 0.8
T
u
mor V
o
lume
(cm
3)
1.0
0 10 20 30 40 50
shSIK2 shNon-Targeting
p = 0.0002
SUM159
shCTRL shSIK2 0 0.1 0.2 0.3 0.4 0.5
T
u
mor W
eight
(g)
p = 0.0004
Days Post Injection F.
H. E.
ATG5
Viability (relative to siCTRL)
FIG 4SIK2 restricts autophagy to support TNBC viability. (A) SUM159-GFP-LC3 cells were transfected with the indicated siRNAs for 72 h and exposed to 50
M Cq for 16 h. Cells were fixed, stained with DAPI, and visualized for GFP. Representative images were captured by epifluorescence. Scale bars, 20m. (B) Cells were transfected with the indicated siRNAs for 72 h. WCLs were immunoblotted with the indicated antibodies. (C) Cell lines were transfected with the indicated siRNAs for 96 h (SUM159). Bars represent average relative viability and ranges (n⫽2) measured by CTG. (D) Bright-field images of SUM159 cells transfected as described for panel C. (E) SUM159 cells were infected with lentivirus encoding shCTRL or shSIK2 hairpins for 2 days. (Left) Relative SIK2 mRNA expression was measured by qPCR in SUM159 cells stably expressing the indicated shRNAs. Bars represent average levels of SIK2 mRNA and range (n⫽2). (Right) WCLs from cells shown on the left were immunoblotted for the indicated antibodies. (F) Cells shown in panel E were plated into soft agar. Bars represent the average number of colonies quantitated manually (n⫽3⫾standard errors of the means [SEM]). ThePvalue was calculated using a two-tailed Studentttest. (G) Growth curves of SUM159 cells shown in panel E were injected subcutaneously in NSG mice, and tumor volume was measured at the indicated time points. Points represent average volumes of shCTRL (n⫽10) or shSIK2 (n⫽10)⫾SEM. ThePvalue was calculated with an unpaired, two-tailed Studentttest. (H) At the study endpoint, tumors were excised and weighed. (Top) Bars represent mean tumor weights⫾SEM. ThePvalue was calculated with an unpaired, two-tailed Student
fresh phenotypic context to study SIK2 regulatory processes that
impinge on autophagy in both the normal and transformed states.
ACKNOWLEDGMENTS
We thank Brian Golitz for assistance with siRNA screens, Brandt Nichols for assistance with animal experiments, and Aleix Prat and Charles Perou for breast cancer cell lines.
Hariprasad Vankayalapati is chief scientific officer and founder of Ar-rien Pharmaceuticals.
FUNDING INFORMATION
K.E.M. was supported by general medicine training grant T32GM007040-37. A.W.W. is supported by NIH grant CA154699. The Simmons Cancer Center Support Grant 5P30 CA142543-05 supported shared resources used in this study at UTSW. This work was also supported by CA058223.
REFERENCES
1.Hammond ME, Hayes DF, Dowsett M, Allred DC, Hagerty KL, Badve
S, Fitzgibbons PL, Francis G, Goldstein NS, Hayes M, Hicks DG, Lester S, Love R, Mangu PB, McShane L, Miller K, Osborne CK, Paik S, Perlmutter J, Rhodes A, Sasano H, Schwartz JN, Sweep FC, Taube S, Torlakovic EE, Valenstein P, Viale G, Visscher D, Wheeler T, Williams
RB, Wittliff JL, Wolff AC.2010. American Society of Clinical Oncology/
College Of American Pathologists guideline recommendations for immu-nohistochemical testing of estrogen and progesterone receptors in breast cancer. J Clin Oncol28:2784 –2795.http://dx.doi.org/10.1200/JCO.2009 .25.6529.
2.Jahanzeb M.2008. Adjuvant trastuzumab therapy for HER2-positive
breast cancer. Clin Breast Cancer8:324 –333.http://dx.doi.org/10.3816 /CBC.2008.n.037.
3.Slamon DJ, Leyland-Jones B, Shak S, Fuchs H, Paton V, Bajamonde A,
Fleming T, Eiermann W, Wolter J, Pegram M, Baselga J, Norton L. 2001. Use of chemotherapy plus a monoclonal antibody against HER2 for metastatic breast cancer that overexpresses HER2. N Engl J Med344:783– 792.http://dx.doi.org/10.1056/NEJM200103153441101.
4.Prat A, Lluch A, Albanell J, Barry WT, Fan C, Chacon JI, Parker JS,
Calvo L, Plazaola A, Arcusa A, Segui-Palmer MA, Burgues O, Ribelles N, Rodriguez-Lescure A, Guerrero A, Ruiz-Borrego M, Munarriz B, Lopez JA, Adamo B, Cheang MC, Li Y, Hu Z, Gulley ML, Vidal MJ, Pitcher BN, Liu MC, Citron ML, Ellis MJ, Mardis E, Vickery T, Hudis CA, Winer EP, Carey LA, Caballero R, Carrasco E, Martin M, Perou
CM, Alba E.2014. Predicting response and survival in
chemotherapy-treated triple-negative breast cancer. Br J Cancer111:1532–1541.http://dx .doi.org/10.1038/bjc.2014.444.
5.Onitilo AA, Engel JM, Greenlee RT, Mukesh BN.2009. Breast cancer
subtypes based on ER/PR and Her2 expression: comparison of clinico-pathologic features and survival. Clin Med Res7:4 –13.http://dx.doi.org /10.3121/cmr.2008.825.
6.Perou CM, Sorlie T, Eisen MB, van de Rijn M, Jeffrey SS, Rees CA,
Pollack JR, Ross DT, Johnsen H, Akslen LA, Fluge O, Pergamenschikov A, Williams C, Zhu SX, Lonning PE, Borresen-Dale AL, Brown PO,
Botstein D.2000. Molecular portraits of human breast tumours. Nature
406:747–752.http://dx.doi.org/10.1038/35021093.
7.Prat A, Parker JS, Karginova O, Fan C, Livasy C, Herschkowitz JI, He
X, Perou CM.2010. Phenotypic and molecular characterization of the
claudin-low intrinsic subtype of breast cancer. Breast Cancer Res12:R68.
http://dx.doi.org/10.1186/bcr2635.
8.Lehmann BD, Bauer JA, Chen X, Sanders ME, Chakravarthy AB, Shyr
Y, Pietenpol JA. 2011. Identification of human triple-negative breast
cancer subtypes and preclinical models for selection of targeted therapies. J Clin Investig121:2750 –2767.http://dx.doi.org/10.1172/JCI45014.
9.Neve RM, Chin K, Fridlyand J, Yeh J, Baehner FL, Fevr T, Clark L,
Bayani N, Coppe JP, Tong F, Speed T, Spellman PT, DeVries S, Lapuk A, Wang NJ, Kuo WL, Stilwell JL, Pinkel D, Albertson DG, Waldman FM, McCormick F, Dickson RB, Johnson MD, Lippman M, Ethier S,
Gazdar A, Gray JW.2006. A collection of breast cancer cell lines for the
study of functionally distinct cancer subtypes. Cancer Cell10:515–527.
http://dx.doi.org/10.1016/j.ccr.2006.10.008.
10. Sorlie T, Perou CM, Tibshirani R, Aas T, Geisler S, Johnsen H, Hastie
T, Eisen MB, van de Rijn M, Jeffrey SS, Thorsen T, Quist H, Matese JC,
Brown PO, Botstein D, Lonning PE, Borresen-Dale AL.2001. Gene
expression patterns of breast carcinomas distinguish tumor subclasses with clinical implications. Proc Natl Acad Sci U S A98:10869 –10874.http: //dx.doi.org/10.1073/pnas.191367098.
11. Prat A, Karginova O, Parker JS, Fan C, He X, Bixby L, Harrell JC,
Roman E, Adamo B, Troester M, Perou CM.2013. Characterization of
cell lines derived from breast cancers and normal mammary tissues for the study of the intrinsic molecular subtypes. Breast Cancer Res Treat142: 237–255.http://dx.doi.org/10.1007/s10549-013-2743-3.
12. Dentin R, Liu Y, Koo SH, Hedrick S, Vargas T, Heredia J, Yates J, III,
Montminy M.2007. Insulin modulates gluconeogenesis by inhibition of
the coactivator TORC2. Nature449:366 –369.http://dx.doi.org/10.1038 /nature06128.
13. Screaton RA, Conkright MD, Katoh Y, Best JL, Canettieri G, Jeffries S,
Guzman E, Niessen S, Yates JR, III, Takemori H, Okamoto M,
Mont-miny M.2004. The CREB coactivator TORC2 functions as a calcium- and
cAMP-sensitive coincidence detector. Cell119:61–74.http://dx.doi.org /10.1016/j.cell.2004.09.015.
14. Itoh Y, Sanosaka M, Fuchino H, Yahara Y, Kumagai A, Takemoto D,
Kagawa M, Doi J, Ohta M, Tsumaki N, Kawahara N, Takemori H.2015.
Salt-inducible kinase 3 signaling is important for the gluconeogenic pro-grams in mouse hepatocytes. J Biol Chem290:17879 –17893.http://dx.doi .org/10.1074/jbc.M115.640821.
15. Nixon M, Stewart-Fitzgibbon R, Fu J, Akhmedov D, Rajendran K,
Mendoza-Rodriguez MG, Rivera-Molina YA, Gibson M, Berglund ED,
Justice NJ, Berdeaux R.2016. Skeletal muscle salt inducible kinase 1
promotes insulin resistance in obesity. Mol Metab5:34 – 46.http://dx.doi .org/10.1016/j.molmet.2015.10.004.
16. Park J, Yoon YS, Han HS, Kim YH, Ogawa Y, Park KG, Lee CH, Kim
ST, Koo SH.2014. SIK2 is critical in the regulation of lipid homeostasis
and adipogenesis in vivo. Diabetes63:3659 –3673.http://dx.doi.org/10 .2337/db13-1423.
17. Lombardi MS, Gillieron C, Dietrich D, Gabay C.2016. SIK inhibition in
human myeloid cells modulates TLR and IL-1R signaling and induces an anti-inflammatory phenotype. J Leukoc Biol99:711–721. http://dx.doi .org/10.1189/jlb.2A0715-307R.
18. Potts MB, Kim HS, Fisher KW, Hu Y, Carrasco YP, Bulut GB, Ou YH,
Herrera-Herrera ML, Cubillos F, Mendiratta S, Xiao G, Hofree M,
Ideker T, Xie Y, Huang LJ, Lewis RE, MacMillan JB, White MA.2013.
Using functional signature ontology (FUSION) to identify mechanisms of action for natural products. Sci Signal6:ra90.
19. Sanosaka M, Fujimoto M, Ohkawara T, Nagatake T, Itoh Y, Kagawa M,
Kumagai A, Fuchino H, Kunisawa J, Naka T, Takemori H. 2015.
Salt-inducible kinase 3 deficiency exacerbates lipopolysaccharide-induced endotoxin shock accompanied by increased levels of pro-inflammatory molecules in mice. Immunology145:268 –278.http://dx.doi.org/10.1111 /imm.12445.
20. Sundberg TB, Choi HG, Song JH, Russell CN, Hussain MM, Graham
DB, Khor B, Gagnon J, O’Connell DJ, Narayan K, Dancik V, Perez JR,
Reinecker HC, Gray NS, Schreiber SL, Xavier RJ, Shamji AF. 2014.
Small-molecule screening identifies inhibition of salt-inducible kinases as a therapeutic strategy to enhance immunoregulatory functions of den-dritic cells. Proc Natl Acad Sci U S A111:12468 –12473.http://dx.doi.org /10.1073/pnas.1412308111.
21. Yang FC, Tan BC, Chen WH, Lin YH, Huang JY, Chang HY, Sun HY,
Hsu PH, Liou GG, Shen J, Chang CJ, Han CC, Tsai MD, Lee SC.2013.
Reversible acetylation regulates salt-inducible kinase (SIK2) and its func-tion in autophagy. J Biol Chem288:6227– 6237.http://dx.doi.org/10.1074 /jbc.M112.431239.
22. Ahmed AA, Lu Z, Jennings NB, Etemadmoghadam D, Capalbo L,
Jacamo RO, Barbosa-Morais N, Le XF, Australian Ovarian Cancer Study Group, Vivas-Mejia P, Lopez-Berestein G, Grandjean G, Bar-tholomeusz G, Liao W, Andreeff M, Bowtell D, Glover DM, Sood AK,
Bast RC, Jr.2010. SIK2 is a centrosome kinase required for bipolar mitotic
spindle formation that provides a potential target for therapy in ovarian cancer. Cancer Cell18:109 –121.http://dx.doi.org/10.1016/j.ccr.2010.06 .018.
23. Bon H, Wadhwa K, Schreiner A, Osborne M, Carroll T,
Ramos-Montoya A, Ross-Adams H, Visser M, Hoffmann R, Ahmed AA, Neal
DE, Mills IG.2014. Salt-inducible kinase 2 regulates mitotic progression
and transcription in prostate cancer. Mol Cancer Res13:620 – 635.http: //dx.doi.org/10.1158/1541-7786.MCR-13-0182-T.
Iglehart JD, Miron A, Richardson AL, Hahn WC, Zhao JJ.2009. SIK1 couples LKB1 to p53-dependent anoikis and suppresses metastasis. Sci Signal2:ra35.
25. Clark K, MacKenzie KF, Petkevicius K, Kristariyanto Y, Zhang J, Choi
HG, Peggie M, Plater L, Pedrioli PG, McIver E, Gray NS, Arthur JS,
Cohen P.2012. Phosphorylation of CRTC3 by the salt-inducible kinases
controls the interconversion of classically activated and regulatory mac-rophages. Proc Natl Acad Sci U S A109:16986 –16991.http://dx.doi.org /10.1073/pnas.1215450109.
26. Bain J, Plater L, Elliott M, Shpiro N, Hastie CJ, McLauchlan H,
Klevernic I, Arthur JS, Alessi DR, Cohen P.2007. The selectivity of
protein kinase inhibitors: a further update. Biochem J408:297–315.http: //dx.doi.org/10.1042/BJ20070797.
27. Gum RJ, McLaughlin MM, Kumar S, Wang Z, Bower MJ, Lee JC,
Adams JL, Livi GP, Goldsmith EJ, Young PR. 1998. Acquisition of
sensitivity of stress-activated protein kinases to the p38 inhibitor, SB 203580, by alteration of one or more amino acids within the ATP binding pocket. J Biol Chem273:15605–15610.http://dx.doi.org/10.1074/jbc.273 .25.15605.
28. Wang Z, Canagarajah BJ, Boehm JC, Kassisa S, Cobb MH, Young PR,
Abdel-Meguid S, Adams JL, Goldsmith EJ. 1998. Structural basis of
inhibitor selectivity in MAP kinases. Structure6:1117–1128.http://dx.doi .org/10.1016/S0969-2126(98)00113-0.
29. White E.2015. The role for autophagy in cancer. J Clin Investig125:42–
46.http://dx.doi.org/10.1172/JCI73941.
30. Tang H, Sebti S, Titone R, Zhou Y, Isidoro C, Ross TS, Hibshoosh H,
Xiao G, Packer M, Xie Y, Levine B.2015. Decreased mRNA expression
in human breast cancer is associated with estrogen receptor-negative sub-types and poor prognosis. EBioMedicine2:255–263.http://dx.doi.org/10 .1016/j.ebiom.2015.01.008.
31. Patel K, Foretz M, Marion A, Campbell DG, Gourlay R, Boudaba N,
Tournier E, Titchenell P, Peggie M, Deak M, Wan M, Kaestner KH, Goransson O, Viollet B, Gray NS, Birnbaum MJ, Sutherland C,
Saka-moto K.2014. The LKB1-salt-inducible kinase pathway functions as a key
gluconeogenic suppressor in the liver. Nat Commun5:4535.
32. Kim J, Kundu M, Viollet B, Guan KL.2011. AMPK and mTOR regulate
autophagy through direct phosphorylation of Ulk1. Nat Cell Biol13:132– 141.http://dx.doi.org/10.1038/ncb2152.
33. Hara T, Takamura A, Kishi C, Iemura S, Natsume T, Guan JL,
Miz-ushima N.2008. FIP200, a ULK-interacting protein, is required for
au-tophagosome formation in mammalian cells. J Cell Biol181:497–510.
http://dx.doi.org/10.1083/jcb.200712064.
34. Egan DF, Chun MG, Vamos M, Zou H, Rong J, Miller CJ, Lou HJ,
Raveendra-Panickar D, Yang CC, Sheffler DJ, Teriete P, Asara JM, Turk
BE, Cosford ND, Shaw RJ.2015. Small molecule inhibition of the
au-tophagy kinase ULK1 and identification of ULK1 substrates. Mol Cell 59:285–297.http://dx.doi.org/10.1016/j.molcel.2015.05.031.
35. Degenhardt K, Mathew R, Beaudoin B, Bray K, Anderson D, Chen G,
Mukherjee C, Shi Y, Gelinas C, Fan Y, Nelson DA, Jin S, White E.2006.
Autophagy promotes tumor cell survival and restricts necrosis, inflamma-tion, and tumorigenesis. Cancer Cell10:51– 64.http://dx.doi.org/10.1016 /j.ccr.2006.06.001.
36. Guo JY, Chen HY, Mathew R, Fan J, Strohecker AM, Karsli-Uzunbas G,
Kamphorst JJ, Chen G, Lemons JM, Karantza V, Coller HA, Dipaola
RS, Gelinas C, Rabinowitz JD, White E.2011. Activated Ras requires
autophagy to maintain oxidative metabolism and tumorigenesis. Genes Dev25:460 – 470.http://dx.doi.org/10.1101/gad.2016311.
37. Lock R, Kenific CM, Leidal AM, Salas E, Debnath J.2014.
Autophagy-dependent production of secreted factors facilitates oncogenic RAS-driven invasion. Cancer Discov 4:466 – 479. http://dx.doi.org/10.1158 /2159-8290.CD-13-0841.
38. Hu YL, Jahangiri A, Delay M, Aghi MK.2012. Tumor cell autophagy as
an adaptive response mediating resistance to treatments such as antian-giogenic therapy. Cancer Res72:4294 – 4299.http://dx.doi.org/10.1158 /0008-5472.CAN-12-1076.
39. Liang XH, Jackson S, Seaman M, Brown K, Kempkes B, Hibshoosh H,
Levine B.1999. Induction of autophagy and inhibition of tumorigenesis
by beclin 1. Nature402:672– 676.http://dx.doi.org/10.1038/45257.
40. Wei H, Wei S, Gan B, Peng X, Zou W, Guan JL.2011. Suppression of
autophagy by FIP200 deletion inhibits mammary tumorigenesis. Genes Dev25:1510 –1527.http://dx.doi.org/10.1101/gad.2051011.
41. Mathew R, Karp CM, Beaudoin B, Vuong N, Chen G, Chen HY, Bray
K, Reddy A, Bhanot G, Gelinas C, Dipaola RS, Karantza-Wadsworth V,
White E.2009. Autophagy suppresses tumorigenesis through elimination
of p62. Cell137:1062–1075.http://dx.doi.org/10.1016/j.cell.2009.03.048.
42. Galluzzi L, Vitale I, Abrams JM, Alnemri ES, Baehrecke EH,
Blagosk-lonny MV, Dawson TM, Dawson VL, El-Deiry WS, Fulda S, Gottlieb E, Green DR, Hengartner MO, Kepp O, Knight RA, Kumar S, Lipton SA, Lu X, Madeo F, Malorni W, Mehlen P, Nunez G, Peter ME, Piacentini M, Rubinsztein DC, Shi Y, Simon HU, Vandenabeele P, White E, Yuan
J, Zhivotovsky B, Melino G, Kroemer G.2012. Molecular definitions of
cell death subroutines: recommendations of the Nomenclature Commit-tee on Cell Death 2012. Cell Death Differ19:107–120.http://dx.doi.org/10 .1038/cdd.2011.96.
43. Liu Y, Shoji-Kawata S, Sumpter RM, Jr, Wei Y, Ginet V, Zhang L,
Posner B, Tran KA, Green DR, Xavier RJ, Shaw SY, Clarke PG, Puyal
J, Levine B.2013. Autosis is a Na⫹,K⫹-ATPase-regulated form of cell
death triggered by autophagy-inducing peptides, starvation, and hypoxia-ischemia. Proc Natl Acad Sci U S A110:20364 –20371.http://dx.doi.org /10.1073/pnas.1319661110.
44. Henriksson E, Sall J, Gormand A, Wasserstrom S, Morrice NA, Fritzen
AM, Foretz M, Campbell DG, Sakamoto K, Ekelund M, Degerman E,
Stenkula KG, Goransson O.2015. SIK2 regulates CRTCs, HDAC4 and