UNDERSTANDING URBAN DEVELOPMENT AND WATER QUALITY THROUGH SCENARIOS
Tracy Hadden Loh
A dissertation submitted to the faculty of the University of North Carolina at Chapel Hill in partial fulfillment of the requirements for the degree of Doctor of Philosophy in the Department of City and Regional Planning.
Chapel Hill 2012
Approved By: Yan Song
ACKNOWLEDGEMENTS
For my father, Wilbur C. Hadden, Ph.D. If we don’t translate from the Latin, you are truly my
‘coactor’ in this endeavor.
If my character’s flawed by only a few little faults, and otherwise sound...
and if no one can accuse me in fairness of greed, meanness, debauchery, if in
truth, in my own praise, I live purely, innocently, loved by my friends: it’s due
to my father...he, the truest of guardians, toured all my teachers...he guarded
my innocence, and that’s virtue’s prime ornament...if at a certain point in
our lives Nature required us to relive the past, and choose what parents we
wished, to suit our pride, then I’d still be content with mine. -- Horace, Satires
ABSTRACT
TRACY HADDEN LOH: Understanding Urban Development and Water Quality Through Scenarios
(under the direction of Yan Song)
The Clean Air Act establishes a framework for regions to target environmental
outcomes related to air quality in long-range transportation planning in the United
States. Similarly, the Clean Water Act establishes a framework for regions to improve
their environmental performance regarding water quality standards when regulating
land development. However, these policy and planning frameworks do not reflect the
well-established relationship between transportation and land use. Is this a problem? I
applied the land use/transportation model TRANUS in parallel with the EPA’s Storm Water
Management Model (SWMM) to simulate the water quality outcomes of two alternative
long-range transportation plans for Mecklenburg County in North Carolina. I found that
alternative regional urban forms can significantly influence only the spatial pattern of
stormwater runoff.
This finding departs substantially from previous research suggesting that
development strategies that promote densification can reduce per capita stormwater
runoff. These results suggest that regional growth management strategies developed to
meet air quality goals are not optimal for meeting watershed protection goals. Parallel
and competing planning processes for land use and transportation produce suboptimal
different scales which are sometimes in conflict. Achieving full transparency about tradeoffs
between alternatives is particularly fraught because the costs and benefits inherent in these
competing goals are not experienced at the same spatial scale, or by the same localities or
classes of people. With regard to environmental performance, the federal government plays
a unique role in mandating planning and promoting best management practices. The results
of this study suggest that there is a real opportunity for the EPA and USDOT to integrate
TABLE OF CONTENTS
LIST OF TABLES ... vii
LIST OF FIGURES ...viii
Chapter I. INTRODUCTION ...1
II. LITERATURE REVIEW ...11
Impacts of Growth on Water Quality ...11
Scenario Building ...17
Urban Growth Modeling...22
Water Quality Modeling ... 29
Related Research ...40
III. CONCEPTUAL FRAMEWORK ... 46
IV. RESEARCH DESIGN AND METHODS ... 56
Research Design ... 56
Representing Pattern ... 60
Modeling Land Use and Transportation ... 60
Scenario Development ... 64
Modeling Stormwater Runoff Volume ...73
From TRANUS to SWMM ...83
V. RESULTS ... 93
Limitations ...100
VI. CONCLUSION ...102
Implications for Planners ...104
Implications for Research ...107
LIST OF TABLES Table
1. Urban Futures ...18
2. Summary of Water Quality Models ... 39
3. TRANUS Sectors ... 63
4. Density Benchmarks for Land Consumption ...71
5. Land Surface Component Required Parameters ... 75
6. Simplified Soil Types ...77
7. Model Calibration and Validation Statistics ...81
8. Model 1 OLS Results ...84
9. Model 2 OLS Results ... 86
10. Model 3 OLS Results ... 89
11. Geographically Weighted Regression ... 90
12. Changes in Runoff Volume by Basin ... 95
13. Descriptive Statistics of Subcatchment Peak Flow Changes from Baseline ... 96
1. Project Study Area ... 6
2. Theoretical Model of Interactions Between Urban Form and Water Quality ... 16
3. Density Concepts ... 51
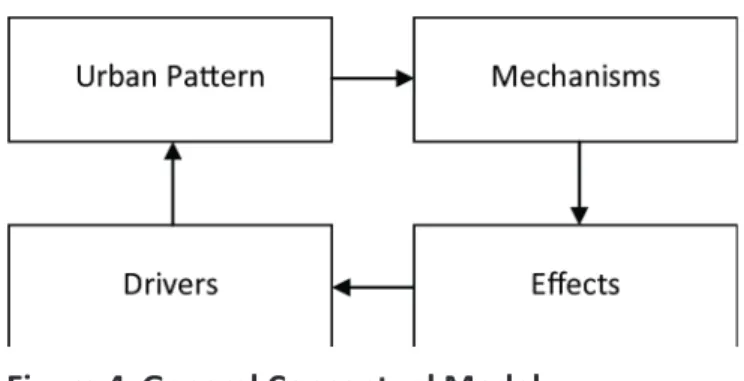
4. General Conceptual Model ... 52
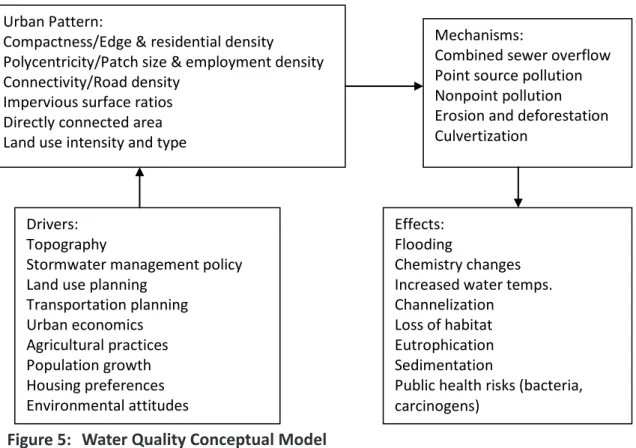
5. Water Quality Conceptual Model ... 53
6. Key Variables ... 54
7. Model Framework ... 56
8. Operation ... 59
9. TRANUS Land Use ... 62
10. TRANUS Transport ... 62
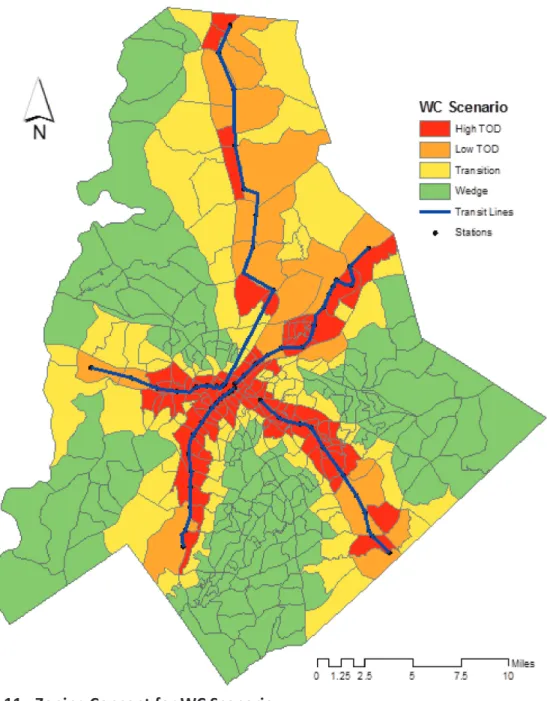
11. Zoning Concept for WC Scenario ... 69
12. Precipitation Gauges of the SWMM Atmosphere Component ...74
13. Calibration Locations ... 79
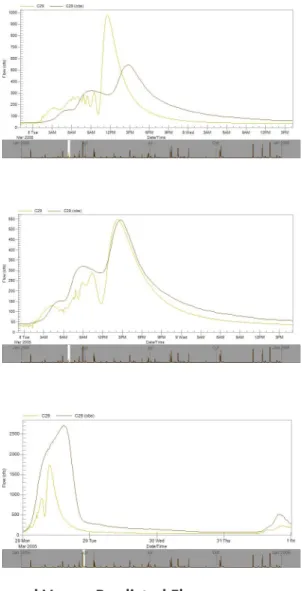
14. Conduit 29 Observed Versus Predicted Flow ...80
15. Simulation Model Response Units for TRANUS and SWMM ...83
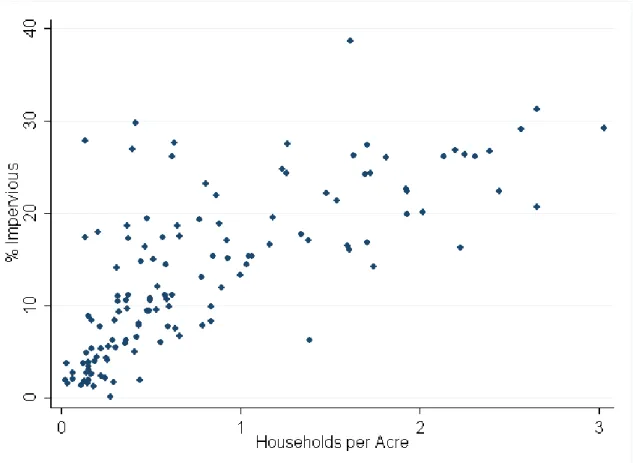
16. Scatterplot of Impervious Ratio and Residential Density by Subcatchment ...87
17. Scatterplot of Impervious Ratio and Employment Density by Subcatchment ...87
18. Scatterplot of Impervious Ratio and Road Density by Subcatchment ...88
19. Impervious Ratio Predictions by Scenario ... 91
20. Percent Change in Runoff by Major Basin for Two Scenarios ... 94
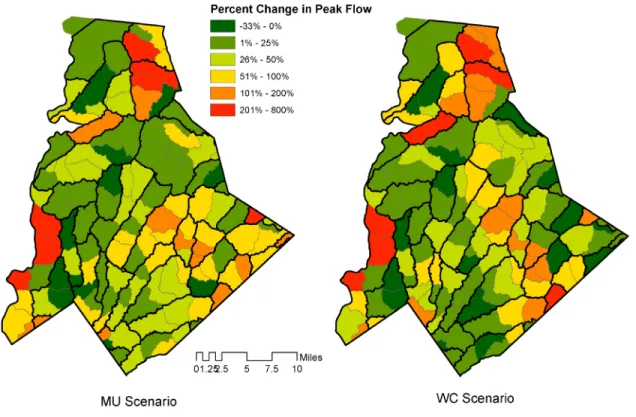
21. Percent Change in Peak Flow by Subcatchment for Two Scenarios ... 97
22. Major Catchments of Mecklenburg County ... 98 LIST OF FIGURES
CHAPTER 1 INTRODUCTION
As of 2008, the United Nations estimates that half of the world’s population will
live in cities. At the same time, there is growing global concern about the impact of human
activities on the ecology of our planet (Grimm et. al. 2008). The concept of sustainability sits
at this crossroads – can humans find a way to live by which our local, regional, and global
resource and energy flows are in balance? Or will we simply consume raw materials and
produce non-recyclable waste until our planet is used up? This is a fascinating and exciting
moment in the history of cities. Cities of the past have churned with goods and capital while
enthusiastically exchanging with each other, relying on the surrounding region to house
excess population, absorb waste, and input food, water, and energy. As city sizes spiral larger
and larger, the capacity of surrounding areas to support unprecedented global metropolises
is stressed. In this, the first majority urban century, can we find a city of the future that is
more self-sustaining? Can we urbanize and remain in balance? This project will look at one
piece of this puzzle – water quality.
Across the United States, watersheds in urbanizing areas are poised on the brink
of a major change. Currently, healthy watersheds provide critical ecosystem services like
clean drinking water, fishing and swimming opportunities, erosion control, and flood
protection. However, as of 1994 the Environmental Protection Agency (EPA) has identified
continued functioning of these essential processes (EPA 1994). American cities are facing a
question with no known answer: can we manage growth in a way that preserves the health
and functionality of watersheds? In order to answer this question, our understanding of how
regional growth impacts watersheds must deepen. At the most fundamental level, changing
American streams and rivers of today show us the negative impact that urbanization can
have on watershed health.
This basic correlation is mediated through interventions known as best management
practices (BMPs). Many of these practices are implemented at the site level, through
features that alter the hydraulic characteristics of a developed site in order to reduce peak
flows and remove contaminants from stormwater runoff. As more and more localities
require the use of BMPs through building and subdivision design codes, these treatments
are becoming an increasingly common sight. Familiar urban BMPs may include green roofs,
detention basins, and swales (Claytor 2006 p. 340-1). A large body of research evaluating
and quantifying the effectiveness of these BMPs has empowered regulators and developers
to improve the environmental outcomes of development.
Best management practices are not confined to the site level, however. For example,
street sweeping can remove accumulated contaminants before they are mobilized into the
surface water system through stormwater runoff and become nonpoint source pollution.
There is increasing awareness that in addition to improving the quality of new development
with regards to stormwater management, the nonpoint source pollution problem must
also be addressed through such regional strategies. In particular, advocates such as the
Alliance have all argued that regional growth management tools should be applied for
stormwater management. Research to evaluate the usefulness of such complex, long-term
policy intervention could help demonstrate whether regional growth management can be a
best management practice.
The goal of this research is to test the hypothesis that alternative regional urban
forms can significantly influence water quality outcomes. Previous research has clearly
established a relationship between impervious area and nonpoint source pollution.
However, there are many metrics of urban form beyond imperviousness. This research
demonstrates that alternative regional urban forms may have the same total impervious
area, but different water quality outcomes. Other aspects of urban form, including directly
connected impervious area (distinct from total impervious area) and the spatial pattern of
imperviousness, are key to accurately specifying the relationship between urbanization and
water quality. This research identifies these variables and elucidates the spatial and scale
dynamics of the role they play in the processes that produce urban form and nonpoint
source pollution.
In the field of regional planning, there is currently little consensus on what
constitutes an ideal urban form (Batty 2008). Theorists and activists advocate for various
archetypes of urban form, such as the strictly monocentric city or the radial polycentric city,
often using arguments based on assumed environmental performance. In reality, however,
there is very little conclusive evidence regarding the impact of regional design on the
environment. This is especially true with regards to water quality, because the relationship
settlements rely on the natural hydrology around them for essential ecosystem services,
including management of ever-increasing volumes of stormwater runoff, most research
comparing urban archetypes has focused on transportation. American cities as diverse as
New York, NY and Cary, NC are applying divergent growth management strategies to protect
water resources, with essentially no hard information about the comparative advantages
of each strategy. Therefore, the objective of this project is to understand the water quality
consequences that emerge at the regional, watershed scale from widespread incremental
development decisions in land use and transportation over long periods of time.
Within the planning community, there is widespread interest in regional approaches
to stormwater management. Regional planning agencies like Chicago’s Metropolitan
Planning Council are looking for ways to improve water quality because they want to
reclaim urban waterfronts to improve the quality of life of urban residents and harness
the economic development potential of these areas. Regional water utilities want to be
partners in these efforts, and additionally are subject to the National Pollutant Discharge
Elimination System (NPDES) permit program (created by the EPA to implement the Clean
Water Act) that regulates Municipal Separate Storm Sewer Systems (MS4s). The cost of
compliance can be very steep – for example, the Long Term Control Plan (LTCP) required
as part of Washington, DC’s NPDES permit comes with a price tag of $1.2 billion, mostly
for stormwater infrastructure1. The Environmental Protection Agency’s guidance on this
program includes a list, known as the National Menu of BMPs, which can be used by urban
areas to comply with the NPDES. The motivation for this research project is to provide
quality data analysis to support decisions about the very serious financial and environmental
consequences of NPDES compliance, including what strategies cities and regions choose,
how new development is regulated including what metrics or benchmarks are used as
standards, and what strategy elements the EPA will promote in the National Menu of BMPs
or allow in individual regions’ LTCPs.
Planners and decision-makers need this research not only to improve the quality of
the decisions they make about stormwater management, but to inform the public about
the costs and tradeoffs involved in potential strategies. The high cost of improving and
maintaining a stormwater system is forcing many municipalities to create new sources of
revenue, such as stormwater utility fees. Ratepayers want to know what these fees are for
and be convinced that such charges are necessary and beneficial. This research is a critical
evaluation of the assumption that regional growth management can make a difference for
water quality. It serves the needs of consumers and planners for evidence to “make the
case” for land management decisions and new infrastructure. In addition this research tests
the hypotheses of smart growth advocates and quantifies the benefit that regions can derive
from attempting to connect regional urban form and water quality outcomes.
Previous research has attempted to meet these needs through a variety of modeling
approaches. The consistent theme of these studies is the assumption that at higher
densities of development, per-capita imperviousness will decrease, and thus per-capita
runoff. While this is clearly true at the site level, this project improves on previous research
by modeling both the land market’s and the watershed’s response to regulation of density at
development patterns are actually the result of a process, not primarily pre-determined
by planners. This is a critical distinction that speaks directly to the ability of the methods
applied in this research to effectively answer the research question for policy makers. This
greatly improves the test validity of the research design, and thus the value of the research
to consumers.
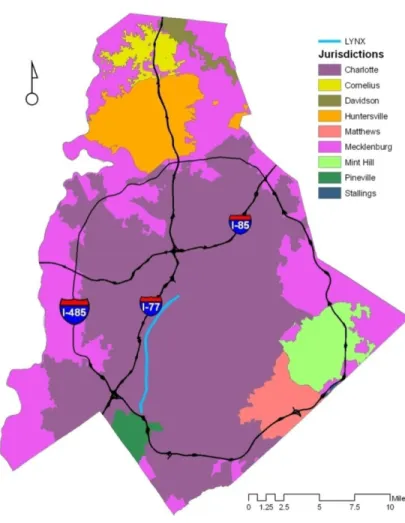
This project uses Charlotte, NC and surrounding Mecklenburg County as the study
area. Mecklenburg County is home to 235,530 households as of 2000 and nine incorporated
municipalities (Figure 1). The county is dominated by the city of Charlotte, which is the
largest city in North Carolina. As of 2007, Charlotte is the fifth-fastest growing major
metropolitan area in the U.S., according the U.S. Census. The Catawba River provides
drinking water for 1.5 million North Carolinians, and in 2008 was designated America’s
Most Endangered River by American Rivers, primarily because of the water quality threat
posed by urbanization. The parts of the Catawba/Yadkin River basins that form the study
area are located just north of the North Carolina/South Carolina border in the Piedmont
region. Protecting the water resources of this area is vital to the life and future of Charlotte
and North Carolina. However, it is clear that the same population and economic growth
that underpins the prosperity of this community may threaten its potential if the
decision-makers of the region do not have the information they need to manage development in a
sustainable way.
The rapid growth in Mecklenburg County since 1980 has been characterized
primarily by low density residential development. However, commercial development
has remained largely concentrated in the higher density urban core of Charlotte, where
employment in the area is still centralized. Local municipalities and the county have
undertaken a number of local and regional planning efforts to improve the way in which
new development is accommodated.
The region is currently involved in a number of major transportation investments
that will change the way residents of the county travel. These investments include the
completion of a beltway, the construction of toll lanes on that beltway, and an initial
investment in fixed-guideway transit in the form of a new light rail line, the LYNX. The
structure, with employment highly centralized in the CBD, where the Bank of America and
other major employers have their headquarters. Over the next few decades, the area will
face significant challenges related to managing development, including water scarcity,
congestion, and rising housing costs. These challenges will be driven by two fundamentals –
which land is developed where, and travel behavior.
The challenge in predicting the environmental performance of long-term and/
or regional-scale development alternatives is threefold. First, typically there are a large
number of unknowns in terms of the baseline state (impervious surface inventory; local
travel demand; current environmental performance). Second, the dynamics by which
these patterns and processes change are extremely complex. Third, the future is inherently
uncertain, and the longer the time horizon of the “future” that one seeks to explore, the
more impossible it is to say what it will be like. Previous research on the environmental
performance of land development alternatives has been hindered by each of these
challenges.
This research confronts each of these three obstacles using a three-pronged
strategy. First, the study area of Mecklenburg County is a particularly data-rich region, and
various city, county, and regional agencies contributed data to the project. Many attempts
to study the intersection of land use, transportation, and water quality are limited by the
nonexistence of critical and highly detailed spatial data such as the location and size of
building footprints, roads, continuous precipitation records, or stream gauges. Mecklenburg
County was an outstanding study area not just because of the appropriateness of evaluating
health given the current planning context of the area, but because the necessary rich data
existed and the relevant agencies were willing to share it.
Any research design investigating the outcomes of long-term land use change must
make decisions about how to model this change. The suitability and sophistication of the
modeling approach determines the internal and external validity of the findings. There are
merits and drawbacks at each end of the spectrum between simple, transparent models
and complex, data-intensive models. On the one hand, research that is easily replicable in
other study areas, and applies a methodology that readers from different disciplines and
levels of training can understand is valuable to policy-oriented research. On the other hand,
planning for the most part concerns large and complex established systems. In the American
context, individual stakeholders or agencies can only influence the margins of these systems.
Finding real margins of opportunity and estimating the correct sign or direction of those
opportunities requires rigor and nuance. For this reason, this project models long-term land
use change and hydrological response using a pair of computer simulations whose data
demands and calibration are extremely labor-intensive and complex, but whose theoretical
underpinnings stand on a mature understanding of the process dynamics in question.
Talking about the future is an endeavor inherently fraught with assumptions, driven
by values, and burdened by unknowables. These are precisely the conditions that computer
simulations cannot control for. Therefore, this project combines data and computation with
a scenario planning approach that incorporates assumptions, values, and unknowns in to
within a scenario space, this methodology captures both the qualitative and the quantitative
aspects of asking and attempting to answer questions about the future.
This project’s primary contribution to the body of research on environmental
planning is methodological. The novelty of the methods has two major components –
the intensive and sophisticated qualitative and quantitative effort put in to developing
the scenarios, and the statistical techniques used to build computer simulations of
unprecedented data richness. The model results clearly expose the tradeoffs between
alternative development management approaches, and the policy adjustments and
CHAPTER 2 LITERATURE REVIEW
This project is fundamentally interdisciplinary, drawing on ideas and methods
from city and regional planning, economics, environmental science, geography, and
computer science. This review will describe the current state of the relevant literature from
these areas relating to land use change, water quality, scenario planning, and computer
simulation. Part A will describe the current state of knowledge concerning the relationships
between urbanization and water quality, in order to show the position of the research
question of this project on the frontier of existing knowledge. Part B reviews different
scenario planning methods in order to establish a suitable and “good” approach for
addressing the research question. In Part C, major avenues within urban growth modeling
research are reviewed in order to explain the use of TRANUS in the research design. The
outcome variable in this research is water quality. Therefore Part D describes the state of
the art of water quality modeling relating to land use, including model selection criteria.
Finally, Part E reviews recent comparable research investigating land use and water quality
relationships to compare and contrast with this project.
Impacts of Growth on Water Quality
A general connection between human-made land use changes and decreasing
water quality is widely known (Smith et al. 1987; Tong & Chen 2002). Substantial research
characteristics related to water quality, and on elucidating the connections between these
characteristics and a cornucopia of water quality constituents (Kayhanian et al. 2003;
LeBlanc et al. 1997; Rhodes et al. 2001). The broad range of quality indicators includes
turbidity, levels of nutrients (nitrogen and phosphorus), measures of oil, grease, and metal
particle contamination, bacteria densities, dissolved oxygen levels, temperature, and biotic
measures like fish or microorganism counts. However, the benchmark Nationwide Urban
Runoff Program, conducted by the EPA from 1978 – 1982 to collect urban runoff quality
characteristics at 28 locations in the US found that flow volume is the single most important
parameter predicting urban runoff loads (Athayde et al. 1983, Tsihrintzis & Hamid 1997).
Stormwater runoff volume, then, is a key indicator of quality.
The direct agent that produces stormwater runoff is impervious surface. Surfaces
that cannot be infiltrated by water include rooftops, streets, sidewalks, driveways, parking
lots, sewer piping, and even gravel paving and compacted soil from construction sites and
landscaped lawns. The runoff from these surfaces degrades streams through pollution
contamination, and through altering stream channel structure by changing stream volume
and flow. Pollution contamination threatens public health and the health of aquatic species,
while changes to channel structure accelerate erosion and destroy habitat. Measures and
thresholds for impervious surface cover in a watershed have been declared the key to
understanding and mitigating the impact of runoff (Arnold Jr. & Gibbons 1996). However,
not all impervious surfaces are equal.
The function or use of the impervious surface is a significant factor in resulting
greater association with multiple severe indicators of stream degradation (Schueler 1995).
Automobile transportation-related coverage includes highways, streets, parking lots, and
driveways. One survey of areas with different dominant land uses concluded that, generally,
transportation-related imperviousness accounts for 63% - 70% of total imperviousness (City
of Olympia 1994). For many land use configurations, therefore, transportation infrastructure
is not only associated with problematic, non-biodegradable pollutants, but it composes are
larger share of the total surface area of concern, and thus may make a larger contribution
to runoff volume. Increasing road density has been linked to increased concentrations of
chemical pollutants associated with truck stops, gas stations, and road salt, including oil,
grease, and ions (Rhodes et. al. 2001). Furthermore, increasing annual average daily traffic
on highways has been correlated with higher pollutant concentrations for most indicators,
though a limited number are associated with less-traveled agricultural areas (Kayhanian et.
al. 2003).
The physical connection between an impervious area and proximate urban water
systems also plays a major role in determining the damage done by runoff from that area.
Most studies do not distinguish between impervious area directly linked to water bodies
via an impervious stormwater system and those that may drain to pervious areas (Brabec
et al. 2002). In one case, however, Lee and Heaney (2003) attempted to measure directly
connected impervious area (DCIA) and total impervious area (TIA) and their relative impacts.
Their results indicate that though TIA may cover approximately twice the DCIA area, DCIA
contributes 72% of total runoff volume. In addition, DCIA is the imperviousness responsible
for combined sewer overflows (CSOs), a serious water quality problem. Furthermore,
non-DCIA, the proximity of the impervious area to the water system is crucial. The size of
the riparian buffer between human-intensive land uses and water bodies is a significant
mediator for water quality (Houlahan & Findlay 2004, LeBlanc et. al. 1997). These results
suggest that there is significant need for context-sensitive modeling of the mobilization of
contaminants via imperviousness in models of stormwater runoff.
A complete enumeration of types of impervious surface cannot be obtained by
considering only paved surfaces. Though many measures of imperviousness only consider
building and transportation structures, the infiltration ability of much of the open space in
urbanizing areas has been called into question. Construction activities often compact soil
through grading and the weight of heavy equipment. Landscaping often removes topsoil,
small plants, and trees, causing severe erosion. The open space or lawn remaining after
these activities have ended often produces just as much runoff as paved surfaces in terms of
volume (Schueler, 1995). These surfaces cannot be relied on to provide infiltration services
to a watershed; rather, they must be counted as impervious surface, and the runoff from
these surfaces cannot be assumed to be free from contamination.
In essence, stormwater runoff volumes and chemistry are influenced by the amount
of impervious surface, the use that impervious surface is subject to, and the presence or
absence of the mediating influence of pervious surface. This dynamic is well understood at
the site level. However, at the regional scale, drivers beyond imperviousness that are not
typically associated with water quality may have a major impact on water quality outcomes
through mechanisms that are unregulated and poorly understood. For example, Michael
and information, each of which was associated with different drivers. In the agrarian
phase, land use change was driven by primary productivity of land. Land was developed
if it was productive for farming. In the industrial phase, access to transportation was the
key factor, while in the information phase aesthetics come to the fore. Water quality is not
a consideration in any of these models of land use change, except possibly the last, even
though each model has serious effects on it.
The second implication of the limitations of impervious surface as a measure at the
regional scale is that because the relationship between imperviousness and water quality is
ambiguous at the regional level, it may be a good thing that it is largely unregulated at this
scale. Other measures of urban pattern, such as edge density, road density, and patch size
have been found to be much stronger predictors of water quality (Alberti and Marzluff 2004,
Rogers and DeFee 2005). Therefore, as urbanization increases in a watershed, water quality
is affected by variables at the site and regional level. This suggests that a hierarchical model
considering both scales could contribute to an understanding of threats to water quality.
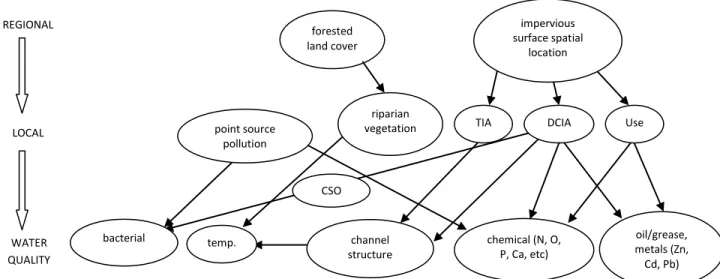
Figure 2 presents a proposed theoretical model of the relationship between urban form and
water quality, considering both scale and linkages.
Figure 2 shows constructs of urban form and how they are connected to water
quality. This figure summarizes key insights of the literature. At the regional level, water
quality is determined by the amount of developed land (impervious surfaces) and the
amount of undeveloped land (natural land cover), and how these two types of land are
arranged spatially. The regional development pattern is the ultimate driver. However,
at a time. Therefore at the local level, the water quality outcome is mediated by whether
the impervious surface is directly connected and what the use of the impervious surface is,
in addition to the quantity of imperviousness. The outcome is also mediated by pervious
riparian areas. Total impervious area (TIA), a directly measurable construct, is just one
aspect of this dynamic. Urban form measures like edge density, road density, and patch
size may approximate or correlate with the construct of directly connected impervious area
(DCIA).
Land use intensity is also a key construct in the relationship between land use
and water quality. This construct is often measured by density. However, there is limited
consensus or hard evidence as to exactly what role density plays in the water quality story.
High-density urban development has long been associated with negative environmental
impacts. Industrialization, with all the point-source pollution inherent in its activities, is
historically highly associated with urbanization. Intuitively to some, development density is
associated with the disappearance of trees, channeling of water into culverts and sewers, REGIONAL LOCAL WATER QUALITY forested land cover point source pollution riparian
vegetation TIA DCIA Use
channel
structure chemical (N, O, P, Ca, etc)
oil/grease, metals (Zn, Cd, Pb) temp. bacterial impervious surface spatial location CSO
and separation from nature by pavement. On the other hand, some planners believe that
conventional low-density development is fundamentally automobile- and thus
pavement-oriented, and that this form of development prioritizes wide roads, parking, and compacted,
landscaped lawns and golf courses over low-impact development principles (Schueler 1995).
Scenario Building
Scenario planning represents the next evolution in planning practice from the
conventional rational comprehensive planning model, as well as a powerful research design
for investigating planning questions. The roots of scenario planning paired with complex
modeling are deep in the transportation planning community, primarily because of the
Federal-aid Highway Act of 1962, which required both alternatives analysis and projections
about how a facility would operate in the future (Bartholomew 2006). Despite its roots,
the use of scenarios appears to have gained increasing acceptance in planning practice
as a different form of rationality that relies on incremental planning (Guhathakurta 1999;
Xiang and Clarke 2003). New applications of scenario planning in regional transportation
planning differ from past alternatives analysis in that the scenarios explore varying future
arrangements of both land use and transportation, rather than assuming a static land use
pattern (Zegras et. al. 2004). Keith Bartholomew recently reviewed 80 American scenario
planning projects from over 50 metropolitan areas, documenting how widespread scenario
planning has become in the US (Bartholomew 2005).
When initiating a scenario planning process, the “alternative futures” process
developed by Carl Steinitz (2003) begins with the question of representation: “how should
planning literature as applied to urban planning, there are three over arching models for
describing urban futures. Abdul Khakee (1991) identifies the first framework as placing the
“emphasis on the physical-spatial,” through maps and descriptions of alternative urban
forms, as embodied by H. Wentworth Eldredge’s work. Khakee proposes an alternative
framework that emphasizes socioeconomic variables, with the scenario planning process
driven by social goals like equity, employment, or conservation. A third framework can
be found in the work of Lewis Mumford (1938). While engaged in the physical-spatial
framework debate of his day, Mumford placed special emphasis on extrapolating the
cultural and political implications of varying urban forms. He was interested what values
different urban form choices represented, and his “Stages of City Development” from The
Culture of Cities traced the moral outcomes of varying manifestations of urbanization. These
frameworks are summarized in Table 1.
In the Eldredge framework, the planning focus is on producing housing and other
infrastructure. Land use issues and comprehensive master planning are dominant. A
scenario planning process in this framework would assume strong economic growth,
because otherwise there would be no need for additional infrastructure and no way to
pay for it. In Khakee’s framework, the planning focus is on dealing with great political and
economic uncertainty, emphasizing plan implementation (the connection between distant
future and short- and medium-term policy) and review. With Mumford, the emphasis is on
the structure of the economy and the planning process, i.e. demarcation of land by role
in the economy, public participation, and regional relationships, all restricted by financial
resources. Correspondingly, there is a different role for urban planners in each model. In the
Eldredge model, planners strive to provide services and achieve system performance goals
based on projections. In the Khakee model planners are facilitators of development, working
to achieve economic and social goals based on analysis of existing human capital and social
infrastructure. Planners potentially have an even grander role in Mumford’s model, where
the goal is to achieve an ethical spatial alignment of the environment, political structures,
and the economy in order to shape culture.
Harold Becker (1983) describes the selection of the representation model simply
as selecting the “basic characteristics,” which are “the few conditions most important to
shaping the system…being studied (p. 100).” The representation is contingent upon our
understanding of the system we are studying. In the case of water quality, do we understand
water quality as primarily an outcome from a physical-spatial system, or is it shaped
by social goals like conservation, or does it vary based on cultural and political climate
(capitalist vs. socialist, etc)? While all three models may offer productive frameworks for
understanding water quality, the literature on water quality as an outcome of the
physical-spatial system is the most fully developed (Brabec et. al. 2002). Therefore, this project
applied the Eldredge model. This implies that the “basic characteristics” as from Becker
will include physical and spatial measures, such as urban form pattern metrics. These
Furthermore, selecting this representation model means that each scenario is visualized as a
spatially explicit map.
In the scenario planning literature, there are a number of common criteria proposed
to define what makes a “good” scenario. The literature consistently emphasizes the
importance of plausibility (Avin and Dembner 2001, Becker 1983, Coates 2000). However,
de Jouvenel (2000) poetically emphasizes that the future is “yet to be created.” It is a realm
of freedom, power, and will, not just probabilities, a realm where there is room for audacity,
creativity, and action. Xiang and Clarke (2003) capture this exciting sense of possibility and
combine it with the plausibility criterion in their concept of plausible unexpectedness. While
scenarios must be believable, they must also challenge the boundaries of belief, or scenario
planning falls into the trap of simply exploring familiar parts of the scenario space over and
over again. Therefore a good scenario set has diversity, inconsistency between scenarios,
and surprise. Within each scenario, the development of a narrative describing the chain of
events that produces the scenario will establish a test of plausibility. Comprehensiveness
also contributes to plausibility; to achieve this, the scenario set as a whole must cover the
range of possible internally consistent instances of the Becker scenario space.
Xiang and Clarke posit two additional criteria: informational vividness and cognitively
ergonomic design (effective and safe). A scenario is vivid when it is “(1) emotionally
interesting, (2) imagery provoking, and (3) proximate in a sensory, spatial, and temporal
way (p. 893).” Urban growth scenarios can be made emotionally interesting by using the
narrative to link each scenario to individual and community values, as well as contemporary
map and a story. Scenarios are proximate when they are based on a real area (as opposed
to a hypothetical one). Extending scenarios very far in the future (for example, to 2050),
however, is a proximity problem. This is a common paradox in applying scenario planning
to regional planning. At this scale, changes in land use, transportation, travel behavior, the
economy, and so forth happen gradually, with substantial shifts only becoming apparent
over decades. However, the scenarios will not be interesting, diverse, or comprehensive if
they do not expand to a time-scale that can illustrate these potential differences. Therefore,
additional effort to make regional planning scenarios proximate in other ways must be
made. With regards to the final criterion, cognitively ergonomic design, scenario sets can
achieve this by restricting the size of the scenario set and identifying each scenario with a
unique theme that does not overlap with other scenarios. A cognitively ergonomic design
should also include an explicit statement of assumptions. This contributes to plausibility, and
avoids creating unrealistic expectations, by explicitly establishing limits.
One point of contention in the literature with regards to “good” scenarios is the
concept of the “surprise-free” scenario. Shearer advocates for the inclusion of an alternative
that embodies “the future that can be anticipated if there are no significant changes.” The
idea is that the surprise-free scenario can function as “a platform” on which “conventional
thinking” and subconscious assumptions can be recognized, serving as a “reference point”
or “baseline” for users who are new to scenario planning (p. 72). On the other side of the
argument, Avin and Dembner argue against ‘straw men’ that are not based on an analysis of
the driving forces in a system. Their essential point is that the relevance of scenario planning
is its special ability to manage uncertainty and rapid change. However, if those two things
A ‘surprise free’ alternative can be distinguished from a mere trends-extrapolation scenario.
This scenario can simply include future changes which are widely expected. In the case
of water quality, the full implementation of Clean Water Act Phase II requirements is an
example of a widely expected change.
This project fully responds to the challenges set by the literature with regards to
creating two scenarios that are first and foremost plausible, based on rich local data and
real, active planning endeavors extant in the study area. This is critical to the face validity of
the research and central to the research motivation. One scenario represents a
“surprise-free” alternative based on the published work of the region’s metropolitan planning agency
and its fiscally constrained long-range transportation plan. The other scenario represents
a more visionary approach to planning for the future of the region, including some more
ambitious changes in land use regulation and transportation infrastructure. Both meet Xiang
and Clarke’s criteria for vividness in that each is both a narrative communicating a specific
perspective on the study area and how to plan for it, and can be visualized as maps of a
variety of different descriptive and outcome variables.
Urban Growth Modeling
Computer simulations are key tools that enable exploration of the behavior of large,
complex systems. Both research scientists and policy makers have long-standing interests
and agendas regarding land use change related to urbanization (Agarwal et. al. 2002). The
prospects of large-scale land use change models and their place in policy have risen, fallen,
and risen again since the advent of computing (Wegener 1994). This review will summarize
structure, implementation, and suitability. There are quite a few more extensive historical
or analytical reviews in the literature (e.g. Agarwal 2002, Berling-Wolff & Wu 2004, EPA
2000); this review will simply outline the major themes and approaches that remain current
in the field, and diagram the advantages and disadvantages of each approach. There are
four major approaches in urban modeling that represent the current frontiers in the field:
hybrid spatial interaction, cellular automata, agent-based, and reduced-form. Each of these
modeling approaches will be discussed in turn.
i. Spatial interaction models
Basic spatial interaction models have the longest history, and are notable for
their effort to integrate land use and transportation. These models are rooted in the
application of Lowry-style gravity models. Models such as DRAM/EMPAL accomplish this
by aggregating space into zones. Each zone contains some amount of households and jobs,
and the interaction between any two zones is a function of the ‘mass’ of the zone and the
connectivity between the two zones. Thus, land use (locations of households and jobs) and
transportation (flows between zones) are modeled simultaneously. This model can then
be used to test the impact of changes to the attractiveness of a given zone or zones (for
example, increased accessibility from a transportation improvement), or the effect of an
exogenous increase in population. This approach assumes equilibrium, in other words that
the supply of locations is able to meet the demands of all existing households and jobs.
Hybrid spatial interaction models improve on the basic approach by incorporating
behavioral and economic theory in addition to gravity theory. Thus, models like TRANUS
models respond to price signals from the land market, which are calculated based on
the relative supply and demand for land in each zone. Demand for land in each zone is in
part a function of the accessibility of the zone. These models are also called spatial
input-output models because they use an input-input-output matrix that is exogenously initialized to
represent the demand relationships between activity sectors. This matrix is then applied
to space by inputting basic, exogenous activities and using the input-output matrix to
impute endogenous (induced) production. The land market is cleared at each iteration by
applying discrete location choice models to the activity sectors. The model achieves market
clearance for all other markets by allowing demand in one zone to be satisfied by production
in another zone, depending on price, for all sectors except land. Tracking these flows
reveals the demand for travel. This establishes an iterative equilibrium between the land
use pattern and transportation flows that further integrates land use and transportation.
TRANUS and MEPLAN are the most widely used and validated of these integrated land
use-transport models internationally, with TRANUS being somewhat easier to calibrate (Hunt
et. al. 2005). The framework and implementation of TRANUS are described by de la Barra
(1989) in detail.
ii. Cellular automata models
Cellular automata (CA) models apply the principles of complexity theory to urban
modeling. The CA approach is based on the idea that cities are unself-conscious, organic
systems composed of modular, hierarchical elements (Batty 2005). Simple rules that govern
local, observable processes explain the emergent, seemingly chaotic and unobservable
patterns and behavior of the total system (Batty & Torrens 2005). A major attraction of CA
to explain. A typical CA model is composed of a grid of cells, each of which has a current
state. There is some finite set of possible states that the cells can exhibit. In addition to
the current state, each cell has some set of characteristics that describe the cell. Simple
transition rules, either deterministic or stochastic, use the characteristics of the cell and the
immediately adjacent neighbor cells to move each cell from state to state. Thus, while the
description and behavior of any one cell is simple, the patterns that emerge through time
from the iterative interactions of each cell with its neighbors can be quite sophisticated.
Depending on the initial state and the transition rules, the system may or may not ever
converge to a steady state; in other words, equilibrium is not an assumption of CA models.
Cellular automata models provide a framework for applying hierarchical patch theory from
landscape ecology to built human systems.
The two most widely used urban development CA models are the Land use
Evaluation and impact Assessment Modeling (LEAM) framework developed at the University
of Illinois Urbana-Champaign (Deal 2001) and the SLEUTH model developed by the USGS
and the University of California, Santa Barbara (Herold et. al. 2003, Jantz et. al. 2003).
In general, there are significant limitations in applying these models to land use change;
namely, it is difficult for a CA model with a finite number of states to represent the full
spectrum of urban form. This is also true because these models, since they are grid-based
and cover large geographic areas, are typically initialized using remote sensing land cover
data (e.g. LANDSAT), which does not distinguish between types of developed land. Therefore
CA models are best suited for studying land cover change, and are significantly less useful in
iii. Agent-based models
Agent-based models represent a significant theoretical advance in the modeling
of land use change. Urbanization in the United States is by and large a process caused by
many separate, distributed individuals making decisions and taking action, only marginally
influenced by central policies. Agent-based models are similar to CA models in that they are
used to model systems that are emergent; in other words, the cumulative product of many
separate, parallel events. There are two basic data structures in an agent-based model. First,
there must be some kind of representation of the ‘space’ in which the agents interact. This
may literally be some explicit representation of physical space, or it may be a representation
of a conceptual space in which agents interact, like a market. Second, the agents themselves
are represented as individual instances that have some characteristics (possibly including a
specific location in the ‘space’), and whose behavior is governed by rules. Each type of agent
has some discrete set of possible actions related to interacting with the ‘space’ and/or with
other agents. These rules will vary based on agent type; however, agents of the same type
can be expected to behave differently at any given time-step because these rules depend in
part on the current characteristics of the individual instance of the agent. Furthermore, the
rules may be stochastic and/or adaptive. The theoretical structure of agent-based models,
comparative strengths, and current research applying these models to land use change have
been discussed by Parker et. al. (2003).
The congruence between agent-based models and the way development actually
occurs in the United States suggests a good fit between the theoretical structure of the
model and, hypothetically, the reality that available data have been measuring. It is for this
extant, has consistently moved towards an agent-based approach with each redesign of
the model. UrbanSim is actually framework that combines several models, including (in
some instances) spatial interaction model for travel demand. However, households, firms,
and developers are all represented as agents in the sub-models of UrbanSim. Thus, they
are modeled separately from the space that they occupy, and their behavior is not solely
determined by the state of that space. Furthermore, for these agents, ‘space’ is represented
using the property parcel as the unit of analysis. This provides a theoretically rigorous
and clear accounting of the agents, markets, and geography that are all involved in the
urbanization process. In this sense, UrbanSim is a “microsimulation,” because it minimizes
aggregation of these conceptual units. This disaggregation has the further advantage of
freeing the model from any requirement to achieve a cross-sectional equilibrium in order
to obtain a solution. Furthermore, this dynamic microsimulation establishes a full range of
feedback between land use and transportation systems. The primary drawback to such an
approach is the monumental amount of data required to initialize and calibrate such a set of
models. While UrbanSim uses an open-source distribution model and a sophisticated GUI to
help minimize the cost (data, labor, etc) of applying the model, it is still infeasible for a single
planner or experimenter to attempt UrbanSim alone. The most recent documentation of
UrbanSim is available online at http://cuspa.washington.edu/. UrbanSim has been described
and reviewed in the literature several times (Hunt 2005, Waddell 2002, Waddell 2003,
Waddell 2007).
iv. Reduced-form models
these models apply the methods of econometrics to estimate multinomial logit models
that predict the likelihood of development for a given site based on a set of independent
variables (e.g. Newburn & Berck 2006, Zhou & Kockelman 2008). While other models use
multinomial logit to model location choice or other variables as part of a more elaborate
modeling framework, this approach is distinct in that the model looks directly at land use
change. Goodness-of-fit and error can be calculated, bringing a level of statistical rigor to
this approach that is not available in any other model type reviewed here. The California
Urban and Biodiversity Analysis Model (CURBA) developed by Landis, et. al. (1998) is a
prominent example representing the application of random utility theory to urbanization.
CURBA and other reduced-form models typically use a grid-based representation of the
landscape, and can thus be paired with CA models in a more complex modeling framework.
The multinomial logit model is conditioned using historical data from two time periods (thus
showing change). The likelihood of development in the future is then estimated for each
cell. However, this probability is only based on the characteristics of that cell. Therefore the
model does not look at development drivers that are not rooted in space, such as household
or employment-based demand for locations.
A major limitation of these models is that while the model may have an excellent fit
for the historic data, applying a strictly empirical model like this to the future depends on
the assumption that change in the future will happen just as it did in the past. In essence,
this is a trend-extrapolation approach that cannot be used to explore multiple scenarios for
future development. There is no feedback in applying the model to multiple timesteps, and
so congestion and crowding externalities are not modeled. Thus, when attempting to use
may be highly dubious. The primary strength of these models is in identifying which specific
areas are likely to undergo land cover change. This is very useful for impact assessments
that are driven by land cover inventory, such as farmland, wetland, or habitat preservation.
Reduced-form models are substantially less useful for predicting land use driven impacts,
such as congestion or impervious surface coverage.
Water Quality Modeling
While impact assessment at the site level is well established, there is growing policy
and research interest in developing models and methods for conducting impact assessment
at larger spatial scales. This practice is already established in transportation planning,
where regional planning is mandated by the federal government. Similarly, in the case
of nonpoint source pollution, growing awareness of the need to understand
watershed-scale impacts, spurred by the requirements of the Clean Water Act, has motivated the
development of computer simulation models to quantify the relationship between land
use and water quality. Various research groups and government agencies have developed
many such models, using a variety of methodologies. The EPA has played a leading role
in coordinating these efforts through the Better Assessment Science Integrating point
and non-point Sources (BASINS) framework. Through BASINS, the EPA seeks to provide
decision support systems for use by states conducting Total Maximum Daily Load (TMDL)
analyses of select constituents. This literature review will compare the theoretical structure,
operational details, and applications of five select hydrologic models, several of which are
included in BASINS. In general, these models were selected for review based on their level
exploring the water quality implications of land use change. Other concerns like climate
change tracking, flood control, and water supply management also motivate some of these
simulations. This review will evaluate each model both in theory and in application with an
emphasis on land use.
The Hydrologic Simulation Program in Fortran (HSPF) is a widely used hydrology
model with water quality submodels that is supported by the EPA. The Soil and Water
Assessment Tool (SWAT), developed by the US Department of Agriculture, is another widely
used watershed simulation with a different theoretical approach. The Long-Term Hydrologic
Impact Assessment (L-THIA) model is theoretically similar to SWAT, but with some different
hydrological assumptions. L-THIA is also fairly simple to calibrate and apply, and is often
used by policy analysts. The Storm Water Management Model (SWMM) was created
around 1970 for the EPA, and has been updated since. This model’s long history makes it
one of the most widely used. In addition, a relatively new Australian system, the Model for
Urban Stormwater Improvement Conceptualization (MUSIC), is included for its original and
contrasting theoretical approach and implementation.
The correlation between human-made land use changes and decreasing water
quality is well established. A simulation model representing this relationship must make
more specific decisions than a regression model about how to represent land use and
how to connect land use to water quality. The land use data requirements, the role of land
use in the model, and the model of hydrology are typically distinguishing characteristics
of a simulation. Watershed hydrology, especially groundwater movement, is a complex
equations. Furthermore, hydrology is challenging to model in that it is essentially a moving
target. Rain falls, groundwater flows, and water evaporates, and a model must somehow
render discrete these continuous movements across a watershed through time. Therefore,
a model relating land use to water quality must contain some simplified representation of
hydrology and time at some geographic scale. Simplifying assumptions about the functions
of the water budget through time have consequences for the geographic appropriateness of
the specific model.
Water quality is a broad concept that can be modeled in a variety of different
ways. Modelers may consider any number of a cornucopia of water quality constituents.
The broad range of quality indicators includes turbidity, levels of nutrients (nitrogen and
phosphorus), measures of oil, grease, and metal particle contamination, bacteria densities,
dissolved oxygen levels, temperature, and biotic measures like fish or microorganism
counts. Each of these contaminants is mobilized by stormwater runoff through land use in a
different way. The many dimensions of water quality are part of the challenge of modeling
the impact of any given source. Each model discussed here has different data requirements,
calibration options, and operational details that factor into how the simulation is run and
what it does. Output, of course, also varies. How the model has been applied and with what
success suggests a set of planning questions that each model is most useful to address.
i. Hydrologic Simulation Program – Fortran (HSPF)
The principles and technical foundations of the HSPF model are described in
Bicknell et al. (2001). Land use categories in HSPF are user-defined, which allows the
However, each category is defined only by percent impervious cover. No other distinguishing
characteristics of land uses are incorporated in the model. A watershed basin is represented
as a collection of internally uniform land segments (with the exception of soil type and
canopy cover), which are pervious land, impervious land, or stream reaches/reservoirs.
A land segment is composed of zones, each of which is a volume of storage, with inflows
and outflows. HSPF is a continuous model, which simulates hydrologic and bio- and
geo-chemical movements and interactions in a timestep of as little as one hour. In other
words, runoff volumes and pollutant loads are tracked using a process-based approach,
rather than empirical estimates. Water quality constituents modeled by HSPF include:
sediment, dissolved oxygen, biochemical oxygen demand (BOD), temperature, pesticides,
fecal coliform, nitrogen, phosphorus, and key biota (phytoplankton and zooplankton). This
comprehensive process-based modeling approach is unique to HSPF.
The operational details of HSPF are complex. A number of supplementary tools have
been developed to assist with developing the necessary configuration to run HSPF, including
the Non-Point Source Model (NPSM), WinHSPF, the HSPF Parameter Database (HSPFParm),
and the HSPF EXP-ert system (HSPEXP) for calibration. The model requires meteorological
and land use/land cover topography as inputs, as well as observed streamflow and water
quality monitoring data for calibration. In spite of this complexity, HSPF has been applied in
a wide variety of studies because of its theoretical completeness. Application of the HSPF
model to the Gwynns Falls watershed in Maryland produced strong results compared to
historic data (Brun & Band 2000). Application to the Polecat Creek watershed in Virginia
indicators (Im et al. 2003). These results suggest that HSPF is a useful and powerful tool for
modeling runoff volumes and water quality in urbanizing watersheds.
ii. Soil and Water Assessment Tool (SWAT)
Since 1998, SWAT has been integrated into the EPA BASINS framework. The behavior
and operation of the SWAT model is detailed in Arnold et al. (1998). In SWAT, a watershed
basin is represented as a grid of cells or subwatersheds. Within each cell, the hydrology, soil,
land use, and topography are assumed to be homogenous. Land use and soil type for each
cell are represented in tandem using the Soil Conservation Service (SCS) curve number (CN)
method, also known as TR-55 (USDA-NRCS 1986). In the CN method, a constant is estimated
for each combination of land use type and soil type, which is then used in a larger equation
to estimate runoff volume. The CNs and the equation that relates them to runoff volume are
empirically derived, based on observations from sample landscapes. The CN representation
captures the variation in evapotranspiration and stormwater runoff generation between
land cover types. The CN method also allows the option of accounting for whether the area
connects to a drainage system, or outlets to pervious area.
Land use is a part of the model only in how the land use, through impervious
area, affects the volume of stormwater runoff. Within water quality, sediment, nitrogen,
phosphorus, and pesticides are all modeled by SWAT. Bacteria transport was added in
2000 (Arnold & Fohrer 2005). However, loads for these constituents are all estimated using
only runoff volume and soil data. The model does include comprehensive submodels to
account for agricultural land management, including tillage, irrigation, fertilizing, pesticide
water budget with precipitation, runoff, evapotranspiration, percolation, and return flow.
SWAT has a sophisticated approach to modeling flows, including separate calculations for
lateral subsurface flow, ground water flow, snow melt, ponds, and channel and reservoir
routing for the sediment and chemical constituents. The model is continuous-time,
operating on a daily time-step, and does not require any calibration from local gauge data
(though it is an option).
The emphasis on fairly large subbasin-cells and agricultural land management
in the SWAT model suggests that this model is most appropriate to simulate the
impact on changing farming practices on water quality in watersheds where land use is
mostly agricultural. In the appropriate setting, SWAT can be a powerful tool, given the
completeness of the model and its minimal data requirements (weather data, soils, CNs,
agricultural practices). Srinivasan et al. (1998) applied SWAT to a watershed in the upper
Trinity River basin in rural north-central Texas. Results for streamflow and sedimentation
were very good, but the chemical constituent submodels were not tested. The advanced
weather model that simulates precipitation events in SWAT has attracted additional research
activity. The model has been successfully applied in several studies of climate change
impacts on water supplies (Hotchkiss et al. 2000; Rosenberg et al. 1999; Stonefelt et al.
2000). Despite these successes, it should be noted that an attempt to apply the SWAT model
to a watershed in southern Illinois yielded very poor results (Muleta & Nicklow 2005). In this
case, the authors cite limited data for verification as a possible explanation for the failure of
the experiment; it is also unclear what the characteristics of the study watershed are, and
iii. Long-Term Hydrologic Impact Assessment (L-THIA)
The L-THIA model is similar to SWAT in that it is also based on the empirical TR-55
curve number method. The emphasis in the development of L-THIA was to produce a simple
model relating land use to water quality that had basic, widely available data requirements
for use by local planners (Harbor 1994). Both web- and GIS-based applications of L-THIA
are freely available. In order to simplify the modeling process, L-THIA makes a number of
additional assumptions beyond those of SWAT. Snowfall is not considered, or the effects
of freezing ground. In addition, antecedent moisture conditions (how wet the watershed
is prior to precipitation) are ignored. These simplifying assumptions limit the power of the
model, but they also make the model easier to apply. A comprehensive list of water quality
constituents are considered in L-THIA. These include nitrogen, phosphorus, suspended
solids, lead, copper, zinc, cadmium, chromium, nickel, pesticides, BOD, chemical oxygen
demand (COD), oil/grease, fecal coliform, and fecal strep. The breadth of useful output
from the model is especially attractive to researchers and decision-makers comparing the
water quality outcomes of alternative development scenarios (Greenberg et al. 2003; Tang
et al. 2005). Since different urban forms may be associated with the production of different
constituents, comparing scenarios across a wide variety of indicators is necessary to obtain a
fair and accurate comparison.
iv. Storm Water Management Model (SWMM)
The Storm Water Management Model (SWMM) was the first urban runoff quality
model (Donigan & Huber 1991). The model’s capabilities and requirements are documented
watershed hydrology. However, SWMM does include a simple hydrology model that includes
precipitation, evaporation, snow, interception, infiltration, percolations, groundwater flow,
and reservoir routing of overland flow. Buildup of pollutants on impervious subcatchments
is simulated, followed by precipitation event-based wash-off and drainage through gutters,
storm drains, and a sewer system (storm sewer, combined sewer, or natural drainage).
Simulations in SWMM can also be run continuously as a repeating cycle of build-up and
wash-off. The Extran Block component of SWMM is a complete set of dynamic flow routing
equations that can model a number of hydraulic phenomena found in sewer system
management like backwater, surcharging, looped sewer connections, and other hydraulic
structures (pumps, weirs, BMPs, etc).
Water quality constituents are user-specified in SWMM. Users input concentrations
for each pollutant in rainfall and groundwater, and a decay coefficient. Land use categories
in SWMM are also user-specified. The rate of build-up of a given constituent is set for each
land use. Note that this allows SWMM to model pollutant contributions from rainfall, as in
“acid rain,” as well as from air deposits on surfaces and soils. Additionally, in this model both
surface runoff volume and constituent concentrations vary by land use. In SWMM, land use
is more than just imperviousness. The model enables users to define their own land use
categories, and the associate these definitions with different relationships to pollutants.
Through subarea routing, the model also distinguishes between directly connected
impervious area and total impervious area. This is a critical difference between SWMM and
In part because of its longevity, SWMM is the most widely used model of its type,
and it has been repeatedly independently validated (Donigan & Huber 1991). The number
of user-defined parameters in SWMM, however, is clearly a roadblock to the model’s
general use. For a catchment with little monitoring, it may be impossible to apply SWMM
without trial-and-error guessing of some parameters. However, a decision support system
incorporating inference models and optimization techniques may be one way to overcome
this obstacle and calibrate SWMM accurately (Choi & Ball 2002).
v. Model for Urban Stormwater Improvement Conceptualization (MUSIC)
The Cooperative Research Centre for Catchment Hydrology of Melbourne, Australia,
released the Model for Urban Stormwater Improvement Conceptualization (MUSIC) for
commercial use in 2003 (CRCCH 2005). Model theory and operation are presented in Wong
et al. (2005). The primary motivation for developing a new model tool was a need to better
simulate the role of stormwater treatment best management practices (BMPs). Through
SWMM can represent some of these measures, others are ignored, such as wetlands.
MUSIC can run as a continuous or event-based simulation, with a user-defined timestep
appropriate to the scale of the simulation. The model can represent a range of scales, from
individual sites to watersheds. MUSIC represents an advance from previous models in that
it incorporates theory of the hydraulics and treatment behavior of stormwater management
measures. MUSIC was designed as a decision support system for catchment managers in
public and private practice. The model uses an icon-driven graphical user interface that
emphasizes ease of use. However, the model is available only by paid license (or limited free