The following is a technical report submitted in partial fulfillment of graduation requirements for a Masters of
Science in Environmental Engineering degree from the Department of Environmental Sciences and Engineering in
the Gillings School of Global Public Health.
Drainage
Options
Assessment
at 203 Cotter
St.
Technical Memorandum
By Imaan Taghavi July 2017
1
Abstract
The road area outside 203 Cotter St., a suburban property in south central San Francisco, CA, has experienced frequent flooding in recent years. A preliminary investigation of the site by the San Francisco Public Utilities Commission (SFPUC), the public utility for the City of San Francisco responsible for mitigation of flooding, attributed the flooding to low elevation and poor grading of the surface. Five technical options were developed: Do Nothing, Green Roofs, Bio-Retention Planter, Easement Pipe, and Detention Tank. Each option was assessed and compared against five criteria: Drainage Performance, Low Financial Cost, Ease of Operation and Maintenance, Minimal Environmental Impact, and Reliability. Each option was represented in an EPA SWMM hydraulic model for assessment of Drainage
2
Acknowledgements
There are many individuals that I am grateful for their contributions to this endeavor. At UNC: Dr. Pete Kolsky, my faculty advisor and mentor, for believing in me throughout every step of the process. This memorandum would be a shadow of what it is without your critique and guidance. Dr. Greg Characklis for giving me a home in his research group my first year at UNC and donating his time to sit on my defense committee. Sally Hoyt, P.E. for donating her time for the same. Dr. Anissa Vines for being so incredibly understanding and flexible during the health crisis that struck in the middle of the journey. Wake Harper and Jack Whaley for being the most genuine and supportive administrators anyone could ask for. All the faculty at the Department of Environmental Science and Engineering and the Gillings School of Global Public Health for curating programs that are propelling future leaders forward to accomplish great things around the world. I hope I can be one such leader. At SFPUC: Nicholas Birth for being both a mentor and a friend giving me encouragement whenever I needed it. Bimayendra (Bimu) Shrestha for being a role model leader and pushing me to always refer to first principles whenever I got lost in the complexities of the model. Also Bassam Aldhafari, Kevin How, David Reyla, and Julio Maravilla in the Department of Public Works for their assistance.
At home: My aunt Vahideh, uncle Farid, and cousin Jasmine for giving me a home away from home in the Bay where I could work from. My mother, father, and brother Ehsan for being my rocks, especially as I went through my lung cancer diagnosis and surgery in the middle of the masters process. It was one of the most difficult moments in my life, and I managed to come out of it and finish this MSEE because they believed in and supported me.
3
Table of Contents
Abstract ... 1
Acknowledgements ... 2
Table of Contents ... 3
Table of Figures ... 5
Chapter 1: Introduction ... 7
Chapter 2: Problem Identification ... 8
2.1 Introduction ... 8
2.2 Flooding in San Francisco ... 8
2.3 Flood Assessment Methodology ... 9
2.4 Project Site Background ... 10
2.5 Evidence of Site Flooding ... 13
2.6 Easement Assessment ... 17
2.7 Model Background ... 19
2.8 Inflow Hydrograph Assessment ... 22
2.9 Rainfall and Infiltration Assessment ... 23
2.10 Outflow Level Assessment ... 25
2.11 Model Assumptions ... 26
2.12 Local System Model Assessment ... 27
2.13 Sensitivity Analyses ... 29
2.14 Option Rating Methodology ... 31
Chapter 3: Options Assessment ... 33
3.1 Introduction ... 33
3.2 Option 1: Do Nothing ... 33
3.3 Option 2: Green Roof ... 35
3.4 Option 3: Bio-Retention Planters ... 37
3.5 Option 4: Easement Pipe ... 39
3.6 Option 5: Detention Tank ... 44
3.7 Option 6: Fill ... 52
3.8 Recommended Option ... 54
4
4.1 Introduction ... 55
4.2 Location Consideration ... 55
4.3 Construction Considerations ... 56
4.4 Environmental Considerations ... 56
4.3 Scheduling Considerations ... 58
4.4 Costing Considerations ... 58
Chapter 5: Conclusion ... 59
Appendix ... 60
5
Table of Figures
Figure 1: Images of Flooding in San Francisco ... 9
Figure 2: 203 Cotter Street Macro to Micro View (Bulletin No. 4) ... 10
Figure 3: 203 Cotter Street Google Street View ... 11
Figure 4: 203 Cotter Street Zillow Cost Map (203 Cotter St. #V, San Francisco CA 94112) ... 11
Figure 5: Landscape Concept Design for Golden Bridges School at Project Site (Campus Design for 203 Cotter Street) ... 12
Figure 6: 203 Cotter St. in Islais Creekbed (Islais Creek Watershed Map) ... 14
Figure 7: Ground Elevations on Cotter St. (Taghavi, Preliminary Review of 203 Cotter Development) .... 14
Figure 8: Cotter St. Lidar Map w/ Surface Water Flow (Taghavi, Preliminary Review of 203 Cotter Development) ... 15
Figure 9: Cotter St. 100 Year InfoWorks ICM Floodmap (Taghavi, Preliminary Review of 203 Cotter Development) ... 16
Figure 10: 5-Year Storm Simulation at Project Site (Taghavi, EPA SWMM Model of 203 Cotter Street) ... 17
Figure 11: Easement Google Earth Image (Shrestha) ... 18
Figure 12: Easement Photos from Various Angles (Shrestha) ... 18
Figure 13: Cayuga Watershed SWMM Model ... 20
Figure 14: Cayuga Model Inflow Hydrographs (Birth) ... 22
Figure 15: Rainfall Intensity Curves (Birth) ... 23
Figure 16: Model Outflow Levels (Birth) ... 25
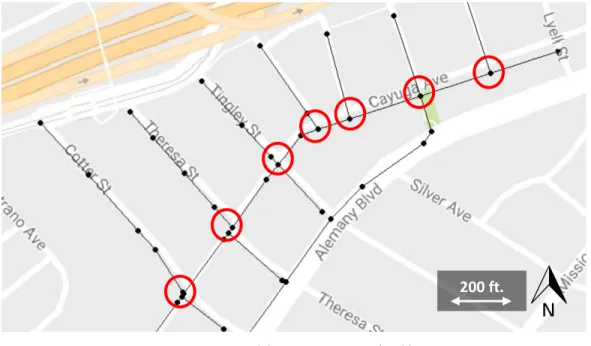
Figure 17: Model Exit Loss Locations (Birth) ... 27
Figure 18: Cotter System Catchment in SWMM Model (Birth) ... 28
Figure 19: Cotter System 100-Year Boundary Head ... 29
Figure 20: Alternative Rainfall Intensity Curve ... 30
Figure 21: 100-year Project Site Base Flooding Conditions ... 33
Figure 22: SWMM Green Roof Schematic ... 35
Figure 23: SWMM Bio-Retention Planter Schematic ... 37
Figure 24: Easement Pipe Option Plan View ... 39
Figure 25: Easement Pipe Option in SWMM Model ... 41
Figure 26: SWMM Easement Pipe Profile View ... 41
6
Figure 28: Online and Offline Detention Systems (On-Site Stormwater Detention Tank Systems) ... 45
Figure 29: V-Notch Weir Manhole Image (Google Images) ... 46
Figure 30: Model Weir Schematic ... 46
Figure 31: Flapgate Image ... 47
Figure 32: Detention Tank Option Schematic ... 48
Figure 33: Detention Tank Option in SWMM Model ... 49
Figure 34: Detention Tank Hydraulic Profile ... 50
Figure 35: Detention Tank Head and Flooding Profiles ... 50
Figure 36: Fill Option Example Image ... 52
Figure 37: Detention Tank Design Location ... 55
Figure 38: Open Trench Installation Reinforced Concrete Box Structure ... 56
Figure 39: Full Detention Tank Schematic ... 62
Table 1: Horton Infiltration Summary ... 24
Table 2: Design Storm Sensitivity Analysis on Project Site Flooding ... 30
Table 3: Impervious Percent Sensitivity Analysis on Project Site Flooding... 31
Table 4: Easement Pipe Option Slope Calculation ... 40
Table 5: Easement Pipe Option Drainage Summary ... 42
Table 6: Weir Inputs ... 47
Table 7: Detention Tank Inputs ... 48
Table 8: Outlet Pipe Inputs ... 49
Table 9: Detention Tank Initial Costing Breakdown... 51
Table 10: Fill Option Drainage Performance ... 53
Table 11: Detention Tank Initial Costing Breakdown... 53
Table 12: Option Rating Summary ... 54
Table 13: Proposed Schedule ... 58
Table 14: Detention Tank Detailed Costing Breakdown ... 58
Table 15: Green Roof Model Inputs ... 60
7
Chapter 1: Introduction
The City of San Francisco is prone to flooding during heavy rainfall. The road area outside the suburban property of 203 Cotter St. has experienced particularly frequent flooding due to low elevation and poor grading. In response, the San Francisco Public Utilities Commission (SFPUC) has been in search of interventions to mitigate the flooding at this site.
In Chapter 2: Problem Identification, the characteristics of this flooding problem at 203 Cotter St. were identified using historical, topographical, and hydraulic modeling data. The characteristics of the hydraulic model were established, and a qualitative ranking approach was identified for comparing the effectiveness of different options for engineering intervention.
In Chapter 3: Options Assessment, each option was examined using the established hydraulic model and ranked against each other with relevant qualitative justification. The detention tank was selected as the primary option for implementation by SFPUC with green roofs and bio-retention planters being selected as secondary options to be implemented by the Golden Bridges School that is being constructed at the project site in 2018.
In Chapter 4: Implementation Plan, the implementation of the detention tank was reviewed in detail. Aspects of the implementation were considered including location, construction, environmental impacts, costing, and scheduling.
8
Chapter 2: Problem Identification
2.1 Introduction
San Francisco is situated on the northern end of a narrow peninsula between the Pacific Ocean on the west and the San Francisco Bay estuary on the north and east. The San Francisco Public Utilities Commission (SFPUC) maintains oversight of municipal activities for the roughly 850,000 residents of the city (Quickfacts). San Francisco has a combined sewer system that collects sewage and stormwater in the same network of pipes. The combined wastewater flow capacity in the sewers is 85 million gallons per day (MGD) and any flow that exceeds this capacity becomes combined sewer overflow (CSO)
discharged without treatment into the San Francisco Bay and ocean (Edgarton). Sewer system overflows and backups into residences and businesses can occur when a part of the system is overloaded. This typically is caused by blockages from fats, oils, and greases (FOG) and/or hydraulic inadequacy of the sewer system to handle the runoff that is more than capacity (Technical Memorandum No. 405).
The road area outside of 203 Cotter Street, a private empty suburban property in south central San Francisco, has experienced frequent flooding in recent years. Preliminary investigations of the suburban area by SFPUC suggested several possible contributing factors including low elevation and poor road grading (Taghavi, Preliminary Review of 203 Cotter Development). This investigation will explore these and other factors using guidelines prescribed by SFPUC to determine if a flooding problem exists at the project site.
2.2 Flooding in San Francisco
9
Figure 1: Images of Flooding in San Francisco
San Francisco has seen serious flooding from large rain events in recent years which are shown in Figure 1. In response, SFPUC recently initiated a flood resilience study. Flood resilience is defined as “the capacity to anticipate risk, limit impact, and recover quickly when damage occurs from flooding events” (Flood Resilience Report: Task Order 57). This technical memorandum will assess drainage options to mitigate flooding at the project site of 203 Cotter Street in accordance with the goals of the flood resilience study and SFPUC at large.
2.3 Flood Assessment Methodology
SFPUC assesses any proposed option for its ability to address flooding in a variety of design storms. SFPUC’s current design storm is the “5-year 3-hour storm” which is a storm of a magnitude that has a 1 in 5 or 20% likelihood of occurring in a given year with a duration of 3 hours. This storm is also called the “level of service” or LOS storm, which is the criteria that reflects the level of public protection (service) afforded by SFPUC. SFPUC also requires evaluation of the 100-year 3-hour storm which is a storm of a magnitude that has a 1 in 100 or 1% likelihood of occurring in a given year and a duration of 3 hours. Storms are all assumed to have a duration of 3 hours per SFPUC recommendation (Flood
Resilience Report: Task Order 57).
For SFPUC, there are two drainage requirements that should both be met when considering if a site has adequate drainage potential:
1. No flooding during the 100-year storm
2. 4 feet of freeboard during the LOS (5 year) storm.
10
2.4 Project Site Background
Figure 2: 203 Cotter Street Macro to Micro View (Bulletin No. 4)
2 mi
500 ft 200 ft
Map Data 2016 Google Source: Bulletin 4
11
Figure 3: 203 Cotter Street Google Street View
Figure 4: 203 Cotter Street Zillow Cost Map (203 Cotter St. #V, San Francisco CA 94112)
203 Cotter Street is an approximately 31,000 square feet (0.71 acres) private lot property in a suburban neighborhood that lies near the intersection of Cotter St. and Cayuga St. south of Southern Highway 280 in Mission Terrace.
Figure 2 show 203 Cotter St. on the SFPUC Bulletin 4 map and with aerial imaging. Region 2 (solid line polygon) in the aerial image in the bottom left represents 203 Cotter St.’s property. Region 1 (dotted white polygon) in the aerial image and blue polygons in the Bulletin 4 maps represent “blocks of
100 ft
12
interest” (BOI) classified by SFPUC for their susceptibility to flooding. One such BOI borders the site property. Figure 3 shows a Google street view of the property. The red arrow in the aerial image of Figure 2 corresponds to the location and direction of the view in Figure 3 also highlighted by a red arrow.
The property is roughly 0.71 acres and has an estimated value of about $1.3M. Figure 4 shows the value highlighted in white relative to properties nearby from Zillow (203 Cotter St. #V, San Francisco CA 94112). This is a relatively high income community for San Francisco.
The Golden Bridges School Proposal
Figure 5: Landscape Concept Design for Golden Bridges School at Project Site (Campus Design for 203 Cotter Street)
The site is currently used for Little City Gardens, a working urban farm that contains a
greenhouse and two storage sheds (Elliot; About). The site is also the target for a proposal to build the Golden Bridges School, a K-8 grade school campus whose Landscape Concept Design can be seen in Figure 5 (Washington). This proposal is controversial as Little City Gardens, which is the only commercial urban farm in San Francisco, would be evicted (Committee).
The Golden Bridges school is currently in the approval process for building permits which they hope to complete in the coming months so they may begin construction between Spring 2018 and Summer of 2019 (Campus Design for 203 Cotter Street). Their initial proposal in 2014 suggested they would construct on 12,000 ft.2 of the 0.71 acres (30,900 ft.2) property (Washington). On their website,
they most recently advertised that “74% of property remains open space, not including green roofs” (Campus Design for 203 Cotter Street) meaning 26% or roughly 8,000 ft.2 will be for “institutional uses”
(Washington). Any construction project using more than 5,000 ft.2 of ground surface is subject to
13
SFPUC’s stormwater management requirements as outlined in the Stormwater Design Guidelines (Stormwater Design Guidelines). Projects that trigger the stormwater management requirements must prepare a Stormwater Control Plan demonstrating a reduction in total volume and peak flow rate of any added stormwater for areas in combined sewer systems (Washington).
To assist in meeting the drainage requirements, Golden Bridges School may incorporate Low Impact Design or LID including green roofs and bio-retention planters, which promote ecological and landscaped-based systems to manage stormwater. LID aims to minimally alter drainage patterns by increasing retention, detention, infiltration, and treatment of stormwater runoff onsite. This is a decentralized approach that allows greater adaptability and higher use for stormwater (Stormwater Design Guidelines).
On their website, Golden Bridges School claims to be “committed to exploring every reasonable option to help reduce runoff from site” (Campus Design for 203 Cotter Street). They advertise the implementation of green roof technology and bio-retention planters in their design (Campus Design for 203 Cotter Street). As such, these two LID technologies will be evaluated as options in the options assessment of this technical memorandum.
2.5 Evidence of Site Flooding
There is a variety of evidence suggesting a flood problem at 203 Cotter St.
Historic Creekbed at Project Site
14
Figure 6: 203 Cotter St. in Islais Creekbed (Islais Creek Watershed Map)
Figure 6 shows how the property of 203 Cotter Street (circled in red) lies within the historic Islais Creekbed, which is an indication of higher flooding potential due to low relative elevation that
commonly exist for properties in creekbeds.
Relative Minimum at Project Site
Figure 7: Ground Elevations on Cotter St. (Taghavi, Preliminary Review of 203 Cotter Development)
Figure 7 portrays ground elevations of importance at various points along Cotter St. The datum for these elevations is the San Francisco City Datum which is 8.616 ft. above the mean sea level (Datum Planes). There is an inlet at the project site whose elevation (110.6 ft.) is at a relative minimum. This goes against the SFPUC road design recommendation which is to have relative extrema at intersections (Shrestha). Both experience and initial modeling show that a relative minimum at the project site drain contributes to increased likelihood of temporary ponding and flooding.
15
Basin Characteristics at Project Site
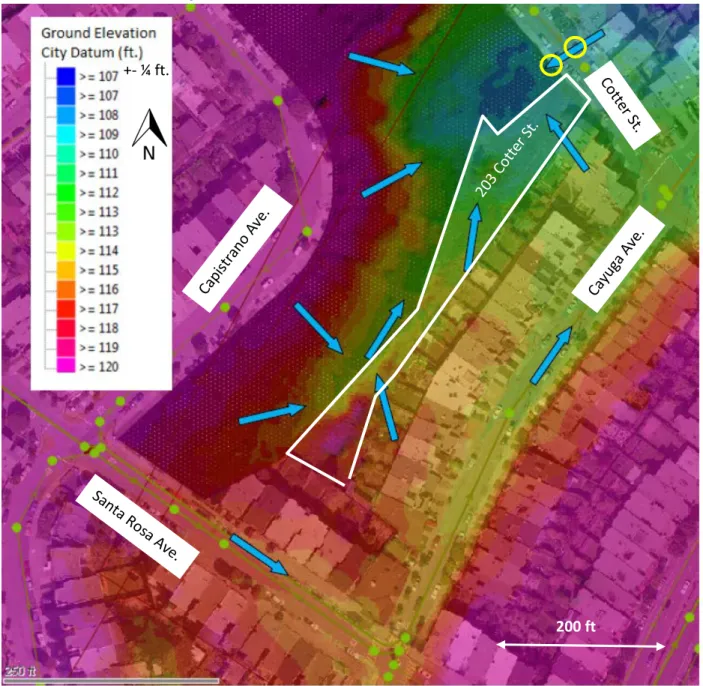
Figure 8: Cotter St. Lidar Map w/ Surface Water Flow (Taghavi, Preliminary Review of 203 Cotter Development)
This elevation change is shown in more detail in Figure 8. The white polygon represents 203 Cotter St. The blue arrows point in the direction of surface water flow. The low point is in dark blue at the northern end of 203 Cotter St. Per SFPUC models, the surface catchment area that flows to the street side drains at 203 Cotter St. (circled in yellow) is roughly 0.98 acres and includes the property of 203 Cotter St. (0.71 acres) as well as the backyards of various nearby properties and properties across the street (Birth). Subsequently, the site acts as a basin collecting surface water runoff leaving it susceptible to flooding (Taghavi, Preliminary Review of 203 Cotter Development).
+- ¼ ft.
16
Preliminary Flood Modeling of Project Site
Figure 9: Cotter St. 100 Year InfoWorks ICM Floodmap (Taghavi, Preliminary Review of 203 Cotter Development)
Figure 9 is an image from a model simulation of the design 100-year storm with a duration of 3 hours at the project site. The source of the model results is the Flood Resilience Baseline 100-year storm dynamic simulation in InfoWorks ICM performed by SFPUC (Birth). The area of lowest elevation on 203 Cotter St. bordering Cotter St. is circled in red. As can be observed, water levels rise above ground level by more than 1 ft. at 203 Cotter St. during the 100-year storm which breaks the first drainage
requirement discussed in Section 2.3.
17
Figure 10: 5-Year Storm Simulation at Project Site (Taghavi, EPA SWMM Model of 203 Cotter Street)
Figure 10 shows the water profile at the peak during the LOS storm with the red bracket
indicating the freeboard present (~6 ft.) present at the project site. The source of the profile results is an EPA SWMM simulation of the project site by SFPUC (Taghavi, EPA SWMM Model of 203 Cotter Street). The freeboard exceeds the 4-ft. requirement and as such, the LOS storm and freeboard requirement need not be the focus for the options assessment of this technical memorandum; the avoidance of flooding during the 100-yr event is the critical performance requirement.
Evidence strongly suggests that there is a flooding problem that should be mitigated at 203 Cotter St.
2.6 Easement Assessment
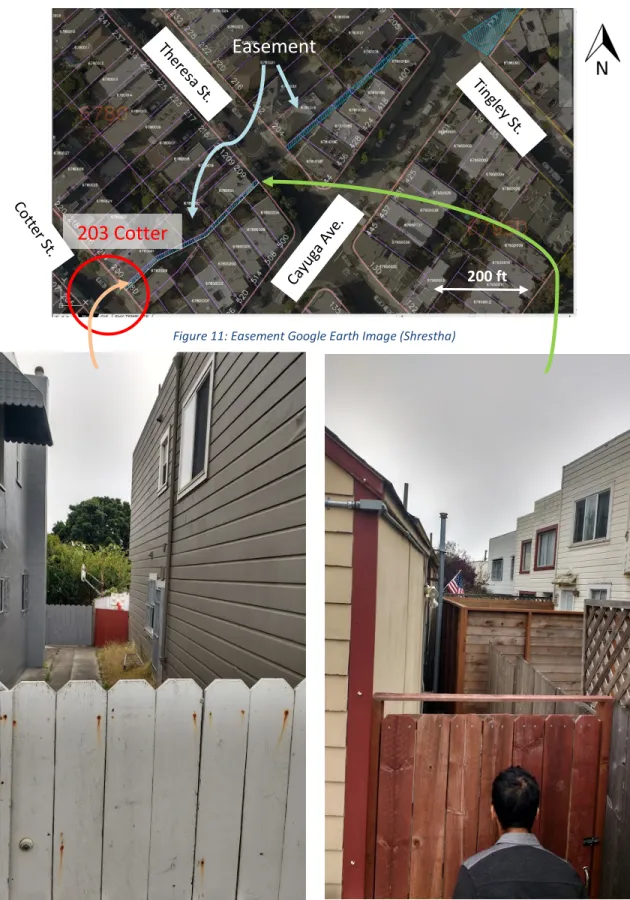
An easement is the non-possessory right to use and/or enter onto the real property of another without possessing it (Easement).The City of San Francisco has many easements across the City, one of which exists adjacent to 203 Cotter St. Figure 11 shows the easement in blue shading extending northeast from 203 Cotter St. which is circled in red. Figure 12 is a series of photographs taken of the easement from Cotter St. and Theresa St. each corresponding to one of those locations as designated by the orange and green arrows. From visual on-site assessments, the easement is roughly 4 feet in width on average. The actual width may be larger as encroachment is a common occurrence. Use of the easement to reroute flooding will be evaluated during the options assessment of this technical memorandum.
18
Figure 11: Easement Google Earth Image (Shrestha)
Figure 12: Easement Photos from Various Angles (Shrestha)
200 ft
Easement
19
2.7 Model Background
Floods are commonly modeled to develop an understanding of the hydraulic characteristics and options for mitigation. A hydraulic model was established with EPA SWMM to inform and guide the options assessment and implementation presented in this technical memorandum.
The Stormwater Management Model (SWMM) is a dynamic rainfall-runoff and hydraulic simulation model software created by the U.S. Environmental Protection Agency that can model single event and long term simulation of quantity and quality of water in primarily urban areas (Storm Water Management Model Reference Manual: Volume I - Hydrology). For any hydraulic model, there are a set of assumptions that simplify real world hydraulic phenomena to a level that the model can feasibly calculate with.
In SWMM, junctions of interest (e.g. catchment basins, storage tanks, etc.) are represented by nodes, and conduits carrying water (e.g. pipes, channels, etc.) are represented by links between nodes. The model uses the principles of conservation of mass and momentum to establish singular water levels, velocities, and flow rates at the cross-section of each pipe link and node in the network. The model also can represent hydraulic “features” of the system (e.g. weirs, bridges, sluice gates, outflows, etc.) and their effects on hydraulic characteristics (Wicks).
20
Figure 13: Cayuga Watershed SWMM Model
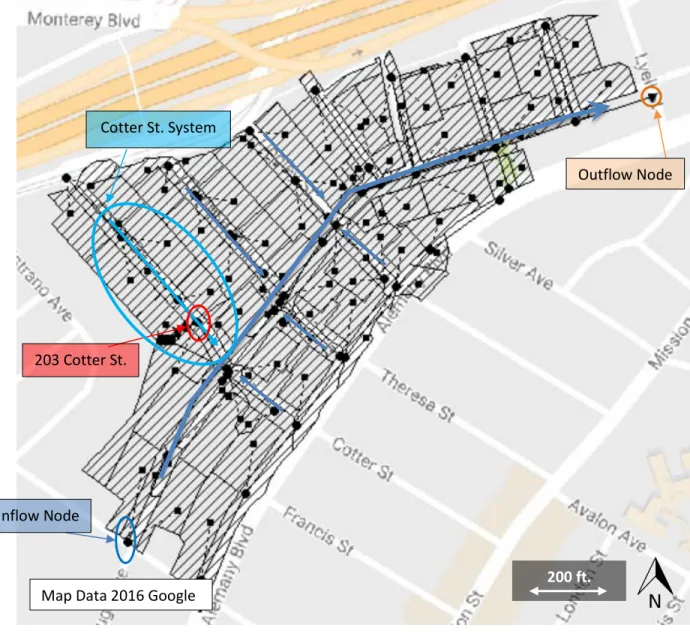
SWMM will be used for hydraulic modeling of the Cotter St. system and flood mitigation options for this technical memorandum. Data and an initial model of the local watershed including Cayuga Ave. were obtained from SFPUC’s InfoWorks ICM model and imported into EPA SWMM. In this model, the watershed has an inflow node where flows from upstream watersheds enter, an outflow node with flow boundary conditions from downstream watersheds, and sub-catchments that receive precipitation to generate and route runoff into the conveyance system. This routing uses the Horton infiltration methodology and a standard SWMM non-linear reservoir modeling methodology which includes principles of conservation of mass, idealized partitioning of sub-catchments into pervious and impervious areas, and a fifth-order Runge-Kutta integration routine with adaptive step size control. (Storm Water Management Model Reference Manual: Volume I - Hydrology). Figure 13 shows a
Map Data 2016 Google 200 ft.
Inflow Node 203 Cotter St.
21
screenshot of this SWMM model that includes the drain at 203 Cotter St. (circled in red) and the local watershed.
The local watershed model has the following characteristics:
• Junction Nodes: There are 43 total junction nodes with depths ranging from 5-16 feet and a mean of 10.7 feet from ground level.
• Sub-catchments: There are 91 total sub-catchments (shaded with parallel black line patterns in Figure 13 with areas ranging from 0.02-0.9 acres, a mean of 0.3 acres, and a total catchment area of 27.54 acres.
o Impervious Sub-Areas: sub-catchments have impervious sub-areas ranging from 49-83%
and a mean of 50% of the sub-catchment area.
o Sub-catchment Slope: sub-catchments have slopes ranging from 2.85-20% and a mean
of 7.78%.
• Conduits: There are 43 conduits with lengths ranging from 8.5-302 ft. and a mean of 170.7 ft.
o Conduit Diameter: Conduits in the system range in diameter from 0.67-8.5 ft. with a
mean of 3.5 ft.
The large blue line going through Figure 13 shows the direction of flow through the 8-8.5 ft. main pipe in the system that follows Cayuga Blvd. This main pipe collects flows from intersecting streets (smaller blue arrows) which include the Cotter St. system until it reaches the outflow node (I.D. 359746) circled in orange.
22
2.8 Inflow Hydrograph Assessment
Figure 14: Cayuga Model Inflow Hydrographs (Birth)
A flood assessment must consider inflows from upstream basins. Figure 14 is a collection of hydrographs, or graphs showing rate of flow past a point in a system versus time, generated for the LOS and 100-year design storms for the inflow node (I.D. 80185) which is circled in blue in Figure 13 (Flood Resilience Report: Task Order 57). The main pipe at Cayuga Ave. is 8-8.5 ft. in diameter. The project site lies in the Cotter St. system which is adjacent to the Cayuga Ave. system that is carrying the flow from these hydrographs.
These hydrographs will be used to establish outflow parameters for the Cotter St. system (which contains the project site) at the intersection of Cotter St. and Cayuga St.
0 100 200 300 400 500 600 700
0.0 0.5 1.0 1.5 2.0 2.5 3.0
Inf
lo
w
(M
GD
)
Time Passed (hr)
Cayuga Model Inflow Hydrographs
23
2.9 Rainfall and Infiltration Assessment
Rainfall AssessmentFigure 15: Rainfall Intensity Curves (Birth)
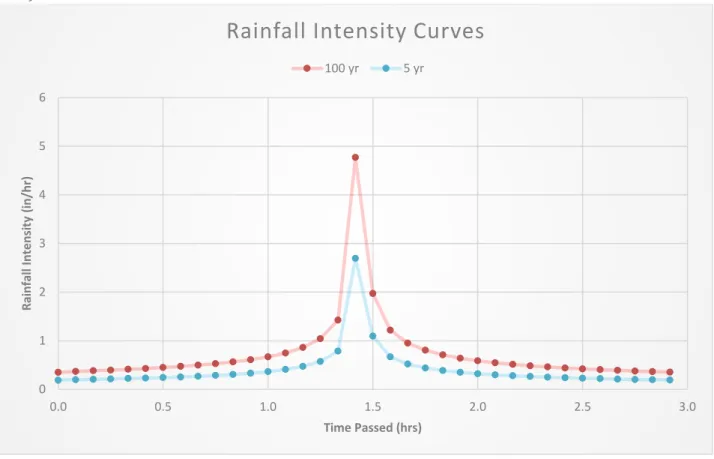
Rainfall data for the 203 Cotter St. site was collected from the SFPUC InfoWorks model and is sourced from NOAA Atlas 14 (Shrestha). Figure 15 presents the rainfall intensity, or the rate at which rainfall occurs per unit time (e.g. in./hr.), over the course of 3 hours for the LOS and 100-year storm. They are derived from design storms that were estimated in 1941 and have been used by SFPUC for many years since (Flood Resilience Report: Task Order 57).
The rainfall data will be assigned to each sub-catchment in the SWMM model.
Infiltration Assessment
SWMM offers a variety of choices for modelinginfiltration. The “Classical Horton Method” is SFPUC’s standard large model method and was selected for this analysis. This method is based on empirical observations showing that infiltration decreases exponentially from an initial maximum rate to a minimum rate over the course of a rainfall event. The required input parameters include maximum and minimum infiltration rates, a decay coefficient that describes how quickly the rate decreases, and the time it takes for a fully saturated soil to become completely dry after the storm (Infiltration). The input values for these input parameters were imported from the SFPUC model and are reported in Table
0 1 2 3 4 5 6
0.0 0.5 1.0 1.5 2.0 2.5 3.0
Ra in fa ll I nt en sit y ( in /h r)
Time Passed (hrs)
Rainfall Intensity Curves
24
1 (Birth). A sensitivity analysis was performed for each input parameter by multiplying the initial value by a “multiply factor” and observing how much this reduced flood volume. It can be observed that flood volume is most sensitive to the minimum and maximum infiltration rates. It is important to note that if SFPUC’s imported rates are more conservative than actual rates, the actual flood volume may be less than what the model has suggested.
TABLE 1: HORTON INFILTRATION SUMMARY
INPUT PARAMETERS Sensitivity Analysis
TYPE Value Units Multiply Factor Flood Reduction
MAX. INFIL. RATE 0.5-0.6 in/hr 2 40%
MIN. INFIL. RATE 0.15-0.2 in/hr 2 47%
DECAY CONSTANT 2 1/hr 0.5 27%
DRYING TIME 3.26 days 2 0%
Runoff Routing Assessment
SWMM conceptualizes the sub-catchment as a rectangular surface of uniform slope and width draining to a single outlet channel. Overland flow is generated from rainfall data as a nonlinear
reservoir.
Principles of conservation of mass are used in the above Equation to relate the rate of rainfall
�𝜕𝜕𝜕𝜕𝜕𝜕𝜕𝜕� and snowmelt (i), evaporation rate (e), infiltration rate (f), and the runoff rate (q). Assuming uniformity in the sub-catchment, the Manning Equation is used to estimate the depth and velocity of flow in the catchment for given rates of runoff. The rate of infiltration is also adjusted based on a user-inputted percentage of the sub-catchment that is pervious vs. impervious. A separate time step is also user-inputted for wet and dry conditions.
25
2.10 Outflow Level Assessment
Figure 16: Model Outflow Levels (Birth)
The Energy and Hydraulic Grade Lines at the outlet of the Cayuga model are determined by the downstream conditions. During each storm and at each time step there is a defined level at the outflow depicted in Figure 16 which acts as a constraint for the model and accounts for hydraulic head or pressure from downstream phenomena. The outflow levels are assigned to Node 359746 which is circled in orange in Figure 13. This outflow will help define initial conditions in the local watershed to assist in characterizing and modeling the Cotter St. system and in assessing options to mitigate flooding at 203 Cotter St.
The large discrepancy between the LOS and 100-year outfall values during the 1.5-2.5 hour segment of the storms may likely be caused by bottlenecks downstream during the 100-year storm that are non-existent during the LOS storm. The higher the outfall head is, the more likelihood of ponding and flooding occurring upstream in the Cayuga Ave. and Cotter St. systems. This is obviously the case as can be observed by the discrepancy between the freeboard during the LOS storm (as depicted in Figure 10) and the flooding that occurs during 100-year storm as depicted by Figure 9.
The downstream conditions that contribute to these outfall levels are worth investigation as their mitigation may sufficiently reduce flooding at the project site to meet the drainage requirement. This, however, remains out of the scope of the analysis of this technical memorandum.
84 86 88 90 92 94 96 98 100
0.0 0.5 1.0 1.5 2.0 2.5 3.0
He
ad
(f
t.)
Time Passed (hr)
Cayuga Model Outflow Levels
26
2.11 Model Assumptions
Negligible Dry Weather FlowAlthough hydrograph and rainfall data were provided by SFPUC, certain additional assumptions were needed to be made. The first was an estimation and incorporation of existing dry weather flows from water usage from local property. This was done using the following formula:
𝐷𝐷𝐷𝐷𝐷𝐷 =𝐻𝐻 ∗ 𝐷𝐷 ∗ 𝑋𝑋𝑁𝑁
Where DWF = Average Dry Weather Flow allocated to a node in the model (gal/day/node), H = Total number of households in the local model (households), D = average population density per household (person/household), X = average per capita water usage (gal/person/day), and N = nodes in the local system (nodes) (Wastewater Flow Estimation and Servicing Guidelines).
The number of households in the local Cotter St. system is ~41. The average population density factor is 2.9 persons/household (Lofquist). The average water usage is 50.62 gal/person/day (KPCC). There are 5 nodes in the system. With these values, the average DWF allocated to each node should be ~1,200 gal/day or 0.001 MGD.
This value is still several orders of magnitude below that of the wet weather flows experienced in the system during the 5-year storm from either rainfall or hydrograph data. As such, DWF can be assumed to be negligible for the wet weather calculations relevant to this analysis.
Accounting for Minor Losses
A minor loss is a loss in hydraulic head in a pipe system resulting from changes in geometry or component configurations (Anderson). The head loss due to minor losses is calculated by the following equation:
ℎ𝑚𝑚= � 𝐾𝐾𝐿𝐿𝑉𝑉 2
2𝑔𝑔
Where ℎ𝑚𝑚is the total head loss (ft.), 𝐾𝐾𝐿𝐿is the minor loss coefficient that varies based on the type
of minor loss (unitless), 𝑉𝑉 is the velocity in the pipe (ft./s), and 𝑔𝑔 is the acceleration of gravity (ft./s2)
27
Figure 17: Model Exit Loss Locations (Birth)
The Infoworks ICM model from which the data for this EPA SMWM model was built from accounts for minor losses with a high level of complexity not possible in SWMM. As such, the SWMM model requires manual input of minor losses when applicable. In the model for this technical
memorandum, each minor pipe flowing into the 8-ft. main pipe (was assigned a standard tee with through-flow exit loss (K=0.26 for 12-16 in. diameter pipes) (Pumps). These locations are circled in red in Figure 17. It is assumed that any other minor losses from bends in any piping are negligible as the bends are less than 45 degrees which have respectively low K values.
2.12 Local System Model Assessment
The inflow hydrograph, rainfall, and outflow boundary data provided affect the larger Cayuga system encompassed by the model provided. To assess flood mitigation at the 203 Cotter St. site, the characteristics of the Cotter St. system must be considered separately because it accounts for the local inflows that also contribute to the project site flooding.
28
Figure 18: Cotter System Catchment in SWMM Model (Birth)
Inflows to the Cotter St sub-system are all local and modeled by sub-catchments in the SWMM model; There is no need for upstream hydrographs to model inflows from outer areas through the drains. The rainfall contribution is determined through the assignment of the rainfall intensity curves shown in Figure 15 to the local sub-catchments. There are two sub-catchments circled in purple Figure 18 that are assigned to the 203 Cotter St. drain are 0.87 (which includes the project site property) and 0.11 acres (which includes properties across the street) in size (0.98 acres total). The total
sub-catchment area for the Cotter St. system (203 Cotter St. and everything upstream) is roughly 4 acres. The sewer pipe in the Cotter St. system begins with a 12 in. diameter until the first drain upstream from 203 Cotter St. with an orange crossing line in Figure 18. At this point, the diameter expands to 15 in.
203 Cotter Sub-Catchments
29
Figure 19: Cotter System 100-Year Boundary Head
The boundary head for the Cotter St. catchment basin is set by the node at the end of Cotter St. where it intersects Cayuga Ave. circled in green in Figure 18. It is important to note that the hydraulic head here is ~110.1 ft. during the 100-year storm. This is half a foot less than the ground level of 110.6 ft. at the project site as depicted in Figure 19. This suggests that there is half a foot of available head between the critical inlet in the catchment and the discharge node ~200 ft. away, and a hydraulic gradient of 0.003.
2.13 Sensitivity Analyses
A sensitivity analysis is a study of how the uncertainty of an output of a system is allocated to uncertainty in its inputs (Saltelli). In the case of the hydraulic analysis of this technical memorandum, there are two elements of concern for a sensitivity analysis: the shape of the rainfall intensity curves and the infiltration parameters.
Rainfall Intensity Sensitivity
The design storms provided by SFPUC show concentrated peak intensities of rainfall in two adjacent five minute intervals, as shown in Figure 15. There will likely be more than one inflection point during such a storm and this could potentially worsen the behavior of a system as complex as the Cayuga Ave. system.
203 Cotter St. Ground Level (110.6 ft.)
30
Figure 20: Alternative Rainfall Intensity Curve
A second 100-year storm was created by averaging every 10 minutes as is depicted in Figure 20. The peak of the storm was reduced while the total rainfall (the integral of each curve) remained
identical.
TABLE 2: DESIGN STORM SENSITIVITY ANALYSIS ON PROJECT SITE FLOODING
STORM Hours Flooded Flood Volume (MG)
100 YEAR 0.86 0.015
100 YEAR ALTERNATE 0.85 0.012
Under the alternate 100-year design storm, flooding at the project site reduced from 0.015 MG to 0.012 MG or by ~20% as is depicted in Table 2. It can be concluded that the way in which the peak is emphasized in the provided rainfall intensity curve can be thought of as a worst-case scenario. If flooding can be mitigated with this design storm, a storm with multiple lower peaks will also be mitigated.
Infiltration Sensitivity
Infiltration plays an important role in redirecting much of the rainfall before it can be allocated to the sewer system. Most sub-catchments (89 of 91 all sub-catchments) in the system had a 50%
0 1 2 3 4 5 6
0 0.5 1 1.5 2 2.5 3
Ra in fa ll I nt en sit y ( in /h r)
Time Passed (hrs)
Alternative Rainfall Intensity Curves
31
impervious surface value. The remaining two had 49% and 83%. These were all imported from SFPUC’s dynamic model.
TABLE 3: IMPERVIOUS PERCENT SENSITIVITY ANALYSIS ON PROJECT SITE FLOODING % IMP Hours Flooded Flood Volume (MG) % Change in Flood Volume from Model
30 0.74 0.005 -66%
40 0.81 0.01 -33%
50 0.85 0.015 N/A
60 0.89 0.019 27%
70 0.9 0.023 53%
80 0.92 0.025 67%
90 0.94 0.027 80%
100 0.95 0.029 93%
Varying values of impervious surfaces were assigned to all sub-catchments and their effect on flooding at the project site given in Table 3. A change in the percentage of impervious surface in the sub-catchments led to a direct and significant increase in the flooding at the project site. It can be concluded that the percent of impervious surfaces assigned to each sub-catchment has a large effect on the initial flooding conditions at the project site. As SFPUC’s dynamic model offers more nuance in its assessment of imperviousness than is available in EPA SWMM’s static model, these values should be explored further.
Antecedent Moisture Conditions
An antecedent moisture condition is the effect of storage, planned (downstream detention basins, etc.) or unplanned (pipes, etc.), on the hydraulic performance of the system (N. Birth). These are difficult to consider accurately in the static modeling abilities available for the analyses in this technical memorandum. SFPUC and other clients/stakeholders should consider this condition through additional modeling by using a dynamic model and preceding the 100-year storm run with a 20-year storm run to fill up storage facilities.
2.14 Option Rating Methodology
To decide on a proposed option, it must be rated against other options and the existing flooding scenario. There are a variety of engineering rating methods with varying complexities that can be used. For the purposes of the options to be proposed in this technical report, a three-tiered (red, yellow, and green) qualitative ranking will be given in each of 5 criteria recommended by SFPUC.
32
2- Low Financial Cost: Describes how low the financial cost is of the option relative to other options.
3- Ease of Operation and Maintenance (O&M): Describes how much effort and cost will be necessary for the operation and maintenance of the option.
4- Minimal Environmental Impact: Describes how minimal impact the option will have on the environment.
5- Reliability: Describes the option’s ability to perform its function, even as environmental conditions, the performance of surrounding elements, and the system maintenance no longer fall within assumed levels. This is adapted from the Weibull definition for reliability (About Reliability Engineering).
33
Chapter 3: Options Assessment
3.1 Introduction
The following five options were selected, analyzed, and compared using the criteria established in section 2.14.
1. Do Nothing 2. Green Roof
3. Bio-Retention Planters 4. Easement Pipe
5. Detention Tank 6. Fill
3.2 Option 1: Do Nothing
Figure 21: 100-year Project Site Base Flooding Conditions
Background
Under the 100-year storm, there is roughly 15,000 gal of runoff that floods the project site drain in the base scenario. This volume encompasses the area under the red curve in Figure 21. The base scenario is identical to the Do-Nothing scenario as no intervention is implemented to at the project site.
Design
34
Drainage Performance
Under the Do-Nothing scenario, there is no mitigation of the 15,000 gal of flooding and the option receives a Red for the Drainage Performance criterion.
Low Financial Cost
There are several considerations when assessing the cost of the flood. Although there many costs incurred to many different parties during a flood, the party of concern is the City of San Francisco through SFPUC. Per SFPUC, most of the cost in flooding are related to decontamination and restoration of building materials and property. These costs are accounted for by the claims that are made to the City after a flood. Per SFPUC, flood costs are highly sensitive to the area of flooding but insensitive to the depth of the flooding. As such, a unit cost per area for claims may be used to calculate the potential cost of flooding during a 100-year storm (Shrestha).
One such claim during a flood in 2015 at 75 Lyell Street several blocks from the project site. The property claim was ~$70,000 for a property ~1,500 ft.2 in area. This claim cost the City ~$47/ft.2.
Bimayendra Shrestha of the Hydraulics Section at SFPUC confirmed in interview this value to be representative and applicable for assessing the cost of the flood at the project site (B. Shrestha).
The properties that are flooded in the 100-year storm can be seen clearly in Figure 9. The estimated combined area of these properties is 12,500 ft.2 which would translate to a total cost of
~$590,000 during each 100-year storm.
It’s important to note that less frequent storms can flood the project site and so a cost is not incurred only once every 100 years on average. A more robust method of assessing how often a cost would be incurred is to observe the number of times the project site has been flooded in recent years. Per SFPUC, the project site has flooded four times in the last 13 years. Each flood incurred up to $590,000 and the combined damage is confirmed to be over this value (B. Shrestha).
The Do-Nothing option has incurred this cost in only 13 years and will continue to incur greater costs each time the site is flooded. As such, the Do-Nothing option receives a Red for Low Financial Cost.
Ease of Operation and Maintenance
35
Minimal Environmental Impact
Flooding at the project site has created health hazards through the contamination of the local area with combined sewage. It has also damaged the local Little City Gardens (which also has various animals including chickens). As such, the Do-Nothing option receives a Red for Minimal Environmental Impact.
Reliability
The option serves no function toward mitigating flooding at the project site. As such, the Do-Nothing option receives a Red for Reliability.
3.3 Option 2: Green Roof
Figure 22: SWMM Green Roof Schematic
Background
The Golden Bridges School has advertised interest in Green Roof technology in their proposals, but no values or details were given. As such, design values must be assumed to observe potential impact on reducing flooding and associated costs. EPA SWMM 5 contains innovative LID controls for green roofs.
A green roof is a rooftop that includes plants and soil as an integral component of the roof. While exact composition and construction methods vary, green roofs in San Francisco typically include a root barrier, soil media, and a drainage system (San Francisco Living Roof Manual). Green roofs are typically designed to retain any rainwater that would have ponded on the impervious surface
underneath the roof’s building. From a flood mitigation standpoint, it should be assessed if the green roofs can act as storage and retain sufficient rainwater to mitigate flooding at the project site.
Design
Recall that 26% or roughly 8,000 ft.2 of the property land is designated for “institutional use.” An
36
control is broken down into 3 layers: Surface, Soil, and Drainage Mat as depicted in Figure 22. The SF Planning Department’s “San Francisco Living Roof Manual” outlines a variety of guidelines for inputs for each layer and suggests the saturated loading of the green roof not exceed 50 lbs./ft.2 for commercial buildings (San Francisco Living Roof Manual).
Values were selected and put into the green roof LID controls in the SWMM model as conveyed and justified in Table 15. The weight of each layer combines to be less than the recommended 50 lbs/ft.2. A green roof was placed as one square unit with an area of 5,600 ft.2 that would cover only
existing impervious area in the sub-catchment and drain outflow to the pervious areas.
Drainage Performance
The 100-year flood simulation with the green roof showed negligible improvement in flood performance at the project site. This makes intuitive sense as the amount of water that would need to be retained by the green roof to impact flooding at the project site would need to be substantial compared to loading the roof can bear. Due to negligible drainage performance, the green roof option receives a Red for the Drainage Performance criterion.
Low Financial Cost
The average cost of green roofs in the U.S. is between $15-20 per ft.2 in 2007 dollars (Green
Roofs). Assuming the higher end and a conversion rate of 1.17 to 2017 dollars, that leads to a green roof cost of $131,040for the proposed 5,600 ft.2 of roofing (Green Roofs) (Inflation Calculator). Green roofs
also provide long-term cost savings in the form of temperature and UV radiation control for the building resulting in a longer roof lifespan (Green Roofs).
It is important to note that the area of green-roofs may be different depending on the final design criteria from the school’s architects and engineers. Regardless, Golden Bridges School has promised to front the entirety of these costs. As such, the green roof option receives a Green for the Low Financial Cost criterion.
Ease of Operation and Maintenance
Green roofs require regular maintenance to remain functional and perform optimally. During the first few growing seasons, they require increased maintenance as the systems acclimate to environmental conditions and establish healthy roots and a high survival chance. Afterwards, maintenance periods become less frequent (San Francisco Living Roof Manual). One estimate puts maintenance costs at $0.50 per ft.2 per year (Green Roof Maintenance). With 5,600 ft.2 of proposed
37
incorporation into their curriculum reducing costs further. As such, the green roof option receives a Green in Ease of Operation and Maintenance.
Minimal Environmental Impact
Green roofs would reduce the environmental impact of the school infrastructure and provide environmental educational opportunities for the children attending the school. They also improve air quality through absorption of pollutants, reduce greenhouse gas emissions, provide habitat for wildlife, decrease noise pollution, and produce local food (San Francisco Living Roof Manual). As such, the green roof option receives a Green in Minimal Environmental Impact.
Reliability
The function of the green roofs is dependent on whether the Golden Bridges School construct and maintains the technology. This relegates responsibility of the option from the public domain (SFPUC) to a private domain whose reliability has not been confirmed nor denied. As such, the green roof option receives a Yellow in Reliability.
3.4 Option 3: Bio-Retention Planters
Figure 23: SWMM Bio-Retention Planter Schematic
Background
The Golden Bridges School advertised interest in Bio-Retention Planter technology in their proposals, but like the Green Roofs, no values or details were given. As such, design values must be assumed. EPA SWMM 5 contains innovative LID controls for bio-retention planters.
38
Design
Of the 74% of the 30,900 ft.2 property that remains open space, no sizing estimate have been
advertised by Golden Bridges. Infiltration surface areas should typically cover 5-10% of total paved area (Bioretention (Rain Gardens)). As such, we can select a design size of 10% or 3,900 ft.2.
In EPA SWMM, the bio-retention planter control is broken down into 3 layers: Surface, Soil, and Storage with an optional Drain as depicted in Figure 23. Using SWMM’s LID controls, a bio-retention planter layer was designed as conveyed and justified in Table 16. As the planters are on the ground, loading is no longer an issue (in contrast to the green roof). We can assume drainage is negligible for the purposes of this analysis as drainage can wait for up to 48 hours well after the 3-hour design storm is complete (Bioretention (Rain Gardens)). In the model, a bio-retention planter was represented as one square unit with an area of 3,900 ft.2 that would cover pervious surfaces and drain directly to the sewer
after the storm. The recommended depth is 4 feet and all layers combine to this depth (TC-32: Bioretention).
Drainage Performance
During the 100-year simulation, the bio-retention planters reduce flood volume at the project site by roughly 1,000 gallons from 15,000 MG to 14,000 MG or roughly 7%. This is not sufficiently close to the required threshold of complete flood mitigation and as such, the bio-retention planter option receives a Red for the Drainage Performance criterion.
Low Financial Cost
A general rule of thumb is that costs average between $3-4 per ft2 for residential bio-retention
areas and between $10-$40 for commercial, industrial, and institutional sites depending on soil
conditions and the density and types of plants used (TC-32: Bioretention). Another source claims $8 per ft2 for institutional sites (Association). Considering the school represents an institutional use, $10 per ft2
was assumed. With a total area of 3,900 ft2, the cost would be ~$39,000 to construct the bio-retention
planters.
It is important to note that the actual area designated for bio-retention planters may be entirely different dependent on the characteristics of the completed school. Regardless, the Golden Bridges School has committed to fronting the entirety of this cost to reduce their impact on flooding. As such, the bio-retention planter option receives a Green for the Low Financial Cost criterion.
Ease of Operation and Maintenance
It is estimated to cost $400-500 per year to maintain 500 ft2 of a bio-retention planter
39
performed by a landscape contractor with appropriate training. This cost accounts for mainly
landscaping maintenance activities such as watering and treating plants, re-mulching void areas, routine inspections, removal and replacement of debris and dead plants, and repair (Bioretention Basins). Assuming the higher end of this estimate, it would cost at most $3,900 per year to maintain the planters, and this cost could decrease over time. The Golden Bridges School has committed to fronting maintenance costs for LID on the site property. As such, the bio-retention planter option receives a Green for the Ease of Operation and Maintenance criterion.
Minimal Environmental Impact
Bio-retention planters can be adapted to meet a wide range of climate and geological conditions with a completely natural gravity fed system (Bioretention Basins). They would reduce the
environmental impact of the school and provide environmental educational opportunities for the children attending the school. As such, the bio-retention planter option receives a Green in Minimal Environmental Impact.
Reliability
The function of the bio-retention planters is dependent on whether the Golden Bridges School construct and maintains the technology. This relegates responsibility of the option from the public domain to a private domain whose reliability has not been confirmed nor denied. As such, the bio-retention planter option receives a Yellow in Reliability.
3.5 Option 4: Easement Pipe
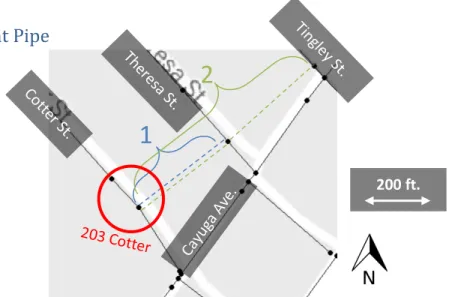
Figure 24: Easement Pipe Option Plan View
Background
The easement described in Section 2.6 presents an opportunity to redirect rainwater flow out of the project site’s catchment basin and into sites downstream. Per recommendation from Bimayendra
1
2
40
Shrestha of the Hydraulics Section at SFPUC, construction of any conveyance system in the easement should be underground as to not disturb the property owners beyond initial construction and occasional maintenance (Shestha). As such, a pipe conveyance system going through this easement could be an option for flood mitigation of the 203 Cotter St. project site. This pipe system would be independent of the combined sewer system and require separate drains collecting solely rainwater.
The easement spans the length of two blocks from Cotter St. to Theresa St. to Tingley St. There can be two sub-options for a pipe option, Scenario 1: a pipe that connects only one block from the Cotter St. system to the Theresa St. system and Scenario 2: a series of pipes connecting the Cotter St. system to the Theresa St. system and then to the Tingley St. system. These options are depicted and labeled respectively in blue as 1 and in green as 2 in Figure 24. The project site is circled and labeled in red in Figure 24. In both scenarios, the easements would connect to separate drains constructed on each involved street which would collect and convey excess rainwater during heavy storms.
It is possible that bordering households have built their property into the easement area. If this option is pursued, SFPUC should seek the full allowable width of the easement, avoiding fences and other such property. This would make construction more difficult but minimize costs and nuisance to abutting properties.
Design
The primary objective for the design is to minimize flooding at the project site. The secondary objective would be to ensure any redirected water is sent to systems at with excess capacity to spare otherwise flooding will be exacerbated in other systems. Before designing the pipe, the slope between the varying nodes must be assessed. Per International Plumbing Code, the minimum slope for a pipe greater than 6 inches in diameter is 1% (Drainage and Sewer Pipe Slope). Table 4 shows that the slope for each potential pipe meets this criterion.
TABLE 4: EASEMENT PIPE OPTION SLOPE CALCULATION
NODE Street
System Elevation of Pipe Invert (ft.) Distance from Previous Pipe Invert (ft.) Slope
27685 Cotter 101.6 n/a n/a
36368 Theresa 96.3 245 0.022
105181 Tingley 94 240 0.010
41
Figure 25: Easement Pipe Option in SWMM Model
The easement pipe option was represented in the SWMM model as depicted in Figure 25. Scenario 1 is outlined in blue and Scenario 2 in red in Figure 25. Each easement drain was connected to its local system’s preexisting drain via a 0.5 ft. diameter pipe 2 ft. in length that represents the surface connection and is circled in orange in Figure 25. Flooding in each system during the simulation is then represented as the sum of flooding at both the new rainwater easement drain node and the old combined sewer drain node.
Figure 26: SWMM Easement Pipe Profile View
A profile view of the easement pipe is depicted in Figure 26. Scenario 1 is outlined in blue and Scenario 2 in red paralleling Figure 25. The easement pipe stays 2 ft. below ground level which is
200 ft.
Ground Level
42
depicted with the green line and sufficiently higher than the sewer level at both the depicted with a purple line.
Drainage Performance
Circular pipes of various diameters were selected for both respective scenarios. The 100-year flood simulation was performed in each of these scenarios with each of these pipe sizes to yield the results in Table 5 where D and D(1) refer to the diameter of the pipe connecting the Cotter St. system to the Theresa St. system and D(2) refers to the pipe connecting the Theresa St. system to the Tingley St. system.
TABLE 5: EASEMENT PIPE OPTION DRAINAGE SUMMARY Street
System Flood Volume (10
3 gal)
NODE Base
Scenario D = Scenario 1 Scenario 2
0.5 ft. D = 0.75 ft. D = 1 ft. D(1+2) = 0.5 ft. D(1+2) = 0.75 ft. D(1) = 0.75 ft., D(2) = 0.5 ft.
27685 Cotter 15 8 3 0 8 3 3
36368 Theresa 13 22 38 64 12 1 28
105181 Tingley 92 92 92 92 101 117 100
From the base scenario in Table 5, it can be observed that all three systems are already flooded and beyond full capacity in the 100-year storm as highlighted with green text. The construction of an easement pipe to Theresa St. in Scenario 1 reduces flooding at the Cotter St. system but exacerbates the existing flooding at the Theresa St. The construction of an easement pipe all the way to the Tingley St. system exacerbates the existing flooding at both the Theresa St. system and Tingley St. system.
Only a 1 ft. diameter pipe in Scenario 1 between the Cotter St. and Theresa St. systems is capable of rerouting sufficient water to bring the flood volume below the required threshold. This however comes at the cost of a nearly 5-fold increase in flooding at the Theresa St. system from 13,000 gal in the Base scenario to 64,000 gal as highlighted with red text. The primary objective of mitigating the flooding at the project site is achieved but the secondary objective of avoiding redirection of flood water to other sites with full capacity is not achieved. As such, the easement pipe option receives a Yellow in Drainage Performance.
Low Financial Cost
43 $2014
𝐿𝐿𝐷𝐷 = 0.1192(𝐷𝐷𝐷𝐷𝐷𝐷[𝐷𝐷𝑖𝑖])2+ 5.7155(𝐷𝐷𝐷𝐷𝐷𝐷[𝐷𝐷𝑖𝑖]) + 252.4288
Where Dia = the diameter of the pipe and LF = the length of the pipe in linear ft. It is applicable for generating a preliminary estimate of the cost of as easement pipe.
The option of a 1 ft. diameter pipe between the Cotter and Theresa systems was selected for costing as it was the only option capable of rerouting sufficient water to bring flood volume below the required threshold. With the values for length (245 ft.) from Table 4 and diameter (12 in.) from Table 5 and with a conversion factor of 1.033, the unit cost is 338 $/LF and the total cost is ~$83,000 (Inflation Calculator). The unit cost value compared favorably to 379 $/LF, the value provided by the Engineering News Record (ENR) Index, an index of widely used national averages for construction (Report).
It is important to note that the 4 ft. corridor may be insufficient for the size of the construction equipment that may be necessary. If this is the case, fences would be have to be removed from the encroaching private property which would increase cost.
Considering these possible increases to the construction cost, the total cost would likely remain lower than the $590,000 per 100-year storm value derived for the Do-Nothing option. As such, the easement pipe option receives a Green in Low Financial Cost.
Ease of Operation and Maintenance
The easement pipe would only be used during instances of flooding and would only be used for runoff as opposed to combined sewage keeping operation and maintenance to a minimum.
Maintenance would take place on private property becoming an inconvenience for multiple residents in the neighborhood. As such, the easement pipe option receives a Yellow in Ease of Operation and Maintenance.
Minimal Environmental Impact
The easement pipe creates relatively little impact to the local environment. Open trench construction and the amount of piping (245 ft. or 1 ft. diameter) are both considered by SFPUC to have low potential emissions and minimal degradation of local habitat. As such, the easement option receives a Green in Minimal Environmental Impact.
Reliability:
44
3.6 Option 5: Detention Tank
Figure 27: On-Site Stormwater Detention Tank Schematic (On-Site Stormwater Detention Tank Systems)
Background
45
Figure 28: Online and Offline Detention Systems (On-Site Stormwater Detention Tank Systems)
There are two potential configurations for detention tank systems: online or offline as depicted in Figure 28. Online systems route all catchment flow through the tank whereas offline systems route a designated portion into the tank which runs parallel to the catchment flow (On-Site Stormwater Detention Tank Systems).
There are two potential discharge methods for these systems: gravity and pumping. Gravity systems use the difference in hydraulic head between the water in the tank for discharge and typically are lower cost due to the lack of a pump. When a gravity system is not feasible, a pumping system can be implemented as it adds mechanical energy to move water against hydraulic head (On-Site
Stormwater Detention Tank Systems). Design
46
Figure 29: V-Notch Weir Manhole Image (Google Images)
A weir is defined as a barrier over which water flows in an open channel (Weirs). They can be used in a manhole to redirect flow above a specified head as depicted with the V-notched weir in Figure 29. A weir diversion will be installed in the manhole close to ground level that will direct combined sewage to the detention tank. The main criterion for the weir is that it reroutes sufficient combined flow during the 100-year storm to meet the drainage criterion.
SWMM contains a weir link which was selected to model the weir. Input values were iterated to achieve drainage performance keeping it as small as possible. The following figure depicts the final weir design.
47
A 1.5’ x 0.8’ transverse weir was determined as ideal to satisfy the criteria which can be seen in Figure 30. The input values for the weir link in SWMM are depicted in Table 6.
TABLE 6: WEIR INPUTS
TYPE Value Units Note
TYPE Transverse
HEIGHT 0.8 ft. Height of the weir.
LENGTH 1.5 ft. Length of the weir.
DISCHARGE
COEFFICIENT 3.33 ft.
3/s Typical U.S. value
FLAP GATE No
INLET
OFFSET 8.2 ft. Depth of bottom of weir opening from inlet node invert.
CAN
SURCHARGE Yes
Will use an equivalent orifice equation to compute flow. Weirs in closed diversion structures such as this are typically allowed to surcharge.
A flapgate, as seen in Figure 31, is a gate in a link that opens when there is a negative hydraulic head differential but closes when there that differential is positive, preventing backflow across the link. As there is no need to prevent backflow from the tank into the project site manhole, no flapgate was designed here.
Figure 31: Flapgate Image
48
Birth). Concrete tank designs are typically very detailed procedures that consider stress/strain
relationships, seasonal and temperature variations, etc. to evaluate tank characteristics such as the wall and slab thickness. Per SFPUC recommendation, concrete wall and slab thickness were selected to be 1 ft. to account for such procedures (Shrestha).
The tank’s bottom must not be lower than the invert of the pipe at the project site otherwise ponding will occur which is not advised. The 15,000 gal (~2,000 ft3) of flooding at the project site must
be detained by the tank and as such the storage volume should exceed this. Per the recommendation of Bimayendra Shrestha of the Hydraulics Section at SFPUC, there must also be a 2% slope at the tank floor toward the center of the tank to prevent ponding (N. Birth, Imaan coming tomorrow). This slope has a negligible effect on design height and can thus be ignored in the SWMM model.
All design criteria were used to create a cross-sectional schematic of the detention tank option depicted in Figure 32. A whole page rendition of this schematic is available in the appendix (Figure 39).
Figure 32: Detention Tank Option Schematic
SWMM contains a detention tank node which was selected to model the tank. The input design characteristics for this tank node are given in Table 7.
TABLE 7: DETENTION TANK INPUTS
TYPE Value Units Notes
INPUTS
FLOOD VOLUME 2005 ft.3
GROUND LEVEL 110.6 ft.
SEWER INVERT LEVEL 101.6 ft.
SEWER DIAMETER 1.25 ft.
LENGTH 35 ft. Includes both RC walls
WIDTH 35 ft. Includes both RC walls
HEIGHT 4.85 ft. Includes bottom and top RC slabs.
THICKNESS 1 ft.
TOP ELEVATION 110.1 ft. Includes top RC slab.
49
TANK INVERT ELEVATION 103.25 ft. Includes bottom RC slab.
SEWER PIPE CROWN
ELEVATION 102.85 ft. Top of sewer pipe
INSIDE TANK AREA 1089 ft.2 Not including walls
STORAGE VOLUME 3104 ft.3 Should exceed flood volume.
TANK VOLUME 5941 ft.3 Includes all walls
CONCRETE VOLUME 2838 ft.3
An outlet pipe is needed to route combined flow from the detention tank back into the combined sewer. A standard pipe link was selected in SWMM to model the outlet pipe. The design characteristics for this pipe are given in Table 8.
TABLE 8: OUTLET PIPE INPUTS TYPE Value Units Note
DIAMETER 1 ft.
LENGTH 31 ft.
FLAPGATE Yes To prevent backflow during dry conditions.
It is desirable to keep the tank empty except during storms where hydraulic head reaches the weir elevation, (indicative of potential flooding.) To avoid entry to the tank from the outlet side, an outlet flapgate was designated to prevent backflow into the tank during dry flow periods.
The outlet pipe discharges to the node immediately downstream of the project site. Figure 33 depicts the SWMM model for this detention tank with the project site, weir link, storage tank node, outlet pipe, and downstream node circled.
Figure 33: Detention Tank Option in SWMM Model
50 ft.
*Not Drawn to Scale Weir Link
Storage Tank Node
50
Drainage Performance
Figure 34: Detention Tank Hydraulic Profile
Figure 35: Detention Tank Head and Flooding Profiles
The hydraulic performance during the 100-year storm model simulation can be observed in Figure 34 and Figure 35. The detention tank completely routes all water away from the project site satisfying the drainage criterion. It does so with ~0.2 ft. of buffer between the working height and top of the tank and ~1.7 ft. of freeboard between the working height and ground level. Per the
recommendation of Nicholas Birth of the Hydraulics Section at SFPUC, this hydraulic performance is adequate (N. Birth, Imaan coming tomorrow). As such, the detention tank option is given a Green rating for Drainage Performance.
Low Financial Cost
SFPUC provided a pre-planning level project cost estimate for a detention tank at Burke and 3rd
St. In this estimate, many work items were included. Per the recommendation of Bimayendra Shrestha of the Hydraulics Section at SFPUC, five work items were selected to be adapted to the cost estimation
Ground Level (110.6 ft.)
Top of Tank (109.1 ft.)
Weir Bottom (109.8 ft.)
Weir Level (109.8 ft.)
Top of Tank (109.1 ft.)
Detention Tank
Project Site