Abstract
DONNA G. MARTIN. Application of a Generalized State-Vector
Model for Radiation-Induced Cellular Transformation to
Multiple In Vivo Exposures. (Under The Direction of Dr.
DOUGLAS J. CRAWFORD-BROWN)A generalized state vector model for radiation induced
cellular transformation is adapted for use in multiple in
vivo chemical and radiation exposures. The model was
designed to describe the process of radiation carcinogenesis
and thus provides for initiation, promotion, and progression
as well as cell killing and repair. The model has been
modified to describe the combined effects of chemical and
radiation induced cell transformation.Benzo(a)pyrene and polonlum-210 markers for
environmental tobacco smoke and radon, respectively, were
chosen for this study because it is very possible that they
will be present together in a variety of indoor
environments. The data chosen to test the model come from
an experiment by McGandy et al. (1974) in which Syrian
golden hamsters were exposed both simultaneously and
sequentially to polonium-210 and benzo(a)pyrene.
The results demonstrate that the proposed model can
correctly predict that BaP synergism occurs more strongly
with high doses of alpha radiation. In addition, the model
correctly predicts the increase in tumors found at exposure
Acknowledgements
I would like to thank my advisor. Dr. Crawford-Brown,
for his support and encouragement throughout this project.
I would also like to thank my readers. Dr. Ball and Dr.
Turner, for their time and valuable insight into the final
product.
Table of Contents
List of Figures...iii
List of Tables...Iv
Chapter One INTRODUCTION...1I. Contaminants Chosen for Theoretical Study...4
II. The Presence of These Contaminants in Indoor Air...4
A. Benzo(a)pyrene...4
B. Polonium-210...5
III. The Purpose and Scope of This Study...6
Chapter Two THE MODEL...7
I. A Brief Review of Carcinogenesis...7
II. A History of State-Models...9
III. General Features of the Model...10
IV. Identifying the Stages of Promotion and Progression...14
V. Accepting the Model In Vivo...15
Chapter Three THEORETICAL SOLUTION OP THE MODEL...16
I. Assumptions Necessary for a Workable Solution...16
A. Cellular Environment...16
B. Dose...16
C. Cell Killing...16
D. Division and Repair...17
E. Contact Inhibition Removal...17
F. Promotion...17
II. The Solution...18
III. Derivation of the Solution...19
A. Solving for N^Ct)...19
B. Solving for NaCt)...22
C. Solving for N^(t)...23
D. Solving for N»(t)...24
Chapter Four
EXPERIMENTAL DATA...25
I. Cell Survival...25
II. Initiation/Cell Transformation...29
III . DNA Repair...31
IV. Promotion...31
Chapter Five
DETERMINATION OF PARAMETERS VALUES...36
I. £ = 1...36
II. f».s,...36
II. k...38
III. k*...39
IV. k=...40
VI. k=...41
Chapter Six RESULTS...42
Chapter Seven CONCLUSION...45
I. Future Research...47
REFERENCES...50
Figure 2.1 Figure 4.1
Figure 4.2
Figure 4.3
Figure 5.1:
List of Figures
The General Model...11
Cell survival vs. Dose of Alpha Radiation...26
Cell Survival vs. Dose of Benzopyrene...28 Hyperplasia (as % of control) vs. Dose of
Benzo(a)pyrene...32
List of Tables
Table 4.1: Dosing Regime of Syrian Golden Hamsters...34
Table 6.1: Parameters Values...43
Table 6.2: Comparison of Observed Results with Predicted
Introduction
Thousands of Superfund hazardous waste sites containing
complicated mixtures of chemicals have been identified
nationwide. Although primarily sites contaminated by the
chemical and petroleum industries, some of the sites are the result of transportation spills or once were municipal landfills now marred by the accumulation of pesticides and
household cleaning solvents (USEPA 1987). Although many of
the sites have similar chemical mixtures, they are not
identical. The chemical mixtures may, however, cause a
similar mixture of cellular and other health effects. The
same thing can be said of environments with ambient or
indoor air contamination such as might arise from
environmental tobacco smoke. Although each environment is
unique, the mixture of pollutants in the air may cause
similar types of effects.
Presently, EPA supports the use of an additive model
for the evaluation of the risk to public health from
Superfund sites. As instructed in the Superfund Public
Health Evaluation Manual (1986), the risk assessor
identifies indicator chemicals, pathways and magnitude of
exposure. Then, in order to determine the risk at the site,
approach, no provision is made for the interaction of
chemicals at a site. (USEPA 1986)
For an additive model to be correct, all contaminants
would have to exert their effect on the same stage of cell
transformation or development or there might be entirely
different routes to the same effect (cancer). Studies have
shown that this does not occur (NCRP #96). Not all exposures
cause the same type of cellular damage. Chemicals acting as
either initiators or promoters or both can cause a wide
range of cellular and organ effects. These cellular effects include but are not limited to: genetic damage, hyperplasia, DNA adduct formation, or cell death. Chemicals can also affect the organs by altering biokinetics or dosimetry. Furthermore, many chemicals require metabolism before
exerting their effect.(Farber 1981)
Chemicals can also modify the rate constant of another
pollutant in one of several possible ways. For example, a
contaminant may interact with existing chemicals and modify
the existing chemical before it reaches the cell. Also, a
previous chemical or radiation exposure may alter the
metabolic properties of the cell, causing the cell to react
differently (not normally) to a second exposure.
The generalized state-vector model presented by
Crawford-Brown and Hofmann (1990a) considers the interaction
of these effects in predicting a cancer risk. Their model
for the development of cancer, first introduced by Nordling
(1953) and later elaborated on by Armltage and Doll (1954),
is valid in form if not in the mathematical details.
Essentially, the multistage model proposes that a normal
cell is transformed by initiation, promotion and progression
through several distinct states or stages before eventually reaching a final state of uncontrolled growth. The difference between the multistage model and that of Crawford-Brown and Hofmann is that the multistage model posits transition rate constants between states, while the
latter model replaces rate constants by explicit changes in
the structural features of a cellular community.
The model proposed by Crawford-Brown and Hofmann
(1990a) has been tested against in vitro studies for
radiation and shown to provide good fits to previously
unexplained data. In vitro studies, however, are limited. Specifically, they do not take into account metabolic
activity, often a factor in chemical carcinogenesis. They
also do not include the kinetics of the growth of tumors in
the body.
This raises the question— Can this model be applied to
multiple exposures in vivo? The dose-response of a chemical
is dependent on what state the cell is in at the time of exposure. In in vivo studies this could interfere with the
•
Contaminants Chosen for Theoretical Study
Benzo(a)pyrene (BaP) and polonium-210 (Po-210) markers
for environmental tobacco smoke (ETS) and radon,
respectively, were chosen for this study because it is very
possible that they will be present together in a variety of
indoor air environments. In addition, these two contaminants exhibit behaviors which are applicable to the model. BaP is a carcinogen which acts both as an initiator
and a promoter and causes cytoxicity and hyperplasia.
Po-210, a radon decay product, is an alpha particle emitter and thus exhibits the behaviors characteristic of alpha
radiation.
The Presence of These Contaminants in Indoor Air
Benzo(a)Dvrene
Over 3800 compounds have been identified in the three
phases of ETS: sidestream smoke, mainstream smoke and gases
that diffuse out from the cigarette while smoking. All
three mixtures contain both a particulate and vapor phase. (NRC 1986) BaP has been identified as one of the primary
components of the particulate phase of ETS (NRC 1986).
Levels of ETS in the home environment have been
quantified. Most of the research has been done on the
respirable particle faction of cigarette smoke. Spengler et
24-hour indoor particle concentrations. The 24-24-hour national
ambient air quality standard is 260 ug/m^, Moschandreas et
al. (1987) observed that this level would be exceeded in a house with two or more smokers. Concentrations, in public buildings, bars and restaurants have also been quantified.Repace and Lowry (1980) report levels up to 700 ug/m' in
bars. Levels of ETS usually peak at the time of smoking and
are dependent on the number of smokers and on the type of
ventilation.
It is difficult to predict what fraction of these
particulates is Bap. Ventilation systems, depending on
their efficency and sophistication, may filter out the
particulate fraction of ETS which contains BaP. (NRC 1986) It is clear, however, that Bap is present in the air of
homes contaminated by environmental tobacco smoke.
Polonium 21Q
Although it is not usually referred to as a radon
daughter (short-lived solid isotopes of Rn-222) primarily
because of its 138 day half life, Po-210 is also part of the
radon decay chain. It, like Po-214 and Po-218, emits alpha
particles during decay. Previous studies have demonstrated
the ability of alpha particles to induce tumors in. vivo (NAS
1988), thus, polonium-210 exhibits behavior applicable to
Polonium 210 has also been found in tobacco smoke. The
parent isotope for Po-210, lead 210, can be detected in ETS in the form of "hot" particles (McGandy et al. 1974) which
heavily irradiate small volumes of the lung.
The purpose and scope of this study
The purpose of this study is to determine if the state-vector model is a good predictor of the effect of multiple
chemical exposure in. vivo. The data used to test the model
in vivo was generated in experiments performed and reported by McGandy et al. (1974) and Little et al. (1978). In this experiment (described in more detail later), Syrian golden hamsters were exposed to Po-210 and BaP both simultaneously and sequentially via Intratracheal instillation. Upon death or sacrifice (when moribund), the animals were examined histopathologically for the formation of lung tumors. The results of all the experiments will be used simultaneously
to test the coherence of this model to observed in vivo
data.
The study design includes: First, the general model is described with a discussion of the assumptions and the theoretical solution. Then, the experimental data are
presented and the necessary parameters are calculated.
These parameters and the experimental exposure levels are
then applied to the model and the results observed.
Finally, there is a discussion of the applications of this
The Model
A Brief Review of Carcinogenesis
Although the exact mechanism of carcinogenesis Is far
from being understood, it is generally accepted that the
process involves three basic sequential events; initiation,
promotion and progression. Each event has its own
characteristics and pathways which lead ultimately to a
state of uncontrolled cell growth and the death of an
organism.
The process of initiation involves several stages. When
cells are exposed to chemical insults, the first stage is
biochemical, can be repaired, and is assumed to Involve one
damage event. It is thought that the chemical forms an
electrophilic reactant (often after the chemical has been
metabolized) which enables it to bind to and alter
components, primarily DNA, in the cell. It is not clear
whether the alteration is a small structural or regulatory
mutation or a complex rearrangement of large parts of the
DNA. (Pitot 1986} With radiation exposure, DNA damage
occurs as two, not one, distinct events (Crawford-Brown and
Hofmann 1990a; Lloyd et al. 1979) and (for alpha radiation)
involves direct breakage of DNA by the deposited energy.
Both radiation and chemical damage are followed by cell
a permanent alteration of some sort in the DNA, RNA, protein
or other cellular components. (Farber 1981)
It is not certain what characterizes an Initiated cell.
These cells in tissues in the skin and colon appear to have
lost some ability to program or control growth (Farber
1981), while some initiated liver cells demonstrate an
"acquired resistance to the inhibitory effects of
carcinogens on cell proliferation" (Farber 1981). It is
clear, however, that the number of Initiated cells is
dependent on dose, a dose that exhibits no threshold (Pitot
1986).
Initiated cells are subsequently stimulated to
proliferate to neoplastic lesions. The exact mechanism of
this clonal expansion stage is unknown.(Farber 1981) Unlike
the process of initiation, promotion to a neoplasm
demonstrates a threshold effect and a maximum response.
Promotion can also be affected by such factors as diet,
environment or hormones (Pitot 1986).
Promotion to a neoplasm is followed by progression.
Progression has generally been "characterized by
demonstrable changes associated with increased growth rate,
increased invasiveness, metastases, and alterations in
biochemical and morphologic characteristics of the neoplasm"
(Pitot 1986). Like promotion, the mechanism of progression is unclear. It is proposed, however, that the changes seen
change in the number o£ chromosomes in the cells.(Pitot
1986)
A History of State-Vector Models
Scott and Ainsworth (1980) were the first to employ a state-vector model to describe the multistage process of
carcinogenesis. Building on an idea proposed by Armitage
and Doll (1954) and later elaborated on by Moolgavkar
(1978), Moolgavkar and Knudson (1980) and others, Scott and Ainsworth postulated that the development of cancer involved the passing of a cell through several successive stages or
states to the ultimate state of uncontrolled cell growth.
State-vector models can be used to calculate the fraction of
cells in each state or stage. Probabilities of transitions
between states (either as a function of dose or dose-rate)
are determined from experimental data.
The model used in this study is an adaptation of a
generalized state-vector model for radiation-induced cell
transformation proposed by Crawford-Brown and Hofmann (1990a). The model was designed to describe the process of radiation carcinogenesis and thus includes initiation,
promotion, and progression as well as cell killing and
repair. The model has been adapted to describe the combined effects of chemical and radiation -induced cell
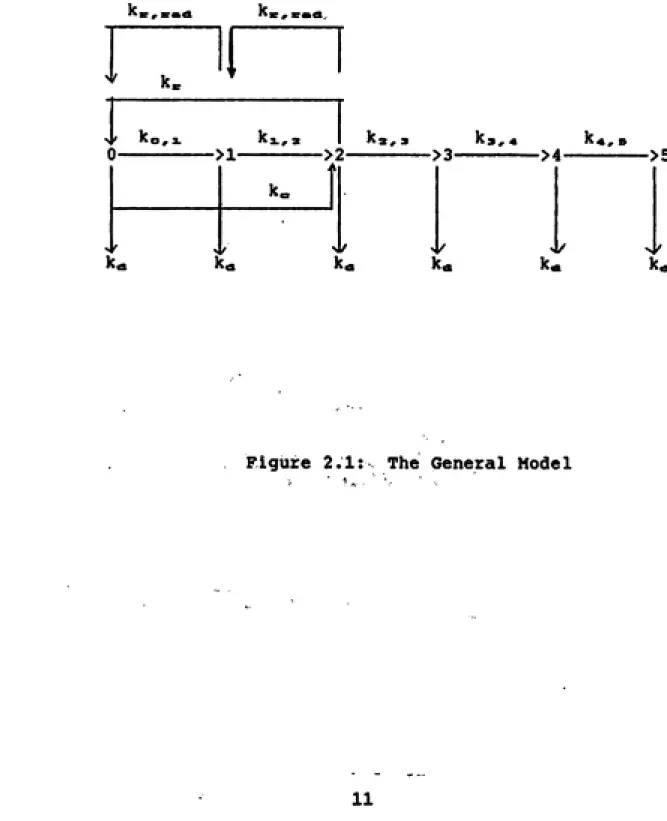
General Features of the Model
The model, a modification of the model for radiation induced cellular transformation described and tested in
vitro by Crawford-Brown and Hofmann, is shown in figure 2.1. State 0 represents cells in the "normal" state. These
cells have not as yet experienced a radiation or chemical
insult which would result in cellular damage.
Cells in State 1 have experienced specific radiation induced DNA damage such as a strand break. Cells exposed to chemicals, instead of radiation, skip this state and go directly to State 2. Cells that have incurred this damage
can undergo repair and revert back to state 0.
A cell reaches State 2 when it experiences a second,
radiation induced DNA damage (probably another strand break). This damage is less specific than that required to move from state 0 to state 1, and it is thought to be necessary for the two radiation-induced breaks to interact
for initiation to occur (Crawford-Brown and Hofmann 1990a).
A cell can also reach this state by incurring chemically
induced damage to the DNA, RNA or other cellular components. These cells can also undergo repair and revert back to state
0 (for BaP) or state 1 (for radiation).
Cells in State 3 have undergone division subsequent to
incurring DNA damage In State Two. According to Crawford
Brown and Hofmann (1990a) this division must occur for a
'c , xmA
probability and prevents regression of the cell back to
previous states.
By the time cells reach State 4, they have undergone
promotion to a neoplastic lesion. This is proposed to occur through the loss of cellular intercommunication, at times referred to as contact inhibition. The concept of contact inhibition removal, although vague, supposes a cell surrounded by dead cells loses its ability to communicate
and consequently enters into a state of Increased growth. While localized cell death may result in the loss of
communication, there clearly are other biochemical routes for this change. As a result, chemicals and radiation may
produce the change by different pathways.
Cells In State 5, the final state, have progressed to a stage of uncontrolled cell growth. It is not known how long it takes, or what triggers, a neoplastic lesion in
state four to progress to this state. Some Idea of the length o£ time presumably may be obtained by observing the
latency period, which may be decades in solid tumors. The
latency period may, however, also Include the time to
promotion.
The transition constant, k«, represents the rate of removal of a cell from any of the six stages due to radiation or chemical -Induced cell death. Its units are in
have different cell survival curves, thus it follows that
the cell death transition rate constants obtained from the curves will be unique.
K^ and k = ,e«<a represent the rate of repair of cellular
damage caused by chemical and radiation exposure
respectively, allowing cells to move out of state two or one
and back to state one or zero. The probability of repair is
dependent on time and upon the source of damage (radiation
or chemical).
The transition constant ko,i represents the
transformation of a cell from the zero state to state one.
It is quantified by the probability per unit dose that some
type of DNA damage occurs. This value, which is in units of
inverse dose, is different for each type of radiation.
The radiation-induced transformation of a cell from
State 1 to State 2 is represented by kaL,^. It is the
probability per unit dose that a second less specific damage
occurs and interacts with the first damage.
It is assumed that chemicals, specifically BaP,
exhibit single hit kinetics (see Grimmer et al. 1988) As a
result, only one chemically-induced damage event, not two,
is required to transform a cell to state 2. In this model the probability of a cell damaged by chemicals reaching
state 2 is represented by k... It, like ko,i and ki,,, is
Transition k^,, represents the fixed probability that a division related event will occur prior to repair or cell
death. It has been demonstrated that the cellular rate of
division, and subsequently k2,3, is dose dependent (Shuman
1989). The cellular rate of division also depends upon the
presence of hyperplastic agents (such as BaP)
^3,* represents the transition from State 3 to State 4. It is the probability that contact inhibition will occur,
thus causing the cell to Increase its rate of growth to a
neoplastic lesion. Because contact inhibition is dependent
on cell death (for radiation), a dose dependent event, this transition, like the previous ones, is also dose dependent. For chemicals, the transition is related to hyperplasia and
is dependent upon dose-rate.
Finally, k^,^ represents the probability of progression
to a final state of uncontrolled cell growth.Identifying The Stages of Promotion and Progression
Although this model represents promotion and
progression as separate and distinct stages, in reality it
is not this clear cut. Without additional research, it is
not possible to discern where promotion ends and progression
begins or, which is most likely the case, where the two
stages overlap. As a result, these stages are collapsed in
the present study, implying that progression occurs with a
Accepting the Model in vivo
In order to apply this model in. vivo it must be assumed
that in. vitro neoplastic cell transformation is
representative of the mechanism of cancerous transformation
in vivo. This assumption is supported by the work of Lloyd
et al. (1979) in which C3H mice injected with cells
transformed jji vitro by alpha particles developed malignancies. It is assumed here, therefore, that the in vitro model may be applied in vivo with appropriate changes
due to the differences in the kinetics of cellular growth
Theoretical Solution of the Model
Assumptions Necessary for a Workable solution
In order to provide a workable solution for this study,
several additional assumptions had to be made. They are:
Cellular Environment. For the purposes of this study,
it is assumed that there is a constant number of cells in an
organ. In addition, there is a constant, steady state
concentration of chemical and chemical metabolitesthroughout the period of exposure.
Dose. The mucous membrane layer of the lung affects
the migration of the contaminant to the cellular level.
Therefore, in order to simplify the equation, the dose to
the organ is considered to be a constant fraction of the
amount applied directly to the surface. Furthermore, it is
assumed that the spatial pattern of dose rate in the lung
does not affect the model.Cell killing. Cell killing Is assumed to occur at a
constant rate during the period of exposure and Is
Independent of other transitions in the model. In addition,
if a cell makes it to the division stage, the chance of
dying does not depend on age of the cell. It will be
Division and Repair. It is assumed that a cell is no
longer able to repair its damage once it has undergone division leading to state three. In addition, repair is assumed to be independent of the first three transitions.
(Crawford-Brown and Hofmann 1990a; Shuman 1989) Alpha
radiation Induced damage does not repair itself at all
(Heiber et al. 1987), except when the cell is stimulated by
promoting agents (Crawford-Brown and Hofmann 1990b).
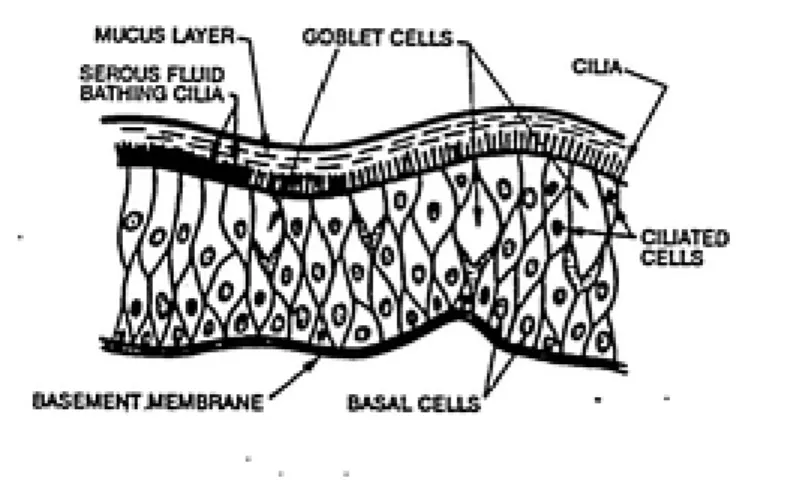
Contact Inhibition__Removal- It is assumed that every
cell surrounded by the correct number of dead cells (n=4)
will experience contact inhibition removal. This value was calculated by Crawford-Brown and Hofmann (1990a) for in vitro irradiation. For layers of epithelial cells, the total number of neighboring cells is six (Crawford-Brown and
Hofmann 1990a, see figure 5.1).
Promotion. It is assumed that there is a background
probability of promotion equal to 0.1 (Crawford-Brown and Hofmann 1990a). In addition, it is assumed that growth to
the pre-neoplastic stage occurs rapidly with respect to the
animals lifetime in the high dose-rate experiments used
here. The lag between exposure and promotion is not modeled
here, as might be required if temporal hazard functions were
used to estimate the effects of competing risk. Latency has
The Solution
Considering the above assumptions, the probability that a cell will reach state 5, a state of uncontrolled cell growth, can be predicted by the following equation:
P«= kNaCtXf^) (f»«pm +k,aD„)
(f»-pm +2kaf)„ + k^)
1 -e
-(A + k"f».B> + f„i)
where:
k= a normalization constant including k«,s/ the number
of cells at risk and the fraction of divisions
leading from state 2 to state 3 (see Crawford-Brown
and Hofmann 1990a).
N2(t)= the number of cells in state 2 at time, t
t= time (in weeks) -k,.DT
fs= (1- e )/ ktfDT ,where f^ is the fraction of N^
cells which survive the radiation after one day
£»««>= the fractional increase in hyperplasia due to
exposure to BaP proportional to De Dc= the dose-rate of the chemical (in mg/wk)
m= the rate of mitosis In undamaged cells
kei= the rate constant for alpha radiation induced cell killing
D^= the dose-rate of radiation (in rads/wk)
kc= the rate of repair of radiation induced cell damage
A= the background probability of promotion
k"= a parameter relating D^ to the probability of
promotion
fei= the probability of contact inhibition removal
Derivation of the Solution
In order to obtain the above solution, it is necessary
to first solve the differential equations for NaCt).
Solving for Nr>(t)
The first part of the equation accounts for cell transformation/initiation, bringing cells into the second
state. Solving for NzCt) requires first solving for the
number of cells in the zeroth state.
dNoi_tl= k^Nx(t) - (k^D^ + ko,iD^ + k=D« )No(t) dt
where:
No(t)= the number of cells in the zeroth state at time, t Ni(t)= the number of cells in the first state at time, t
k„ = the repair rate constant
ko,a. = the rate constant for radiation induced cell
transformation from state 0 to state 1, in rads"^
k« = the cell killing rate constant
ke = the rate constant for chemical induced cell
transformation from state 0 to state 2
k»Ni(t), the rate of repair back to state 0 is small compared
to the transformation frequency, therefore the equation
becomes:
dNo(t) + (k^h^ + ko,a.*D= + k«D=)Ni(t)= 0
solving using Bernoulli's solutions (Kells 1960), yields
-(kab^ + ko,ib^ + k=5e)t
•
Next, it is then necessary to solve for the number of cells in
the first state.
dN-, (t)= ko,iD^No(t) - k3.,=D^N3.(t) - kaD^N3.(t)- k^N3.(t)- k^D^N:^(t)
dt where:
N2(t)= the number of cells in the second state at time, t
kx,2 = the rate constant for radiation induced
transformation from state 1 to state 2, in rads~^
Again, solving with the aid of Bernoulli's solutions (Kells
1960)
(ki.,sD^+k=Dc=+keiDe+k^)t
N3.(t)e
= /ko,3.D=No(t) e dt +N3
.t , ... (kx,2D=+kaD^+k=D«+k^)t -(kaD^+ko,xD,r+kcD<=)t
(ke=Dc:+kaD„+k^+ki,2D^)t
e
0 ,t
»i
= ko ,D^No / e e dt•o , i^="o
+ N. 0
,,3.D„No ) e
(ki,2De-ko,xD^+k„)t
= kcxD^No I e dt +Nx 0
Therefore, the number of cells in the first state equals,
/ -(kaD^+ko,iD„+k„De)t -(kx,2D^+k^D^+k«+kcD„)t\
Na.(t)= ko,iLrNoXe________________________:^-^________________________/
k„+ka.,26,,-ko,a.6»
-(ki,2Ds+kaDe+k.=Dc:+k„)t
+ NiC
Finally, the number of cells in the second state can be
calculated in the same manner by inserting in the above
equations.
dN,(t)= kx,2D^Nx(t) -k^NaCt) -k^D^N^Ct) + kebcNi(t)+ k«b.,No(t)
Because we are only Interested In ways into state 2
(pathways out are being accounted for in later terms), the
equation becomes ;
dN2ltl= k3,,2D^Ni(t) + k^D^No(t) + k^D^N3.(t)
dt
Therefore,
A t.
N2(t)= / (kx,2D,, + k«D=) Ni(t)dt +/k,=D« No(t)dt +N2
0 0
A^-(k.,D^+ko,a.D^+k«b^)t
= (k^D^No) / e dt
+ (ka.,2D^ + k«D«) / Ni(t)dt +N2
0'
Thus, N2(t) equals
= (k=D=No)
(kaD^+ko,iD=+k=D=)t
(kaD»+ko,xD^+kc=6cr)
+ (kx,2D^+k„D»)(ko,a.D„No) 1- e
-(kaD»+ko,xI>=+k«D«)t
(k^+ki,2D„-ko,a.f)e)(kaD»+ko,a.C=+k«D=)
- {kx,s.D^+k«D«)(ko,xD=No) 1- e
- (k.ab^+k x, ab^+k^D^+k,,) t
(ke+ki,26^-ko,ibx:) (k«6»+ki,aD^+k^Dc+kicr)
+ (k3.,sD=+k«D«XNi) 1- e
- (k«D„+ka., 2D»+kerD=+ke ) t
(keiD^+kx, sD^+k«D=+k„)
Solving for N,{t)
The number of cells in state three, Na(t), is the
number of cells transformed into state 2 which have
subsequently divided prior to being repaired or killed. To
solve for NsCt), the number of cells in state 2 is
multiplied by (1) f^ and (2) the rate of mitosis divided by
the sum of the rate of mitosis and the rate of repair and
rate of cell killing.
i.e. P2,3= f»«s>m + kaD»
f».s>m + ka5c + kat)e + kt
It is assumed here that cell killing stimulates division of
the remaining cells.
N,(t) therefore = N^Ct) * lLa,,L_______ * f«
ke+ka, 3De+k,aDewhere:
The fraction of cells going from .state two to state
three equals ka,aD«/(k^+k2,3De+kaD^). That is the
fraction of cells which will move to state 3 within one day before being killed or repaired
ka,aD = the fractional rate of mltosis= faa^in + k^Dxr
Therefore the above fraction = (f»«B»» + k^D^)/(f».s,m + 2kaD. +k,^)
£^= the fraction of state 2 cells that survive the
remaining radiation after one day
Given t=o at the beginning of exposure and t=T at the end of exposure, the probability of a cell which moves into state 2 at time, t, surviving to
time, T, equals e'
act
The fraction of cells surviving to time, T
= /K e-*'-""-*"'^*'-*=* dt
OT / +0 . OlS ͣ
_ T^ -O-Oa-S-JOT / +0.01STDT j i.
0 '
_ « -0.01.e7DT / O . Oa.S7DT_-i \
0.0167DT
= K (i-e-°-°=-«-'^')
0.0167DT
but K = l therefore, f^ = (i_e-o • °io "'="ͣ)
0.0167DT
Solving for N^(t)
The probability a cell moves from state 3 to state 4 is
dependent on the probability that the cell is surrounded by
n dead cells at the moment of a division and the increase in
hyperplasia due to chemical exposure. Thus, the number of
cells in state 4 equals:
-(A+ f«i +k"f,.^)
N-.(t)= N3(t) * (1- e )
where;
A= background probability of promotion = 0.1 (Crawford -Brown and Hofmann 1990a)
f=i.= x! f" (l-f)"""
(x-n)l n!
f= the fraction of cells, surrounding a state 3 cell, which are dead at any
moment. In general, f= (m + k,aD^)/R.
m= fractional rate of mitosis= 0.01 day~^
(Hall 1985)
R= fractional rate of removal= 1 day"*"
(Crawford-Brown and Hofmann 1990a)
x= total number of neighboring cells
n= number of dead cells required for contact
inhibition removal to occur
k*= a parameter relating hyperplasia and
promotion
Solving for N^(t)
Finally, the probability of a cell exposed to both
chemical and radiation reaching state 5, a stage of uncontrolled cell growth is equal to
P== kN=(t)(f^)
where:
-(A + k*f».B, (fn-B^m +kaD^) 111 -e
+ i^x)\
(f»«pm +2kaD^ + k^)
k= a normalization constant including k^^sr the number
of cells at risk and the fraction of divisions
leading from state 2 to state 3 (see Crawford-Brown
and Hofmann 1989).
N2(t)= the number of cells in state 2 at time, t
t= time, in weeks
tnm»= the fractional increase in hyperplasia due to
exposure to BaP
m= the rate of mitosis in undamaged organs.
ka= the rate constant for radiation induced cell
killing
D^= the dose-rate of radiation in rads/wk
k^= the rate of repair of chemical induced cell damage
A= the background probability of promotion
k*= an undetermined parameter as described earlier
fe,j.= the probability of contact inhibition removal
occurring
f^ = the fraction of state 2 cells that survive the
Experimental Data
As discussed in previous chapters, the state-vector
model derived for this study allows for the prediction of
the probability of a cell exposed to both BaP and Po-210
reaching a stage of uncontrolled cellular growth. Such
predictions require the determination of necessary parameter
values from experimental data. Alpha-emitting radiation and
BaP have been shown to cause initiation, cell transformation, cell killing, hyperplasia, and contact inhibition removal. All of these effects play a significant
role in modelling the probability of a cell reaching a stage
of uncontrolled cellular growth. In this chapter, observed
data from experiments with BaP and Po-210, given both
together and alone, will be described, and parameter values
necessary to the theoretical model will be calculated.
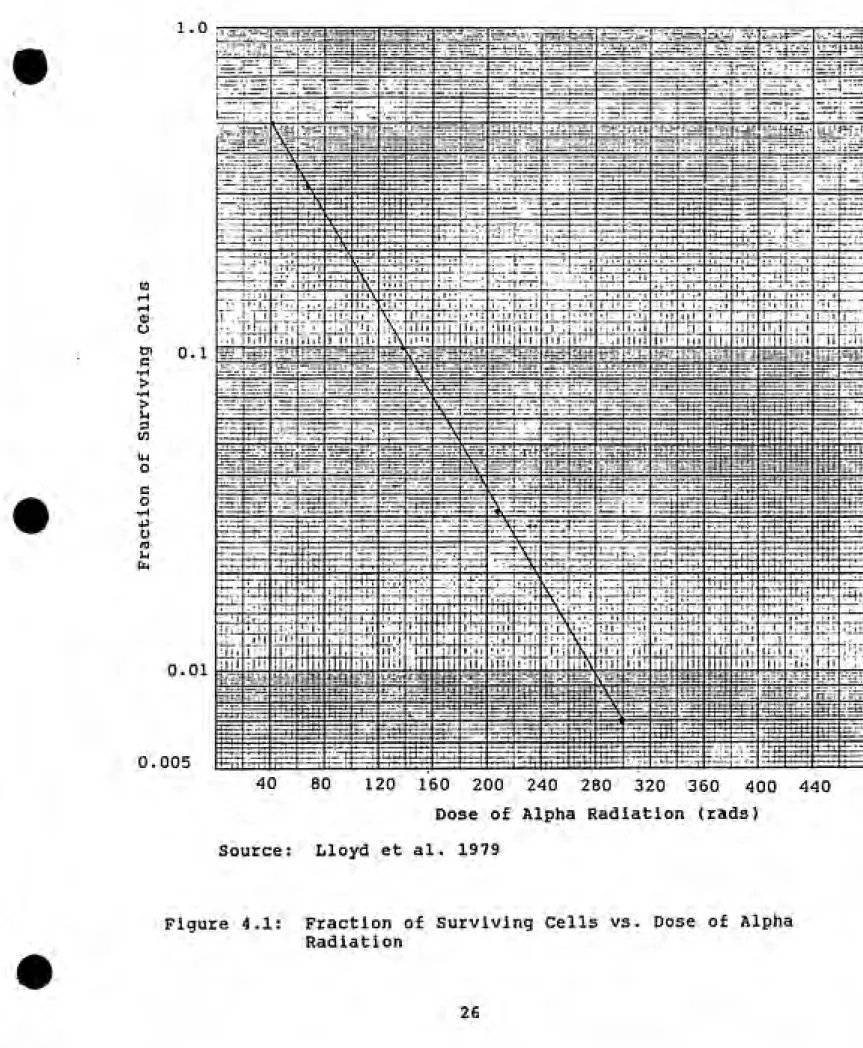
Cell Survival
The cell survival curve for alpha radiation is taken
from an experiment by Lloyd et al. (1979). In this study
C3H Tl/2, clone 8 cells were irradiated with 5.6 MeV alpha
radiation. The resulting cell survival curve shown in
figure 4.1 demonstrates that cell killing takes on an
1.0 -rr-^rrr^
0.01
0.005
40 80 120 160 200 240 280 320 360 400 440
Dose of Alpha Radiation (rads) Source: Lloyd et al. 1979
-kaD S(D)= e
where:
S(D)=survlvlng fraction at dose, D
e= natural logarithm
D= dose In rads
kesi= cell killing rate constant In rads"^
From the data, k^ for alpha radiation equals 1/60 rads or 1.67E-02 rads"^.
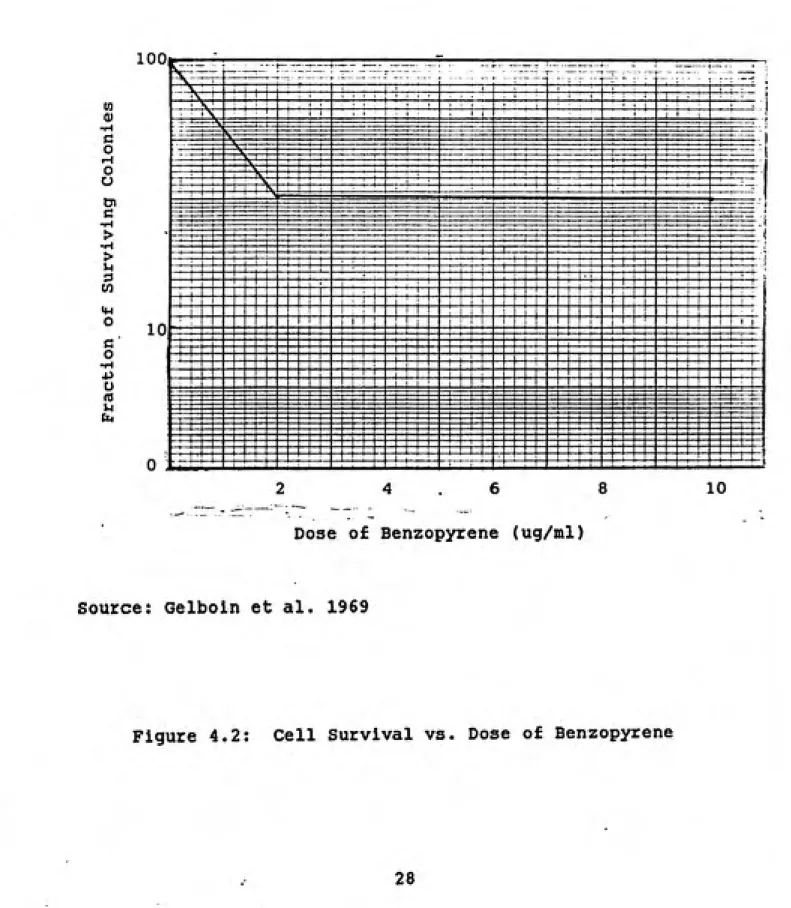
Cytotoxicity data for benzopyrene are provided by
Gelboln et al. (1969). Gelboln et al. (1969) exposed
normal hamster cells to very low doses of benzopyrene. The
results, shown In figure 4.2 as a percentage of surviving
colonies In treated plates versus dose of benzopyrene in
ug/ml, demonstrate that very low doses will apparently kill a substantial percentage of normal hamster cell colonies. These results conflict with In vivo results reported by
McGandy et al. (1974). This study, discussed in greater
detail later, found that 7.6 percent of hamsters exposed to
a total dose of BaP of 4.5 mg developed frank tumors. Given
that the mass of a hamster lung is 0.74 + 0.02 gms (Bivan et
al. 1987), a dose of 4.5 mg would be equivalent to 6.08E+03
ug/ml. At this dose, Gelboln et al. (1969) would predict
m 0) 1-t G O i-l o o o» c > u m o o u UU|
--——-^". 7...
ͣ
— —:—f
_ 1
Fv. I , , i . : " , «
^ ͣ i i ! ' 1 ; ͣ i : ; ! ; 1 : ^ ! M
Fx: 1 ' i i ^ i ' ͣ ! 1 i 1 ! 1 i ' i ' 1 ! [ ! i
' ^ ͣ 1 ; ; 1 1 1 ! ! i 1 ' ' ' ! i 1 i 1
ͣ
^^ =
_P_
ͣ
i ' '
1---1---*---!---1---'
M ! ! 1 ' j : ; ; Cf-f——
—i—I—1—U-r—ͣ—(—(—'—1
t---,---:---,---,---. 1 i !
M ! i ! '=: .1 ij
1 ͣ ? —i—i—;—1
—,
El
b^
1 1 i
—i—1—!_ —•---!---1---5
1 ' i ! ' 1 i ! 1 i i
-rrfTi
; ; 1 I ^
i—,—j—,—,—, -i-l ' T- 1
-—'—i—\—'r—
-| V r"—1---1---•--- --.--;--,--^__ —,—,—j—i—, —J—,—,—,—1M ) ; i ' III
' ^ i 1 1 i ' ' ill]
\ I i [III
>, i 1 ͣ 1 1 1 i 1 ' 111!
-r--^
~
_^—
H-N
j i i 1 ; ^ ͣ
1 '' ! ' .
—:—j—1—\—,
i ; ; I ͣͣ 1 M ! .^J mH
ͣ
t ͣ— —i—i—t—
~ E= ct^ —*.—\—i—i— ---1---1---;---1— —----\---ͣ— —i—i—\—,—1E
,—;—j— =ͣ ft'.1—h—ͣ
—i—
-ttl
—' —(—,—'
— —
---.----1----1----f~- 1—, 1— 1—1—1h- H-f f
j ; ͣ i
! ; 1 ' 1 1
^ I 1
: i ! ' ! ' 1 1 ; ! %
- 1 ! i 1 1
; ! t 1 j i
> \ in
! j 1
1 1 1
j ! I 1 i
' ; t 1 1
I 1 1 1 1
tri = 1 _ = ~ = L B — ==
1
—H^
1 i -—t—-5 — E1 = = 1 — = -1 = — -^ — E — --j----= —
i
— r — — = ~-^ EE
— 1—U—i— "1"^- I—-3 — ~ ~ =
—t— ^ 1-- E= ZZ
^
— -— —-+1 1 11 1 1 1 1 ' 1 '
ͣ
ͣ
1 I - 1 J.__L£
u M ^^^ t - i_i_ it~i'i"i .>
Dose of Benzopyrene (ug/ml)
Source: Gelboln et al. 1969
10
In order to reconcile the discrepancies between these two experiments, it has been assumed for the purpose of this
study that the amount of BaP instilled on the lung surface does not constitute the delivered dose in cells in. vivo. It
is further assumed that BaP does not cause significant cell
killing when compared to alpha radiation, which is a potent cytotoxic agent. The effects of any cytotoxicity will, therefore, be hidden in the determined parameter values for
k* and kc.
Initiation/ Cell Transformation
In the proposed model, a cell is assumed to be
initiated by the time it reaches state 3 (for model and
formula see chapter 2).
As discussed previously, radiation induced transformation is thought to be a two step process. The first step, represented in the model as ko,i. is the
transition between state 0 and state 1 which requires the
radiation to induce some type of DNA damage such as a strand
break. Crawford-Brown and Hofmann (1990a) have calculated
that the value of ko,i Is l.OE-04 times the alpha radiation
cell killing rate constant, k«. This yields a value of ko,x
equal to 1.67E-06 rad"*". based on a physical argument
focusing on target size.
Crawford-Brown and Hofmann (1990a). They estimate the value
of ki,2 for alpha radiation to be 0.04 rads"^. This value
has been adopted for this study.No/ Ni, and Nz represent the number of cells in state
0, state 1, and state 2 before receiving any radiation or
chemical exposure. The number of cells, as a proportion of
the total number of cells in the organ, has been determined
by Crawford-Brown and Hofmann (1990a) to be 0.94, 0.06, and
0.001, for No, Nj., and Nz, respectively. These values are
referred to as the initial state vector. In the initialstate, although they have not as yet received a radiation or
chemical Insults, cells can be moved from the zeroth state
to the second state by background radiation, spontaneous
transformations, or other miscellaneous cellular effects.(Crawford-Brown and Hofmann 1990a; Shuman 1989)
These values were determined for the initial in vitro
state vector, in the absence of in vivo data. Although
there will certainly be differences between the In. vitro and
the in. vivo state vectors, at this time the in vitro values
represent the best available estimate and were adopted for
this study.
It will be shown later that BaP is only producing a
small fraction of initiation above the initial state vector.
In the presence of radiation, BaP appears to function
DNA Repair
Damage caused by alpha radiation can not be repaired
(Crawford-Brown and Hofmann 1990a) unless stimulated by the
presence of strong hyperplastic agents (Crawford-Brown and
Hofmann 1990b). DNA damaged (in the form of DNA adducts) by
BaP has, however, been shown to undergo repair in hamster
cells at a rate of 50% or 0.5 per day (Eastman et al, 1981).
For the purpose of this study, repair is assumed to be
constant over time. Therefore, k^ equals 0.5 per day for
the BaP experiments. The value of k. for alpha damage in
the presence of BaP will be determined during curve fitting.
Promotion
The probability that BaP will cause promotion is characterized for the purpose of this study by its ability
to cause hyperplasia. Chouroulinkov et al. (1979) applied
BaP (or acetone control) to an area of clipped dorsal skin
of 45 day old CDI female mice. The treatment was repeated every other day until three treatments had been completed. The mice were killed eight days after the last treatment and examined histopathologically. The results demonstrate a linear increase in hyperplasia with increasing dose. The
results were extrapolated to higher doses for the purpose of
o u a o o 43 a (U u u 0) Pu 1400 1200 1000 800 600 400 200
'' ""'' pi '
ͣ
' d' 1 i i TTt~TTTp- i 1 1 1 : ' ~i"r"-^
ͣͣ
' 1 ! 1 ' • ' • '' \ ' r i ' ' W \ ' i ' i ! !
--}. j.-! , , j ,:.^ , .,, .. .| . , 1 , ! i I , ; i 1 1 , J_ ] . ; 1 j. 11 ; 1 1 1 1 1 ' M ^ '•ͣ ' ' ! 1 d 1 ' ' ' i ͣ ' ' ' i ͣ d
i i i ͣ 1 1 d' d 1 ''• ^ ' ' ^ ''' ͣ'' '' ͣ ͣ i' '' d Mi i ; i \ i 'i i d ͣ i ! ͣ i M i 1 id 1 ' ' '^ 1 ; i ! ' lid
. j .;,,.,.,,,, 1 j ,,. 1 ,, ^ ,, 1 ; 1 .|..H;-- -.,!,;,
ͣ
d i i ^ 1 1 i ' •
ͣͣ
ͣ
• • 1
ͣ
i i i ' j/ • i 1 i i
' "~^1 T^ \\\ Tl i
ͣ
1 1" T^^ 111 'd 1 —jA^-^^-H--- -,
j-' j-' j-'ͣ ͣ 1 'ͣ ' ' ' 'ͣ ^ -^']^ i " ͣ ^ isx. ͣ 'J:+. 4-^-^1-L] ;^x 1 ͣ ; 1 ' : i ' 1 1 11' '1 1 1 1 ; 1 1 A ' ͣ ' ' i+r4^'t ^"^^ "—"ͣ ip" ^^^n:"^ "i- ^; -S-^- "J-i i ' . 1 ; H' 1 ' ' 1 • j 1 ͣ ' 1 1 ' ; j 1 ' 111 ͣ y' '•'''ͣ ͣ ' 1 •
j , ͣ L^ ' ' ' : -^- i ; 1 ._^_j__^ 1 • l^ 1 d i i 1 ; 1 1 1 ';:ͣ;ͣ:' 1 i i i ; I ! t i | l 1/ 1 i 'T ' ; ' ''"' "...|
!ͣͣ.ͣ' ' ͣ 1 • . 1 ! 1 . ' 1 I ! 1
ͣ
! ! _L^ ^J^ ^ J__ i i : . 1 1 : 1 ; i :__ :_t^^_;J_^ 111 1 1 ' 1 ' 1 ' 1 d 11 1 T'd "ͣ i y" -1 Mill; :ͣ, 1 1 i 1 h ;
1 ' 1 : 1 1 ' ͣ . ͣ 1 : ͣ• \ i 1 j ' ͣ ͣ 1 . 1 . i M ' M 1 M . ' . 1 M 1 ! ' ͣ '/ ' \ ''"]' r i 1 ''1 M M ͣͣ M
111 1 1 , i 1 * ; 1 1 i 1 \ \ '- ] ' '' ͣ i ! ͣ ' ; ! ͣ i i ͣ j 1 ͣ ͣͣ
11' ! 11 '
ͣ
''/
ͣ
' r' 1 i' '' d d 1 i i' 1' •
ͣ
i d 1 d
ͣ
i ͣ-] : 1 ͣ '"I ; 1 ; ! M i : i j 1 1 ! j i ] \ 1 1 i { : 1 ! ͣ,.',,,' 'I ' ' i 1 1 '. 1 ͣ ͣ i 1 1 ͣͣ ͣͣ !
• ; ! 1 1 ͣ ' i ͣ 'ͣ ͣ ͣͣ '/ \ W \ ! 1 li ' ' \-\ ' ͣ' 1 i ' M i ! ' 1 d ! ͣ 1 1 ' 1 i d i 1 d ' ͣ d 1'1 '11 'ͣ i i '' '/ͣ I 1 i 1 '' 1 11' i i ͣ ͣ' j ͣ i 1 i i
d ' ' ' i d ^ i ' ' 1 ! ' i ' d
''' d i i 1 ͣ 1 d ͣ i d i i' i ' 1 '' i d' ^ ' ' ! i 1 i ^ ' , ͣ j'^ ! 1 ͣ 1 i ' 1 1 Ml i 1 i ' 1 I'M'':
-p-^ ' : i i . r^T—r^Hd^^i ' id 1 ; 1
1 i! d ͣ d i 11 11' ' 1! '< d ' 1 did I d' ' ' 1 1 i ' ' 1' ! 1 ! I n i 1 ' . ! !
d ! i i 1 ! i d ' ! i j ' d'l 1
1 ]. i -Wj " \ i i
ͣ
; ' ! ' ' ' r 1 1 i 1 ] j 1 1 \\'- ' \ '
ͣͣ
i ""i i ' 1' |1 i ..1 .. j ! d - 1 i 1 1 1 i
PLLJ-Lj- ' ^i-j- !'ͣ 4-L4-J__L , 1 w^J-idX
T^^T^^"^ TTT 7^^^ id h ^*-r-—^+-^- '-''-^+{Tr- 1 ͣ 1 ' j r M M ; ! 1 M ! ' ^ͣ' ! 1 ' ' ' I ͣͣ ^
jy Tm"^id^"T^ "T 1 r^"^ —t^-^ i -- :f4T^ ' /I ' M d : i '/'{'ͣ 1 M M ' ' ' M ͣͣ' M d 1 ͣ 1 " Mͣ
d /! 1 1 . M 1 !ͣ• .'li ! 1 l-'i t7'"-i 1 t
' d 1 d /p i i 1 j / id 1 M 1M 1 ' ' < M T M ! M r d M d d ͣ
i i ' 1 11 i 1 ! /I1 ! i t 1 ;/ d 1 i d d ' i 1 ' ' i 1 ' ' M' 1
' i' j i ' ' d i ' U d 1 Ml 1 1 11 M i 1 1 1 1 1 1 1 1 1 1 : : ; 1 1 1i 1 1 i i M M M1 d 1 d 11 1 i' 1 i 1 ! ^ 1 ' i ' i ' / d i/ i
111 ' 1 L 1 L ' i i ' i i M d 1 '
' 11 y* d d
I 1 ! ! ' . 1 .. .. / 1 1' -t-'t- -4-! -ͣ ͣͣ! H'l .- I'll 1 1 ͣ - 1 ] 1 111;:.
^ ''
/ ' "ͣ ' d ' 1 did 1 id d 11 d 1M
1 ' 1 M...1 ...1 " i ' d ' M M
^
/ T 1 M M
d J1 MM id Ml.'' ' dM ͣ d d
ͣ
\ ^ d* ,'• ' M '
\ / M M M' M d
-- - ^ — ^'... ^ '' iir
r t ͣ' '1 "1 1 id/ 1 ' d d
ͣ
"- 7 ^ i ͣ A 1 i 1 M 1 ' ]'! i ! M 1...1 M iͣ \ \ \ ͣ' d d
' / ' ...
' 11 J !,.. /... „ : : ., .. ' ' M ' Mil i MId 1 d
1... * ' ' '
ͣ
^ ^ i ' ... , ,...,,,,,. _L X^r . _iJ^^ J_ -J^J
^ ^^-. _|- - -1- -_(---^---h-_ ---! )L( ~_" ^ " x l: i^±itT: _ " :~ ..jiq: X^tfl '
1 1 ͣ 1 1 j i ͣ
/ ' '
^ . J_ __ -4+4+ ͣ- y- - - ...
^ͣ" ͣ-/ͣͣͣ ... "ͣ ͣ ' ͣ ! ͣ ' 1
ͣ
"^... it' 1 1M
? ͣ ... !
/ 1 1 ͣ i M i ͣ d
,_ -- -- - -___-_!_-,_- --(- "1 1 1 1
t - - - ' ...;ͣͣ ' : T ',,„;:ͣ " d M t -M ͣ -! M 1 1 1 1 1 1 1 1 ' ! i 1 1 1 1 1 1 1 1 M 1 1
'0 100 200 300 400 500 600
Dose o£ Benzo(a)pyrene (ug/cm*)
Experiment with Benzo(a)pyrene and Polonium-210
McGandy et al.(1974) exposed Syrian golden hamsters
both simultaneously and sequentially by intratracheal
instillation to Po-210 and BaP. Upon death or sacrifice (when moribund) the lungs and trachea were removed together and examined histopathologically for the formation of
tumors.
The dosing regime and percent of animals in each group developing tumors are presented in Table 4.1. McGandy et al. (1974) originally reported exposing the animals to lower radiation doses than appear in this table. This experiment was reported again by Little et al. (1978) with these doses.
Personal communication with J. Little (2/22/90) revealed
that the doses which appear in table 4.1 are correct.
The next chapter will use this dosing regime to
calculate the remaining constants which are necessary in order to solve the model. Experiment 1 in which animals were exposed to 75 rads/15 weeks, allows for the calculation of the rate constant, k. The value of k includes the value
of k*,B. Given that no frank tumors developed, it is
assumed that the cells remain in state 3. Experiments 7 and
9 together provide k*, the fractional increase in cancer due
to promotion from BaP of cells Initiated by radiation.
Table 4.1: Dosing Regime of Syrian Golden Hamsters Dosing Regime:
Group!1] Treatment [2] % w/tumours
(intratracheal instillation)
Simultaneous Series:
1 (82) Po-210 ferric oxide 12.2
(1.25 nCi X 15 wks) (~75 rads)[3]
2 (83) Po-210 ferric oxide 10.8
(0.25 nCl x 15 wks) ("15 rad3)[31
3 (66) BaP ferric oxide 7.6 (0.3 mg X 15 weeks)
4 (73) 1 and 3 simultaneously 34.2
on same ferric oxide particles
5 (74) 2 and 3 simultaneously 10.8
on same ferric oxide particles
Sequential Series:
6 (65) Po-210 ferric oxide 0.0
(0.04 uCi, single instillation)
7 (74) Po-210- Saline 1.4
(0.04 uCi, single instillation)
8 (72) 6 and 18 wks later BaP ferric oxide 18.0
(0.3 mg X 7 wks)
9 (63) 7 and 18 wks later BaP ferric oxide 15.9
(0.3 mg X 7 wks)
[1] Number in parentheses is number of animals at risk.
Animals that died during the treatment process were not
Included In prevalence rates.
[2] Treatment periods began when animals were 12 wks of
age.
[3] McGandy et al. (1974) orginally reported lower doses.
This experiment was reported again by Little et al.
(1978) with these doses. Personal communication with J. Little (2/22/90) revealed that the above doses are
rate constant for the repair of DNA damage caused by BaP and
radiation. Finally, experiment 3 in which the hamsters
were exposed to BaP alone, permits the calculation of kcs/
Determination of Parameter Values
The experimental data discussed in the previous chapter, can be used to calculate the remaining constants.
fei.: In order to move into the fourth state, the cell
must experience a loss of contact inhibition. Contact inhibition removal occurs when the cell is surrounded by a
minimum of n dead cells. The formula for the probability of
contact inhibition removal occurring is represented by a
binomial distribution and equals:
f=t= x! f"(l-f)"-" (x-n)t n!
where f, the fraction of dead cells present in the
organ = (m + kaD^)/R (Crawford-Brown and Hofmann
1990b)
For the purpose of this study it Is assumed (based on the
cell structure of the lung as seen in figure 5.1) that n equals 4 and x (the total number of neighboring cells)
equals 6. Given m equals 0.01 day~^, k« equals 0.0167 rad"^
and R equals 1 day"*, f equals 0.0124 and 0.0219 for
dose-rates of 1 and 5 rads/wk, respectively. It then follows
that for 1 rad/wk f«,i equals 3.5E-07 and for 5 rads/wk f^
equals 3.3E-06.
MUCUS LAYER-, GOBLET CELLS
SEROUS FLUID BATHING CILIA
BASAL CELLS
CILIATED CELLS
BASEMENT MEMBRANE
Figure 5.1: Epithelial Cell Layer o£ the Lung
et al. (1979) demonstrate that in in vivo studies f
increases with increasing dose. It is assumed that fb«B,
calculated iri vivo is proportional to the dose rate of BaP
applied in. vivo over the entire surface area of the
tracheobronchial region. Thus, given that the surface area
of the hamster tracheobronchial region is 8.10361 cm^
(Kennedy et al. 1978), doses of 2.1 mg and 4.5 mg (which both equal a dose-rate of 0.3 mg/wk) would correspond to a
fto.p of 1.9.
k: k, a normalization constant including k«,9, the
number of cells at risk and the fraction of divisions
leading from state 2 to state 3 can be obtained by solving the following equation for lung tumors in hamsters caused by
exposure to alpha radiation only.
f= (k) Ns(t) (f.) (k2,3D,)
(k»+k,aD»+k2,3D»)
-(A + f^i)
(1-e )
where:
f= fraction of animals developing frank tumors N2(t)= the number of cells in state 2 at time, t
f^= the fraction of cells in state 2 that survive the
remaining radiation after one day
1^2,3= the transition constant from state 2 to state 3
D^= the dose rate of radiation in rads/week
fci.= the probability of contact inhibition removal
occurring
A= the background probability of promotion
k»== the repair rate constant for the repair of alpha
ka= the rate constant for alpha radiation induced cell
killing
Because damage from alpha radiation cannot be repaired,
k^ equals 0. Given k2,3b^ equals m+ k^D^ (where m= the
fractional rate of mitosis) and the above assumptions, the
equation becomes
f= (k) Ns(t) (f^) (m+k^D^)
(m+2kaDzr)
-(A + f«^) (1-e )
Using the data from McGandy et al. (1974) in which 12.2% of
animals exposed to 75 rads over 15 weeks developed tumors, k
equals 75.8.
k*: k*, the fractional increase in cancer in cells
initiated by alpha radiation due only to the promotion from
BaP, can be calculated by dividing the percent of tumors
caused by an acute dose of radiation by the percent of tumors caused by a dose of radiation followed by several
doses of BaP. Using the results of McGandy et al. (1974)
experiments 7 and 9 the equation for k* equals:
-(A+f„^)0.014 = kN,(t. radiation) (1-e____________L -(A+f«i+k*f».s.) 0.124 kN3(t, radiation)(1-e )
where:
0.014= percent of animals with tumors given an
acute alpha radiation dose
0.124= percent of tumors caused by promotion by BaP. The percent of tumors initiated by
[15.9-•
k= a normalization parameter previously explained
N3(t)= the number of cells in the third state at
time, t
A= the background probability of promotion
fei.= the probability o£ contact inhibition removal
occurring
k*= the fractional increase in hyperplasia due to
exposure to BaP of cells initiated by
radiation
fB«s»= the fractional increase in hyperplasia due
to exposure to BaP
Solving the above equation yields a k* equal to 1.2.
k^: ke/ the probability per unit dose that a cell
damaged by BaP will reach state 2, can be calculated using
the results of experiment 3 by McGandy et al. (1974) in
which 7.6% of hamsters exposed to a total dose of 4.5 mg BaP
only developed tumors. The equation for k^, Is as follows:
0.076= lN;,itilil«-RlZi—^m_±_k«l
0.069 (N2(t))(f..pm/f..B»m + k»)
-k„b„t
= C(l-e ) +0.0011 (0.037)
0.001
where:
0.069= the approximate percent of tumors that
would be calculated by the model if
BaP caused no initiation or repair.
N2(t)= the number of cells in state 2 at time, t
N2(t) for 6.9 percent would equal the value of Na, the fraction of cells in state 2
before receiving any radiation or chemical
damagem= the typical rate of mitosl3= 0.01 day~^ (Hall
1985)ke= the repair rate constant for repair of DNA
damage caused by BaP only= 0.5 day"'"
The above equation yields a ke equal to 0.0065 dose"^. The
data demonstrate that the fraction of cells in state 2 due
to damage by BaP is only 0.00001 above the initial state
vector. It appears as if BaP is acting primarily as a
promoter, promoting cells that have already reached state 3,
and not as an initiator.k^: ke is the repair rate constant for the repair of
alpha radiation and chemical damage in the presence of BaP.
It is obtained by separately solving McGandy et al. (1974)
experiments 4 and 5 for k^ and then calculating the average
of the two. The k,: for experiment 4, in which 34.2% of
hamsters exposed simultaneously to 75 rads of Po-210 and 4.5
mg of over a period of 15 weeks developed tumors, equals
0.77 wk~^. The k. for experiment 5, in which 10.8% of
hamsters exposed simultaneously to 15 rads of Po-210 and 4.5
Results
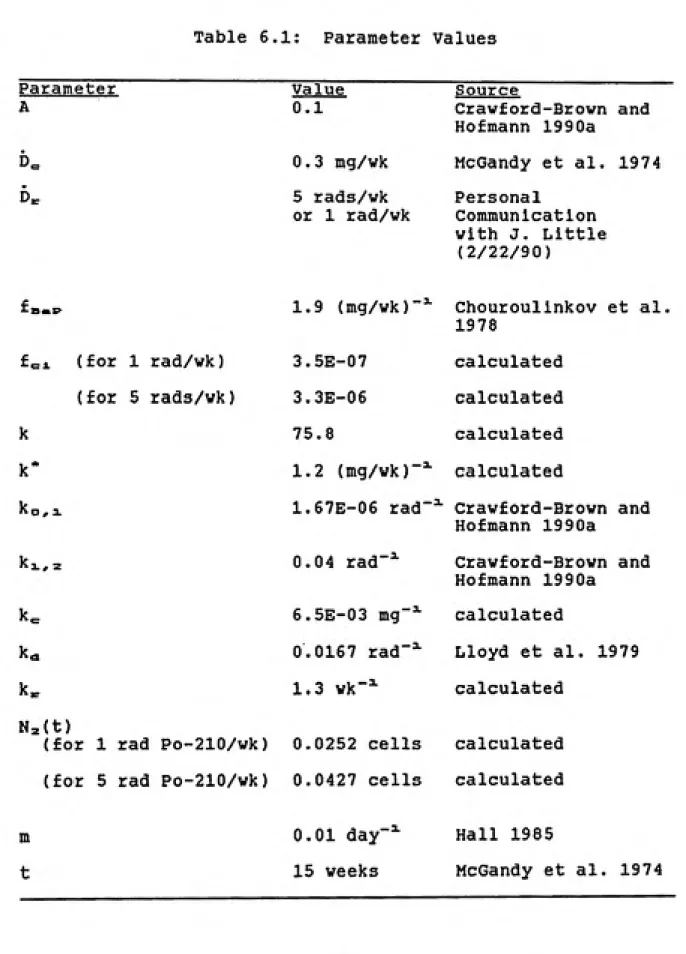
Using the values determined in the previous chapters,
the model can now be used to predict the results of all five of the simultaneous exposure experiments reported by McGandy et al. (1974). The parameter values are summarized In table
6.1. The results predicted by the model are as follows.
Experiment 1:
P«== kN2{t)(f„) (f»«B,m +kaD,;)
-(A + k*f».B. + f^i)'
fl -e
(f»«i>m +2kaD:c + k^)
= (75.8)(0.0427)(0.65)(0.57)(0.1)= 12%
Experiment 2:
?== (75.8)(0.0252)(0.84)(0.884)(0.1)= 14%
Experiment 3:
P«= (75.8){0.0011)(1)(0.91)(1)= 7.6%
Experiment 4:
P^= (75.8)(0.0427)(0.14)(0.57)(0.91)= 24%
Experiment 5:
P,,= (75.8)(0.0252)(0.1)(0.884)(0.91)= 15.4%
#
These results are compared with the observed results in
Table 6.1: Parameter Values
Parameter value Source
A 0.1 Crawford-Brown and
Hofmann 1990a
0.3 mq/wk McGandy et al. 197 4
D^ 5 rads/wk Personal
or 1 rad/wk Communication with J. Little
(2/22/90)
f B«E> 1.9 (mg/wk)""- Chouroulinkov et al.
1978
fc:^ (for 1 rad/wk) 3.5E-07 calculated
(for 5 rads/wk) 3.3E-06 calculated
k 75.8 calculated
k- 1.2 (mg/wk)-=^ calculated
ko, 1 1.67E-06 rad""^ Crawford-Brown and
ki, 2
Na(t)
(for 1 rad Po-210/wk)
(for 5 rad Po-210/wk)
0.04 rad"""
6.5E-03
mg"*-0.0167 rad~^ 1.3 wk-=^
0.0252 cells
0.0427 cells
A
t
0.01 day
15 weeks -3.
Hofmann 1990a
Crawford-Brown and
Hofmann 1990a
calculated
Lloyd et al. 1979
calculated
calculated
calculated
Hall 1985
Table 6.2: comparison of observed Results to
Predicted Results
Simultaneous Series
Percent of Animals
with Tumors
Experiment # Observedtll Predicted
Experiment 1
Po-210 ferric oxide
(1.25 nci X 15 wks) ("75 rads)
12.2 12
Experiment 2
Po-210 ferric oxide
(0.25 nCi X 15 wks) (~15 rads)
Experiment 3
BaP ferric oxide
(0.3 mg X 15 weeks)
Experiment 4
1 and 3 simultaneously
on same ferric oxide particles
Experiment 5
2 and 3 simultaneously
on same ferric oxide particles
10.8
7.6
34.2
10.8
14
7.6
24
15.4
[1] Source: McGandy et al. (1974)
communication with J. Little (2/22/90)
conclusion
The results of this study demonstrate that the proposed
model Is able to correctly predict that the synergism of BaP
and alpha radiation occurs more strongly at high doses of
radiation than at low doses. This is clearly shown by
comparing the ratio of the result of experiment 4 to that of
experiment 1, and the ratio of the result of experiment 5 to
the result of experiment 2:
Ratio of Experiment 4 to experiment 1: Measured: experiment 4 =34t2 =2.8
experiment 1 12.2
Modeled: experiment 4 =2A =2.0
experiment 1 12
Ratio of Experiment 5 to experiment 2: Measured: experiment 5 =10.8 = 1.0
experiment 2 10.8
Modeled: experiment 5 =15.4 = 1.1
experiment 2 14
From this comparison. It may be seen that the ratio is
higher for experiment 4/1 that for experiment 5/2, both in
the case of measurement and model predictions. Thus, in
associated only with the higher radiation exposure groups",
it can be clearly shown that it occurs as a result of thekinetics explicated by the present model.
In addition, the model correctly predicts the ten-fold
increase in tumors in animals exposed to low doses of
radiation and BaP versus animals exposed to low doses of
radiation only. This increase in tumors is due to thesaturation of the promotional effect of BaP. Because A (the
background rate o£ promotion) Is equal to 0.1, the
probability of promotion can only Increase ten-fold before
the promotional term becomes saturated. In this study,
£»«E>k* was shown to be large enough to saturate the
promotional term. If BaP were actually causing significant initiation at this dose, there would have been a higher
yield of tumors above a ten-fold increase.
The results demonstrate that the model is predictive of
observed in. vivo results in the form presented and with
these two contaminants. This result does not, however,
confirm that the model would be predictive with other contaminants or In other environments. For the purpose of
this study, BaP, a chemical which has been suggested to
exhibit single hit kinetics in the initiation phase of
carcinogenesis, served as the model for chemical exposures.
If a chemical were shown to require more than one Initiation
step, the form of the model would have to be adapted to
additional stages or a non-linear model would be required.
The model, as presented, does not account for the
temporal appearance of effects following exposure or temporal changes in the relationship between exposure and
dose-rate. specifically, it was assumed here that the
amount of chemical or radiation that reached the cell per
unit time was constant over the period of exposure. This is
probably not the case. In reality, the amount of chemical or radiation that reached the cell should be greatest when the dose was initially Instilled on the surface. In addition, the concentration of metabolites might change with
time. The form of the model would remain the same if this
were taken into consideration but the dose-rate would become an explicit function of time.
Future Research
Although there are uncertainties concerning the
validity of the model in different situations, the model has been shown to be a good predictor of the experimental results presented here. Additional research in the
following areas would clarify the uncertainties and
strengthen the evidential base of the assumptions of the present model, consequently strengthening its precision and
accuracy when it is applied more broadly.
overlap. As a result, the stages have been collapsed
together in this model. New information about the two
stages, with an explicit modeling of tumor growth kinetics,
could affect the predictions of the model.
[2] The initial state vector, the number of cells in states 0, 1, and 2 prior to any chemical or radiation
insult, used in this study has been taken from in. vitro
studies. The values, if an initial state even exists in
vivo, may be different and consequently lead to a different
predicted risk of cancer.
[3] The results of this study have been obtained assuming that the cellular concentration of BaP has reached equilibrium. This suggests that there may be a problem if
the ratio of BaP to Its metabolites changes rapidly. It is
important to know what the active metabolite is and its ratio to BaP in different cell populations and at different
times following the onset of exposure.
[4] In order to simplify the model It was assumed that
the dose to the organ is considered to be a constant
fraction of the amount applied directly to the surface. In
reality this is not the case, since there will be
homogeneity of dose within cellular subpopulations. Doses
•
151 The mechanism of contact inhibition removal Is not
well understood. Additional research would add insight into its role in the promotional stages of cell transformation.
The results presented In this study demonstrate that this model could prove useful in predicting the risks of chemical and radiation exposure in. vivo. Applying this model, instead of the additive model advocated by the EPA,
at Superfund sites or in polluted Indoor air environments
could provide a more accurate picture of the probability of
developing cancer and may have a significant affect on
clean-up or so called safe-levels presently advocated. In
the future, an effort should be made to test this model with more complex combinations of chemicals and chemicals and/or
References
Armitage, P. and R. Doll. 1954. The Age Distribution of Cancer and A Multi-stage Theory of Carcinogenesis. Br. J. Cancer. 8(1):1-12.
Bivan, W.S., G.A. Olsen, and K.A. Murray. 1987. In
Laboratory Hamsters. Van Hoosier, Jr., G.L. and C.W. McPherson, Eds. New York: Academic Press, Inc.
Chouroulinkov, I., A. Gentil, B. Tierney, P.L. Grover, and
P. Sims. 1979. Biological Activities of Dihydrodiols Derived from Two Polycyclic Hydrocarbons in Rodent Test
Systems. Br. J. Cancer. 39:376-382.
Cothern, C.R. and J.E. Smith Jr., Eds. 1987. Environmental Radon. Chapter 6:Dosimetry. Environmental Science
Research, Vol. 35. New York: Plenum Press.
Crawford-Brown, D.J. and W. Hofmann. 1990a. A Generalized
State-Vector Model for Radiation Induced Cellular
Transformation. Int. J. Radiat. Biol. 57(2):407-423
Crawford-Brown, D.J. and W. Hofmann. (in press 1990b). A
Mathematical Theory of the Influence of Dose-Rate on Cellular Transformation In-Vivo, to appear in
Mathematical Biosciences, 1990.
DiPaolo, J.A., P. Donovan, and R. Nelson. 1969.
Quantitative Studies of In Vitro Transformation be Chemical Carcinogens. J. Nat. Cancer Inst.
42:867-876.
Eastman, A., B.T. Mossman and E. Bresnick. 1981. Formation and Removal of Bap Adducts of DNA in Hamster Tracheal
Epithelial Cells. Cancer Research. 41:2605-2610.
Farber, E. 1981. Chemical Carcinogenesis. New England J
of Med. 305(23):1379-1389.
Gelboin, H., E. Huberman and L. Sachs. 1969. Enzymatic Hydroxylation of Benzopyrene and its Relationship to
Cytotoxicity. Proc. Natl. Acad. Sci. 64:1188-1194
Grimmer, G., H. Brune, G. Dettbarn, K. Najack, U. Mohr and
R. Wenzel-Hartung. 1988. Contribution of Polycyclic Aromatic Compounds to the Carcinogenicity of Sidestream Smoke of Cigarettes Evaluated by Implantation into the