1
Understanding Medical Student Specialty Choices in Primary Care
By Sally Wood
A Master’s Paper submitted to the faculty of the University of North Carolina at Chapel Hill in partial fulfillment of the requirements for the degree of Master of Public Health in the Public
Health Leadership Program. Chapel Hill
2010
Advisor and First Reader
Date
MPH Second Reader
2 Abstract
Background: Over the last decade, the number of medical students choosing a primary care specialty has declined, contributing to what many think is a specialty-dominated workforce.
With many predicting a primary care physician shortage, the declining interest in primary care
among medical students is concerning. Objective: To determine the important factors associated with the choice of primary care specialties and non-primary care specialties.
Methods: In this cross-sectional study, I distributed surveys about specialty intent and
influential factors to fourth-year UNC medical students. After appropriate coding, I analyzed the
data using Pearson’s chi-square tests (categorical data) and the students t-tests (continuous
data). Results: The response rate was 84.4%. Only 27.4% of students chose a primary care specialty. Female sex was significantly associated with a primary care specialty choice, though
background (rural, urban, suburban) was not. Students identified work and intellectual
satisfaction as the most influential factors, and students choosing primary care valued a sense
of doing good more and financial compensation less than did those choosing non-primary care.
Although 45.5% of students chose a specialty they were considering at matriculation, 84.7% of
students considered other specialties during medical school. Students who chose a primary
care specialty were more likely to have considered a primary care specialty at matriculation. Conclusion: Students valued work satisfaction and intellectual satisfaction when choosing a
career, and there are some moderate differences in important factors between those choosing
primary care and those choosing non-primary care. Primary care intentions at matriculation
3 Introduction
It is estimated that the Patient Protection and Affordable Care Act (PPACA) of 2010 will
provide access to our health care system for 32 million Americans by providing them with health
insurance (Goodson 2010, 742-744). But will these newly insured patients find doctors to care
for them? Many are projecting that our increasingly specialized physician workforce will not be
able to accommodate this much larger number of insured persons looking for care (Goodson
2010, 742-744). Just as Massachusetts struggled to provide primary care to its newly insured
citizens as its 2006 health reform was implemented, so will other states if access to health
insurance is expanded throughout the nation (Bodenheimer, Grumbach, and Berenson 2009,
2693-2696) –which is exactly what PPACA does.
Even in 2009, prior to the passage of PPACA, the New York Times wrote about the primary care shortage, quoting President Obama as saying, ―We’re not producing enough
primary care doctors‖ (Pear 2009, A1). And we aren’t. Currently, about 30% of the U.S.
physician workforce practices primary care, far fewer than the 50% of physicians in other
industrialized nations with lower health care costs and better health outcomes (Goodson 2010,
742-744). Popularity of primary care specialties has been declining with medical students: 2009
was the twelfth year in a row that the number of medical students choosing primary care
specialties had declined (Bodenheimer, Grumbach, and Berenson 2009, 2693-2696).
Why aren’t medical students choosing primary care specialties? In the same article
raising the Obama administration’s alarm about the state of the physician workforce, President
Obama identified debt as the major barrier for medical students entering primary care careers
(Pear 2009, A1). Others attribute the decline to the increased workload of primary care
physicians as the prevalence of chronic diseases increases (Goodson 2010, 742-744) or the
increasing income gap between specialists and primary care physicians (Bodenheimer,
4
Throughout this declining trend of medical students entering primary care and especially
in the early 1990s, when primary care was also thought to be in crisis, many have studied why
medical students are choosing the specialties they do. How does debt influence this decision?
Medical education? Personality? MCAT scores? This literature provides valuable insight into
what is a very complex decision and, even with its limitations, may provide guidance for how the
trend away from primary care can be reversed.
I conducted a small study to examine the specialty choices of the University of North
Carolina School of Medicine (UNC-SOM) 2011 graduates and to identify why they chose these
specialties. A public medical school, UNC-SOM’s mission is to improve and protect the health
of North Carolinians—especially those who are underserved(University of North Carolina School
of Medicine 2005). As the North Carolina Institute of Medicine estimates that over 1.1 million
additional North Carolina residents will have health insurance by 2019 (North Carolina Institute
of Medicine 2011), this study may provide insight into how to produce more primary care
physicians for North Carolina to accommodate these new patients—although graduating more
primary care physicians from one state school is likely only an aspect of the solution.
This paper begins with an exploration of why increasing the proportion of primary care
physicians even matters as it establishes what we know about how medical students make
specialty decisions—specifically, why medical students do or do not choose primary care. I
then present the methods, results, and conclusions from my survey of the 2011 UNC-SOM
graduating class.
The Primary Care Physician Shortage and Why It Matters
Studies have demonstrated that geographic a greater density of primary care physicians
results in lower health care utilization and costs, and better health outcomes (Starfield, Shi, and
Macinko 2005, 457-502;Macinko 2003, 831;Basu, Friedman, and Burstin 2002, 1260-1269;Basu
5
Researchers posit that primary care physicians may be associated with lower health
care costs because of lower utilization and prevention of more expensive interventions and
treatments. A 1992 cross-sectional study found that specialists in a variety of health systems
had had higher hospitalization rates, prescribed more prescription drugs per patient, and
ordered more tests per patient than did primary care physicians (Greenfield 1992, 1624).
Basu et al. (Basu 2004, 489-510) found that communities with a greater proportion of
primary care doctors appeared to have fewer preventable hospitalizations in three of the four
states studied. This supported results from an earlier study that a greater density of primary
care doctors was associated with fewer preventable hospitalizations for New York residents
(Basu, Friedman, and Burstin 2002, 1260-1269). While causation cannot be inferred from these
studies, reasonable explanations for the associations include primary care’s emphasis on
preventive care, which may reduce the hospitalizations.
Studies have also found that a greater density of primary care physicians is associated
with better health outcomes for residents of a community. In a comprehensive review of the
literature, Starfield et al. (Starfield, Shi, and Macinko 2005, 457-502) found a positive
relationship between the supply of primary care and better health outcomes. The studies they
reviewed were diverse in their outcome measures (e.g. mortality, morbidity), analytic
approaches, and geographic categorization (e.g. state, county, urban) and controlled for
population characteristics that affect health, such as education, race and income.
A comparison of countries with a strong primary care orientation to the United States
also supports this association. Macinko et al. (Macinko 2003, 831)found that countries with a
―strong‖ primary care orientation, have lower all-cause mortality, all-cause premature mortality,
and cause-specific mortality even after controlling for system-level factors (total physicians,
gross domestic product per capita, and the percent of elderly) and other determinants of
population health (per capita income, alcohol and tobacco consumption, average number of
6
While other factors such as stronger public health and social work systems may
confound the apparent relationship between more primary care and better outcomes, other
studies have found similar results: countries that provide universal access to primary care
physicians have better health outcomes, such as lower death rates from hypertension and
stroke and lower infant mortality rates (Starfield, Shi, and Macinko 2005, 457-502). Starfield et
al. (Starfield, Shi, and Macinko 2005, 457-502) even found evidence that a greater supply of
primary care physicians can reduce health disparities.
As our health care costs continue to rise, as the prevalence of chronic diseases
continues to increase, and as our health outcomes continue to disappoint, primary care
physicians and prevention may be part of the solution. However, primary care physicians only
make up between 30 and 35% of the physician workforce in the US—far less than the 50%
found in countries with better health outcomes and lower costs (Bodenheimer, Chen, and
Bennett 2009, 64;American Medical Association 2011). While the workforce has nearly doubled
since 1975, the increase in specialists has far outpaced the increase in primary care doctors
(American Medical Association 2011). The American Medical Association reported that the
proportion of physicians in primary care (family medicine, general practice, internal medicine,
obstetrics/gynecology, and pediatrics) increased by 112.3% since 1975, the proportion of
physicians in primary care subspecialties (e.g. internal medicine subspecialty) increased by
771.8% (American Medical Association 2011). In 1975, the proportion of physicians practicing
in primary care (as defined above) was 36.8%; in 2009, this proportion was 31.6% (American
Medical Association 2011). Nearly half (47.4%) of the practicing primary care physicians were
older than 45, and 25.2% of these physicians were between 35 and 44 years old.
Trends in medical school graduates’ career choices help explain this decline in the
proportion of primary care physicians and the rise of subspecialists. Newton et al. (Newton and
Grayson 2003, 1179-1182) found that in 1987, 49.2% of medical school graduates matched into
7
these primary care specialties peaked in 1998 at 53.2%, the percentage decreased to 44.2% in
2002. In addition, by 2002, students were more likely to subspecialize within a primary care
field, and only 21.5% of students expressed an interest in primary care, as compared to 35.6%
in 1999 (Newton and Grayson 2003, 1179-1182).
Declining interest in primary care careers has continued since 2002, with the ―popularity‖
(Phillips et al. 2009, 1) of primary care reaching ―historic lows‖ (1). The number of students
choosing to match in internal medicine continued to decline, and the number of students
choosing general internal medicine continued a faster decline (Hauer et al. 2008, 1154-1164).
Fifty-four percent of internal medicine residents chose to practice general internal medicine in
1999, and only 20% chose to practice general internal medicine in 2008 (Schwartz et al. 2011,
744-749). Results from the 2009 National Resident Matching Program (NRMP) showed a
continuing declining trend for medical students entering family medicine (Pugno et al. 2010,
552-561).
Projections of a future primary care shortage vary. In 2006, the American College of
Physicians (American College of Physicians 2006) predicted ―an impending collapse of primary
care‖ (1). With a growing elderly population and the rising prevalence of chronic diseases, this
report argued that the demand for general internists would increase by 38% from 2000 to 2020
(American College of Physicians 2006). Colwill et al. (Colwill, Cultice, and Kruse 2008,
w232-41) predicted that, while the supply of primary care physicians for children should meet demand
through 2025, the workload for generalist physicians for adults will increase such that there will
be a deficit of 35,000 to 45,000 generalist physicians for adults. A report from the Association of
American Medical Colleges (AAMC) predicted a 124,000 physician shortage by 2025, and
suggested that demand is likely to increase much faster than supply for primary care specialties,
as compared to other specialties (Dill and Salsberg 2008).
In contrast, the U.S. Department of Health and Human Services concluded that, while
8
grow faster than the physician supply, there was not a clear indicator that there would be a
primary care physician shortage (as there was in the 1990s) (U.S. Department of Health and
Human Services, Health Resources and Services Administration, and Bureau of Health
Professions 2008). In addition, while the Council on Graduate Medical Education (COGME)
predicted a physician shortage by 2020, this report highlighted the shortages in non-generalists
specialties and recommended that the demand for primary care and for specialty physicians be
studied to better determine the need for primary care physicians (Council on Graduate Medical
Education 2005).
While projections of a primary care shortage are not consistent, Bodenheimer and Pham
(Bodenheimer, Chen, and Bennett 2009, 64) argue that there is already evidence of limited
access to primary care physicians: delays in scheduling appointments, difficulty getting in touch
with doctors, fewer primary care doctors accepting new patients and Medicaid and Medicare
patients, and more people going to the emergency room. In addition, we know that those who
live in rural and impoverished areas have difficult accessing a primary care physician (Phillips et
al. 2009).
Furthermore, many argue that a shortage of primary care doctors ―is inevitable in the
near future‖ (801) as the U.S. population grows and ages (Bodenheimer, Chen, and Bennett
2009, 64). Policy changes resulting in universal access or substantially decreasing the
uninsured would likely overwhelm the current state of primary care (Phillips et al. 2009).
However, as debates continue about the validity of projections and the need for primary
care, the diminishing trend of medical student interest in primary care cannot be disputed.
Understanding why fewer medical students are choosing primary care is important as our nation
begins to implement the Patient Protection and Affordable Care Act and face the rising health
care costs of our system. If dissuading or persuading factors can be identified, then policy
9 Factors Influencing Primary Care Specialty Choice
I conducted a systematic review of literature from 1995 through 2011 to assess the
factors influencing the specialty choice of medical students—specifically, the factors influencing
medical students to choose primary care specialties. I reviewed and evaluated the quality of 37
articles (Appendix A provides the search strategy and a very detailed review of the individual
articles). Analysis of these articles was challenging, as the studies were often of low quality—a
problem amply discussed in the literature. Reflecting on the quality of this literature in 1996,
Meur, Bland and Maldonado(Meurer, Bland, and Maldonado 1996, 68-77) concluded, ―the
literature on specialty choice is difficult to interpret because of multiple biases, design
weaknesses, small number of subjects, inconsistencies in both dependent and independent
variables and conflicting results‖ (68).
The literature continues to be limited by these problems. The majority of the studies
included in my review was observational or cross-sectional, and therefore introduced great
potential for confounding bias. In addition, causality cannot be assumed with these study
designs. Furthermore, the sample size of these studies is often small or limited to one (or a
few) medical schools, which results in poor generalizability.
While many studies used national surveys such as the Association of American Medical
Colleges’ (AAMC) Graduation Questionnaire (GQ) and Matriculating Student Questionnaire
(MSQ), other survey instruments which were not valid or reliable were often used, introducing
measurement bias and confounding bias. Retrospective surveys querying students about
influential factors in their specialty decision are especially difficult to interpret, given that the
validity of these introspective causal reports assumes that physicians can accurately identify
these factors—something that Pathman and Agnew deem fraught with bias (Pathman and
10
The definition of primary care—that is, what specialties are considered primary care—is
not consistent in the literature, which further limits the analysis. The dependent variables
included in multivariable analyses are often different as well, which may lead to different results.
Despite the limitations of the literature, the studies do provide valuable information—
especially when analyzed together. Only studies judged to be of fair or good overall quality are
included in the synthesis of results. In general, the literature suggests that several intuitively
obvious characteristics seem to have an influence on choice of specialty, but others do not, and
most of the characteristics are related to specialty choice in complicated and even confounding
ways (see Appendix A for a much more detailed review of the literature as it addresses each
characteristic).
As is anecdotally expected, sex matters: women are more likely to choose primary care
(Kassebaum, Szenas, and Schuchert 1996, 198-209). Older students are also more likely to go
into primary care, but in this case, age is probably a proxy for other variables, such as family
status and career interests (Bland, Meurer, and Maldonado 1995, 620-641). Race and ethnicity,
contrary to popular expectations, do not seem to be associated with primary care when other
variables are controlled (Jeffe, Whelan, and Andriole 2010, 947-958). Married students are
more likely to choose primary care but, as with age, marital status is probably a proxy for a
constellation of other contextual variables (Bland, Meurer, and Maldonado 1995, 620-641).
Background is especially important in terms of rurality: students from rural areas or small towns
are more likely to choose primary care (Phillips et al. 2010, 616-622). On the other hand, other
measures of background, such as one’s parents’ professions, or socioeconomic status (SES),
are not as strongly associated with specialty choice. People whose parents were not
themselves physicians, and people who come from lower SES levels are somewhat more likely
to become primary care doctors (Kassebaum, Szenas, and Schuchert 1996, 198-209;Colquitt et
11
Much is made today of whether matriculating career interests, personality, and values
dictate specialty choice. As a whole, the literature suggests that the obvious finding – a strong
pre-existing interest in primary care – holds, although it is complicated by students’ likelihood of
changing their minds more than once during medical school (Bland, Meurer, and Maldonado
1995, 620-641;Colquitt et al. 1996b, 399-411). Those who rank being more interested in
treating a strong sense of social responsibility and service and the preference for interacting
with people higher than they rank prestige and income are more likely to choose primary care
(Kassebaum, Szenas, and Schuchert 1996, 198-209;Kiker and Zeh 1998, 152-167;Bazargan et
al. 2006, 1460-1465).
Not surprisingly, we also know that personal interest in day-to-day activities (practice
characteristics) of specialties influences career choices. Students interested in diverse patient
populations and comprehensive care and less interested in procedures and technology are
more likely to choose primary care (Bland, Meurer, and Maldonado 1995, 620-641;Burack et al.
1997, 534-541;Fincher and Lewis 1999, S121-3).
Debt and expected income are often cited as reasons why students do not choose
primary care. While there is convincing and consistent evidence that lower income expectations
are associated with primary care choice, the influence of debt is more complex (Phillips et al.
2010, 616-622). While debt likely has some influence on primary care choice, the effect is likely
modest and influenced by other factors, such as expected income and personal situations (e.g.
families) (Phillips et al. 2010, 616-622;Colquitt et al. 1996b, 399-411).
Lifestyle is also a popular source of hypotheses about specialty choice. However,
studies have not consistently defined lifestyle, and its relation to specialty choice is complicated
by the fact that part-time work and other ―lifestyle‖ considerations (e.g. income) are possible in
more than one specialty. The evidence does not support a consistent association.
Finally, medical education itself makes a difference. Those who attend public medical
12
although it is not clear what the causal order may be: students choose a public medical school
based on primary care orientation or public medical schools create cultures that foster primary
care interests (Kiker and Zeh 1998, 152-167). The curriculum also matters, in predictable ways:
required primary care clerkships and more primary care exposure in the third and fourth year,
are both associated with a greater likelihood of primary care choice (Kassebaum, Szenas, and
Schuchert 1996, 198-209;Campos-Outcalt and Senf 1999, 1016-1020). However, experiences
in the first two years of medical school have little effect on career choice (Campos-Outcalt and
Senf 1999, 1016-1020;Stimmel and Serber 1999, 117-126).
With this review of the literature, I conducted an original survey of the deliberations
underlying specialty choices among fourth-year students at the UNC-SOM.
Methods
I conducted a cross-sectional study of fourth-year medical students in the spring of 2011
at UNC-SOM. I distributed an Institutional Review Board (IRB)-approved paper copy of the
survey (see Appendix B) during a class meeting on the day the National Resident Matching
Program (NRMP) released the 2011 Residency Match results. Students who were receiving
their match results that day and who were in attendance at the class meeting were asked to
complete the survey prior to receiving their match results. This timing ensured that students
had finalized a specialty choice, but were not influenced by the NRMP match results. The
survey was both anonymous and voluntary, and all students were offered a small incentive,
regardless of whether they had completed the survey.
I designed the survey instrument to be grounded in the findings from the literature, as
discussed above, and to be responsive to the feedback from five UNC-SOM medical students
who reviewed earlier drafts with knowledge of my research question. The final survey included
eleven questions and queried students about final specialty choice, intent to subspecialize,
13
specialty intent, and future career plans (e.g. teaching, clinical research, administration, etc.).
Students were asked to select specialties from a list, to rank six factors (financial compensation,
work satisfaction, intellectual satisfaction, lifestyle, length of training and sense of good)
influencing their final specialty decision in order of importance from 1 (very important) to 6 (less
important), and predict how they would spend their professional time in ten years by assigning a
percentage to time spent across different activities. Other questions about additional influential
factors, including a specific question about the influence of medical education, were
open-ended. I requested only very limited demographic information (sex, race/ethnicity, rural or urban
background) to reduce burden and preserve anonymity.
I coded survey responses and entered the data into an excel spreadsheet. Each
specialty was assigned an individual number, and each yes/no response was coded similarly to
reduce the potential for error. I categorized ethnicity entries into six different categories which
were then coded. A minority of students did not rank the listed factors correctly either by using
some numbers twice or simply ―checking‖ the important factors. Numbers that were used twice
were coded as written, but ―checking‖ factors without any indicated rank was considered
missing data.
I reviewed the responses for all open-ended questions and created thematic categories
for each question. I reviewed the categories with my adviser. I coded comments based on
these themes, and comments often contained more than one coded theme or value. Therefore,
when I indicate proportions of comments, I am considering the total number of codes, which
exceeds the number of comments.
After coding and data entry was completed, I selected ten original surveys to check for
coding and entry accuracy. I found that each entry was accurate.
I used STATA software to analyze the data. In general, the analysis compared the
14
relationship between dependent variables and individual specialties (e.g. family medicine) were
not possible, given the small sample size.
I defined primary care specialties to include internal medicine with no intention to
subspecialize (general internal medicine), pediatrics with no intention to subspecialize (general
pediatrics), medicine-pediatrics with no intention to specialize (general medicine-pediatrics),
obstetrics/gynecology with no intention to subspecialize (general obstetrics/gynecology), and
family medicine regardless of intention to subspecialize. Non-primary care specialties included
internal medicine with intention to subspecialize (or unsure about subspecialization), pediatrics
with intention to subspecialize, obstetrics/gynecology with intention to subspecialize and all
other specialties.
However, because general obstetrics/gynecology is often not considered a primary care
specialty in the literature, a separate categorization defined primary care specialties as general
internal medicine, general pediatrics, general medicine-pediatrics, and family medicine
regardless of subspecialization intent. I did separate analyses with this categorization and
noted any difference found with this definition of primary care specialties.
To analyze the importance of the ranked influential factors (e.g. financial compensation,
etc), I created three different categories: very important (if rank order was 1 or 2), important (if
rank order was 3 or 4), and less important (if rank order was 5 or 6 or not indicated).
I calculated overall frequencies of responses and conducted Pearson’s chi-square tests
for categorical data to compare the importance of each factor between those choosing a primary
care career and those choosing a non-primary care career. Given the small sample size, I used
Fisher’s Exact Test to determine the significance of the correlations. Calculation of means and
ranges and t- tests were used to analyze continuous data (i.e. future plans of students).
15
All fourth-year students who were matching (n=147) in the spring of 2011 were eligible to
take the survey. Seventy-seven (52.4%) of eligible students were female, according to school
records (Dent 2011, ). Race and ethnicity data were not available for students who matched,
although these data (self-reported) were available for the entire graduating class of 2011
(n=157): 115 (73.2%) white students, 18 (11.5%) African-American students, 17 (10.8%) Asian
students (Chinese, Asian Indian, Korean), 1 (<1%) Filipino, 6 (3.8%) other/unknown/not
provided (Currie 2011). Specialty choice data were available for all eligible students; see Figure
1 for this specialty data (Dent 2011).
One-hundred and twenty four students completed the survey, for a response rate of
84.4%. Sixty-three female and sixty male students completed the survey (one respondent did
not identify his/her sex). Seventy-two percent of respondents (n= 89) self-identified as
Caucasian/White, 10.5% (n=13) as South Asian/Chinese/Indian, and 6.5% (n=8) as
African-American/black. Four percent of responding students (n=5) were Hispanic. One student was
biracial, and 7 students did not disclose their ethnicities. Close to 17% of students reported a
rural background, 14.5% reported an urban background, and 65.3% reported a suburban
background. Two students reported both a rural and suburban background, and 2 students did
not respond.
Based on a comparison of school (Dent 2011, ) and survey results, I estimate that the
following students did not complete the survey: 1 of 6 students choosing anesthesiology, 1 of 2
students choosing dermatology, 1 of 15 students choosing family medicine, 5 of 11 students
choosing general surgery, 8 of 30 students choosing internal medicine, 1 of 14 students
choosing obstetrics/gynecology, 2 of 2 students choosing ophthalmology, 1 of 5 students
choosing otolaryngology, 1 of 7 students choosing pathology, and 2 of 3 students choosing
physical medicine and rehabilitation. See Figure 1 for additional details.
16
Specialty choices of students were diverse (see Figure 1). The specialties chosen by
the highest number of student were internal medicine, pediatrics, family medicine, and
obstetrics/gynecology. Almost eighteen percent (17.7%) of students (n=22) selected internal
medicine, 12.1% (n=15) selected pediatrics, 11.3% (n=14) selected family medicine, and 10.5%
(n=13) selected obstetrics/gynecology. Students also frequently selected emergency medicine
(n=7, 5.6%) and psychiatry (n=8, 6.5%).
Overall, 58.1% of students (n=72) indicated they planned to subspecialize within their
chosen field. Thirty-five percent (35.5%, n=44) did not plan to subspecialize, and 5.6% (n=7)
were unsure about subspecialization (1 student did not respond to this question). Within the
primary care fields (including internal medicine, family medicine, medicine-pediatrics,
obstetrics/gynecology, and family medicine), 52% of students planned to subspecialize (see
Table 1 for a subspecialty intentions within each primary care field). Sixty-four percent of those
choosing internal medicine planned to subspecialize (82% if those students who were unsure
about subspecialization are grouped with those planning to subspecialize), and 47% of those
choosing pediatrics planned to subspecialize. In addition, the majority of those choosing
medicine-pediatrics and obstetrics/gynecology planned to subspecialize.
Based on subspecialization intent, a total of 34 students (27.4%) planned to practice in
primary care, defined as general internal medicine, general pediatrics, general
medicine-pediatrics, general obstetrics/gynecology, and family medicine. If general obstetrics/gynecology
was not considered a primary care specialty, 29 students (23.4%) planned to practice in primary
care.
Demographic Associations
Twenty-four female students (61.5% of all women) compared to 9 male students (17.6%
of all men) chose a primary care field. This difference was significant (p= 0.002). When general
obstetrics/gynecology was not considered a primary care specialty, the association remained
17
In my survey, the association between ethnicity and primary care choice is significant
(p=0.014). A significantly higher proportion of Hispanics (80%) chose primary care and a
slightly higher proportion of South Asian/Chinese/Indians (30.8%) chose primary care than did
Caucasian students (21.4%) and African-American students (25%). This association did not
change when obstetrics/gynecology was removed from the primary care category.
There was no significant association between rural, urban or suburban background and
primary care specialty choice, regardless of whether obstetrics/gynecology was included in the
primary care specialty category (p=0.828 if obstetrics/gynecology was considered a primary
care specialty; p = 0.475 if not).
Influential Factors in Specialty Decision
Overall, students reported that work satisfaction and intellectual satisfaction were the
most important factors influencing their specialty decision, with 79.7% of students indicating
work satisfaction was very important and 56.7% of students indicating that intellectual
satisfaction was very important (see Table 2). Students felt that financial compensation and
length of training were less important, as 70.2% of students indicated financial compensation
was less important and 82.6% of students indicated that length of training was less important.
In a comparison of the importance of factors between those choosing a primary care
specialty and those choosing a non-primary care specialty, the importance of only two factors
were significantly different between the two groups: financial compensation and sense of doing
good (see Tables 3 and 4). More of the students choosing primary care (85.3%) indicated that
financial compensation was least important compared to students choosing a non-primary care
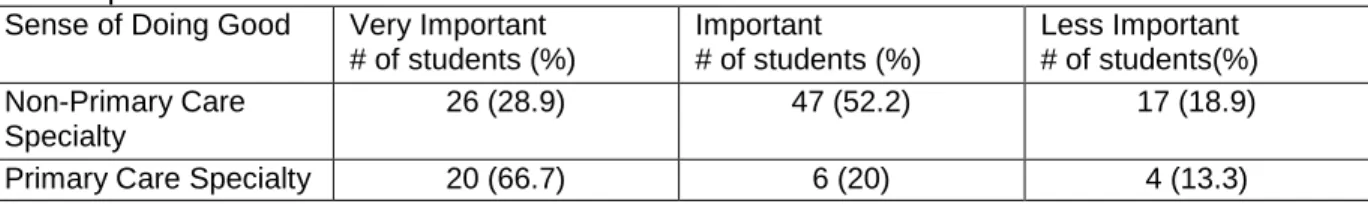
specialty (64.4%) (p = 0.034). More students choosing primary care rated a sense of doing
good as very important (66.7%) compared to those choosing a non-primary care specialty
(28.9%) (p = 0.001). Of note, the difference in the relative importance of intellectual satisfaction
18
specialties ranking this as very important than was true of the students choosing primary care
specialties.
When general obstetrics/gynecology was not considered a primary care specialty, the
association between financial compensation and primary care choice remained (p <0.001), and
the association between sense of doing good and primary care choice remained (p<0.001).
The difference in the relative importance of intellectual satisfaction between those choosing
primary care specialties (not including obstetrics/gynecology) and those choosing non-primary
care specialties became significant: more students choosing a non-primary care specialty
(62.8%) ranked intellectual satisfaction as very important compared to those choosing a primary
care specialty (34.6%) (p =0.028).
Twenty-seven students said that variables beyond those explicitly presented in the
survey were also influential in their decisions. I grouped the responses into five categories:
location (n=5), family (n=3), future opportunities and career flexibility (n=7), characteristics of
practice (n=6), and personal interest, enjoyment and people (n=6). Comments in the future
opportunities and career flexibility category ranged from ―ability to do international medicine‖ to
―flexibility in career options‖ to ―research opportunities.‖ Comments categorized as practice
characteristics included responses like ―breadth of knowledge and skills,‖ ―ability to do
procedures‖ and ―patient population.‖ Comments categorized as personal interest, enjoyment
and people ranged from ―it’s what I most enjoyed‖ to ―mentors‖ to ―personal interest.‖ See
Appendix C for all comments.
Consideration of Other Specialties
The majority of students (84.7%) considered other specialties before making their final
decision. This was true for both those choosing a primary care specialty (82.4%) and those
choosing a non-primary care specialty (85.5%).
Overall, the specialties students considered varied greatly (see Figure 2). The following
19
medicine (n=30), pediatrics (n=21), family medicine (n=20), medicine-pediatrics (n=20),
emergency medicine (n=19) and obstetrics/gynecology (n=19). Of those who considered other
specialties, 66.7% considered a primary care field (internal medicine, pediatrics, family
medicine, obstetrics/gynecology and medicine-pediatrics). This decreased to 58.1% of students
when obstetrics/gynecology was not considered a primary care field.
Of those students who chose a primary care specialty and considered other specialties,
82.1% considered at least one other primary field (internal medicine, pediatrics, family medicine,
medicine-pediatrics, obstetrics/gynecology). Of those students who chose a non-primary care
specialty and considered other specialties, 61.4% considered at least one primary care field.
This difference approached but did not quite achieve significance as determined by Pearson’s
chi-square test (p= 0.060), likely as a result of the interaction of relatively small sample size and
a relatively skewed distribution, with most students in both groups saying that they had at least
considered a primary care field.
If obstetrics/gynecology was not considered a primary care field, the percentages
differed slightly. Of those students choosing a primary care specialty and considering other
specialties, 75% considered at least one other primary care field. Of those students choosing a
non-primary care specialty and considering other specialties, 53.1% considered at least one
primary care field. This difference, once again, approached significance (p = 0.064) without
quite achieving it.
When asked about why they did not choose the other specialties they considered, 101
students provided comments. Seven thematic categories emerged from these comments:
intellectual satisfaction, lifestyle, work environment or satisfaction, residency training, medical
school experiences, general personal fit or enjoyment, and future goals (see Appendix D for all
comments and categories). The total number of coded values or themes was 134. Students
most commonly cited work environment or satisfaction (n=53 comments, 39.6%), which
20
within the field.‖ Students also commonly cited lifestyle (n=19 comments, 14.2%), intellectual
satisfaction (n=15 comments, 11.2%), general personal fit or enjoyment (n=15, 11.2%), and
training (n=13 comments, 9.7%).
The comments from both groups – those choosing a primary care specialty (including
obstetrics/gynecology) and those choosing a non-primary care specialty – shared some
similarities. Both groups most frequently commented that work satisfaction was a deciding
factor (36.6% of the coded values and 40% of the coded values, respectively). The second
most frequent comment category among those choosing primary care was training (19.5% of
the coded values compared to 5.4% of the coded values from those not choosing primary care).
The second most frequent comment category among those choosing a non-primary care
specialty was lifestyle (16% of coded values compared to 9.8% of coded values from those
choosing primary care specialties).
Specialty Intention at Matriculation
Students were interested in a variety of specialties at matriculation. The following
specialties were considered by the most students: internal medicine (n=28), pediatrics (n=24),
family medicine (n=13), obstetrics/gynecology (n=10), and orthopedic surgery (n=10). Overall,
43.1% (n=53) of students chose the specialty (or one of the specialties) they were interested in
at matriculation. Of those students choosing a non-primary care specialty, 61.1% (n=33) chose
a specialty they were interested in at matriculation. Of those students choosing a primary-care
specialty, 45.5% (n=90) chose a specialty they were interested in at matriculation. This
difference was not significant.
Those students selecting a primary care specialty were more likely to consider a primary
care field specialty (internal medicine, family medicine, pediatrics, medicine-pediatrics,
obstetrics/gynecology) compared to those students selecting a non-primary care specialty. Of
21
matriculation compared to 46.7% (n=42) of those choosing a non-primary care specialty. This
difference was significant (p<0.001).
If we take obstetrics/gynecology out of the primary care group, the trend persists. Of
those choosing a primary care specialty, 66.7% (n=22) were interested in a primary care field at
matriculation compared to 41.1% (n=37) of those choosing a non-primary care specialty. This
difference was significant (p = 0.015).
Medical School Experiences
I asked students an open-ended question about whether anything in medical school
changed their matriculating specialty intent, and 73 students commented. Five thematic
categories became apparent: clinical, preclinical (preclinical clinical experiences, basic science
courses), residents/faculty (personalities of faculty and residents and mentors), other
experiences (such as international experiences or graduate school), and other. The total
number of coded values was 85.
The overwhelming majority of coded values (n= 65, 76.5%) were comments about
clinical experiences and rotations. There were eight comments (9.4%) about residents, faculty,
and role models; 5 comments (5.9%) about other experiences; and 4 comments (4.7%) about
preclinical experiences (see Appendix E for the all comments and categorization).
Future Plans
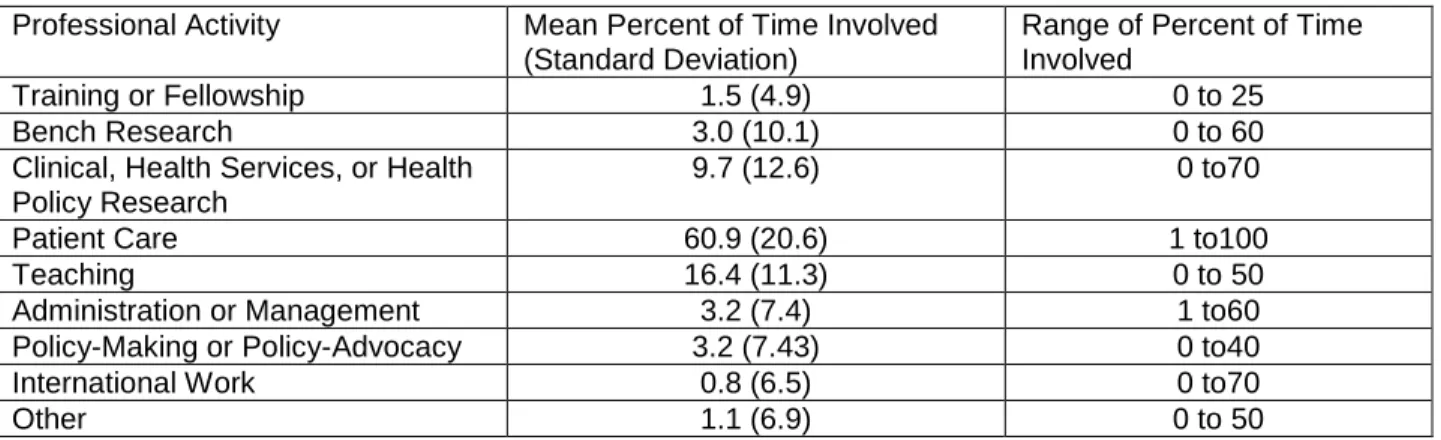
Students indicated they planned diverse careers in the future. Overall, students planned
to spend 60.9% of their time in patient care, 16.4% of their time teaching, and 9.7% of their time
in clinical, health services or health policy research (see Table 5). Most students (n=121)
planned to be involved with patient care, and many students (n=103) planned to be involved
with teaching (see Table 6).
Few differences in expectations about future careers emerged (Table 7). Those
choosing a primary care career were more likely to predict spending a greater percentage of
22
significant differences. This did not change if obstetrics/gynecology was not considered a
primary care specialty.
Discussion
The study response rate of 84.4% was very high and a strength of the study. However,
given the small sample size and therefore the small subgroups (e.g. African Americans, those
choosing neurosurgery), it is important to evaluate the representativeness of the study sample
regardless of the high response rate.
The survey respondents were largely representative of all the UNC students who were
receiving their match results that day in terms of sex and specialty choice and, to a limited
extent, ethnicity. Only one specialty (ophthalmology) was not represented in the survey, and
those students who did not take the survey chose specialties in both primary care fields (n=10
students) and non-primary care fields (n=13 students), although it is impossible to determine the
subspecialty intentions for these students. While ethnicity data were not available for those
students who matched (n=147), the distribution of self-reported ethnicities from the graduating
class (n=157) can be compared to the distribution of the survey to evaluate (approximately) the
potential for respondent bias with regards to ethnicity. The proportions of Caucasian/White and
Asian students were similar in each dataset; the proportion of African American students who
responded to the survey was much lower than the proportion in the entire class. It is difficult to
know if this is due to missing survey data (i.e. those who did not disclose an ethnicity on the
survey) or a difference between those who matched and the entire class. However, it is
important to realize this potential difference.
Overall, the study population represented the source population well, and therefore, the
potential for respondent bias is limited.
23
While the majority of students planned to subspecialize, the more significant finding is
the proportion of those planning to subspecialize within a primary care field (internal medicine,
pediatrics, obstetrics/gynecology, family medicine, and medicine-pediatrics). This trend of
subspecialization within primary care fields is not unique to UNC. Data from the AAMC’s GQ
from 2009 and 2010 found that 73% and 73.7% (respectively) of students choosing family
medicine, internal medicine, and pediatrics planned to subspecialize (Anderson and Cantow
2009;Anderson and Cantow 2010). However, with 50% of those choosing to specialize within
family medicine, internal medicine and pediatrics (57% if those uncertain about
subspecialization are grouped as planning to subspecialize), a lower proportion of UNC
students choosing primary care fields seem to plan to subspecialize.
Twenty-eight percent of the graduating class, therefore, planned to practice in primary
care. This is only slightly lower than the current workforce estimates of practicing primary care
physicians (American Medical Association 2011). However, if general obstetrics/gynecology is
not considered a primary care specialty, the percentage drops to 23%, which is significantly
lower than the current workforce estimates. This may reflect the continuing trend of choosing
non-primary care specialties, although the NMRP reported in 2011 that, for the second year,
more medical students matched into family medicine, pediatrics and internal medicine (National
Resident Matching Program 2011).
The analysis of subspecialization and categorization of primary care specialties is limited
by the fact that these plans and intentions may change during residency. A survey querying
students’ career plans in their final year of residency would provide more accurate information.
However, because this study focused on the choices and intentions of medical school and the
effect of medical school experiences on the specialty decision and because specialty choice is
likely influenced by subspecialty intentions (i.e. an interest in cardiology will result in a choice of
internal medicine), I felt that analyzing the data based on planned intentions was the best, most
24 Demographic Associations
The association between sex and primary care choice is consistent with the literature
(Jeffe, Whelan, and Andriole 2010, 947-958;Bland, Meurer, and Maldonado 1995, 620-641);
however, the association between race and ethnicity and primary care choice is not (Jeffe,
Whelan, and Andriole 2010, 947-958;Meurer 1995, 388-397). This association may be
explained by confounding factors, and may not remain in a multivariable analysis. The
categorization of multiple ethnicities (Chinese, South Asian, and Indian) may have also affected
this analysis. Additional data about UNC students to increase the sample size is necessary
before drawing any firm conclusions.
The lack of association between rural background and primary care choice may be due
to the small sample size, as very few students indicated their background as rural, and the
literature has proved this association well. Alternatively, North Carolina has two state medical
schools, Brody School of Medicine at East Carolina University (ECU) and UNCSOM. ECU is
located rurally, has a primary care focused mission, and may attract more in-state students
interested in rural primary care medicine.
Influential Factors
Students overwhelmingly identified work satisfaction and intellectual satisfaction as the
most important factors in their specialty choice. This was a prominent theme throughout the
open-ended responses, as well, as students most commonly cited work satisfaction as an
important factor in dissuading them from other considered specialties. In addition, the majority
of comments about influential medical school experiences were about clinical rotations. These
clinical rotations introduce students to the practice characteristics and intellectual challenges of
specialties—which may be why these experiences seemed so influential. This all suggests that
work and intellectual satisfaction are very important in specialty choice. While the literature
25
2008, 1154-1164;Fincher and Lewis 1999, S121-3), the importance of the effect had not been
considered or determined.
The lack of importance given to financial compensation was surprising. There is the
potential that students were potentially influenced by social desirability, as they were aware that
I (one of their colleagues) would be examining the surveys and may be able to identify them
based on the demographic information collected. It is also possible that students, in the
anticipation of receiving their match results, were not considering their debt level or loans, which
may influence the importance of financial compensation. Alternatively, because the tuition for
in-state students is quite low at UNC-SOM, UNC students graduate with significantly less debt
than do students at other schools (Association of American Medical Colleges 2011), and
therefore their specialty decisions may be less affected by financial compensation. With these
caveats in mind, however, it may be true that future income expectations are genuinely less
important to students than the literature and the popular press have often supposed.
Those choosing primary care specialties attributed less importance to financial
compensation and more importance to a sense of doing good than those choosing non-primary
care specialties. This is congruent with current literature (Kassebaum, Szenas, and Schuchert
1996, 198-209;Phillips et al. 2010, 616-622;Bazargan et al. 2006, 1460-1465;Jeffe et al. 2007,
888-894). However, this association may be confounded by the timing of the survey. At the
time of the survey, students had already chosen a specialty and those entering primary care
may have already accepted receiving less financial compensation in their career. Therefore,
they may have ranked financial compensation of lower importance in the anticipation of
receiving lower financial compensation.
Those students choosing a non-primary care specialty attributed more importance to
intellectual satisfaction as compared to those choosing a primary care specialty, although this
26
specialty. However, this does echo some findings in the literature (Kassebaum, Szenas, and
Schuchert 1996, 198-209;Meurer 1995, 388-397).
Finally, very few students commented when asked if factors other than those listed
influenced their specialty decisions, and students identified location, family, personal fit, and
future opportunities and career flexibility (practice characteristics comments were similar to work
satisfaction). Because the literature suggests that multiple factors are involved in specialty
decision-making, the paucity of answers may lend weight to Pathman and Agnew’s assertion
that medical students cannot accurately identify influential factors (Pathman and Agnew 1993,
203-207).
Consideration of Other Specialties
The majority of students considered other specialties before their final decision, but the
specialties considered did not differ significantly between those choosing a primary care
specialty and those choosing a non-primary care specialty. This was surprising, but also
interesting as it may suggest that students explore several different specialties throughout
medical school.
The themes of the comments largely echoed factors already mentioned earlier in the
survey (e.g. length of training, work satisfaction, lifestyle); no comments mentioned financial
concerns as an important factor.
As mentioned above, work satisfaction was a significant dissuading or persuading factor
when considering other specialties for both those choosing primary care and those choosing
non-primary care. However, the second most frequent comments differed between the two
groups—those choosing a non-primary care specialty more frequently indicated lifestyle and
those choosing a primary care specialty more frequently indicated training as an important
deciding factor. While no definitive conclusions can be made (as not all students commented),
this may suggest that lifestyle is more important to those choosing non-primary care specialties,
27 Specialty Intentions at Matriculation
A surprisingly large proportion of students chose a specialty that they considered at
matriculation. This is in contrast to Bland et al.’s findings that most medical students change
their specialty decision during medical school (Bland, Meurer, and Maldonado 1995, 620-641)
and may suggest more stability to matriculation intent. Those indicating a preference for a
primary care field at matriculation were significantly more likely to choose a primary care
specialty, which is consistent with the literature (Kassebaum, Szenas, and Schuchert 1996,
198-209;Colquitt et al. 1996a, 399-411). While most students consider other specialties, there
seems to be some stability of matriculation choice for both students choosing primary care
specialties and non-primary care specialties.
Students reported that that clinical rotations and experiences influenced their specialty
decisions significantly. In contrast, and likely consistent with the literature, very few students felt
their preclinical experiences influenced their specialty decisions (Bland, Meurer, and Maldonado
1995, 620-641). However, it is difficult to determine the effect of medical school experiences
with this qualitative data, and the data is likely significantly limited by recall bias (as clinical
rotations were the most recent experience the majority of these students had).
Future Plans
UNC students indicated they anticipate a diversity of activity within their chosen career
path. The analysis about future career plans was likely limited by the small sample size, but,
nonetheless, found only one significant difference between those choosing a primary care
specialty and those choosing a non-primary care specialty: students choosing a primary care
specialty are more likely to anticipate spending more time in policy advocacy work. This finding
may be confounded by differences in personal values—such as sense of good (as found in this
study) or altruism or beliefs about the health care systems (as found in the literature) (Phillips et
al. 2010, 616-622).
28
This cross-sectional study is limited by the small sample size, which limited the power of
the analysis. In addition, the external validity of this study is limited, as students from one public
medical school were surveyed. This study is also limited by the study design, as the
cross-sectional design of the study invites the potential of bias by confounding. While some factors
known to influence specialty choice were included in the model, many were not. While the
timing of the survey was generally a strength of this study, there is the potential for recall bias.
In addition, the survey instrument was likely not valid or reliable and may not have solicited
accurate findings about the specialty decision due to Pathman and Agnew’s introspective causal
bias (Pathman and Agnew 1993, 203-207). Additionally, the analysis was based on students’
plans to subspecialize, and there is a possibility that plans may change during residency.
I also grouped many diverse specialties into two categories, primary care specialties and
non-primary care specialties. Multiple authors have documented that different factors influence
different primary care specialties; therefore, this categorization may be too broad and obscure
the importance of some factors. That said, there are similarities between the primary care
specialties—such as prevention, diversity of patients, lower financial compensation—that likely
make this analysis valuable.
The study response rate was very high, which increases the strengths of these results.
In addition, selection bias is limited based on the comparison of the respondents and
non-respondents. The timing of this study was also a strength, as fourth-year students had
committed to a specialty, but were not yet aware of their match results (preventing
disappointment or happiness from interfering with the survey responses). While the
open-ended questions may have introduced bias, the responses also provided interesting and unique
information. Therefore, these study findings still present interesting and valuable information
about how UNC medical students make their specialty choices.
29
Despite different projections of the adequacy of our primary care physician workforce in
the coming years, PPACA will not only increase access to our health care system, thereby likely
increasing the demand for primary care physicians, but will also attempt to re-build primary care
with new models of care, new reimbursement plans, and educational initiatives. But, will these
new policies help reverse the trend of declining medical student interest in primary care such
that the primary care workforce can respond to the demand? If not, what can reverse this trend
to increase the proportion of primary care physicians in the workforce?
An understanding of why students select the specialty choices that they do is critical to
answering these questions. This study, although significantly limited by confounding bias and
poor generalizability, does offer some insight.
First, UNC medical students identified work satisfaction and intellectual satisfaction as
very influential factors—more influential than financial compensation, lifestyle, and length of
training. While UNC’s low debt level may influence these findings and limit the generalizability,
the importance of work satisfaction and intellectual satisfaction was evident throughout the
survey.
The importance of these factors hints at the complexity of specialty decisions. Medical
students’ expectations of work satisfaction and intellectual satisfaction are likely driven by
perceptions of the actuality of different specialties, and these perceptions are likely influenced
by a variety of experiences, personal values, and life situations. Based on the qualitative survey
responses, medical education certainly affects these perceptions—students most frequently
cited work environment and practice characteristics perceptions as gleaned from their clinical
experiences in medical school as important factors and identified clinical rotations as an
influential part of medical school.
But, clinical medical education inherently relies on the actuality of practice—that is,
students are educated with and in real, clinical experiences. Medical students learn about
30
and the intellectual challenges through their medical education—which shape their perceptions
and thoughts about their future careers.
Other experiences outside of medical school—such as personal experiences with health
care or physician family members or growing up in a rural town—also likely shape expectations
of work satisfaction and intellectual satisfaction.
Therefore, identifying work satisfaction and intellectual satisfaction as important factors
influencing specialty decisions not only reveals the complexity of the decision, but also the
challenge of a solution. Theoretically, policies to reverse the declining interest of medical
students in primary care should target the most influential factors. But, ―targeting‖ work
satisfaction and intellectual satisfaction is difficult, as so many different experiences, situations,
and values influence these factors. In addition, other factors, such as financial compensation,
likely exert some influence over the specialty decision. Much like health care policy, there is not
one target.
The closest thing to one ―target‖ is the identification of specialty choice at matriculation.
Consistent with the literature, I found that interest in primary care at matriculation did seem to
predict eventual primary care career choice. Therefore, admission policies selecting for
students interested in primary care may actually be successful in increasing the number of
students choosing a primary care specialty. Indeed, schools with strong primary care missions
likely already do this—formally or informally. However, medical school admission policies are
certainly not subject to national regulation, and this type of policy may not be enough to
increase the supply of primary care physicians. But, it may be somewhere for medical schools
to start.
Deciphering how medical students make specialty decisions is difficult and challenging.
Certainly, many have made efforts to understand the process in an attempt to understand the
declining trends, and the results have been both consistent and inconsistent. Further research,
31
increase the proportion of primary care doctors in our health care system—leading perhaps to
32 Tables and Figures
Figure 1: Class of 2011 Residency Match Results (Official UNC-SOM/NRMP Data and Survey Data)
0 5 10 15 20 25 30 35
Class of 2011 Residency Match Results
number of students (school data)
33
Figure 2: Number of Students Considering Specialties and the Number of Students Choosing Specialties
Please note that students also considered developmental pediatrics (n=1), neurodevelopmental disabilities (n=1), geriatrics (n=2), oncology (n=1), and cardiothoracic surgery (n=1), but no students chose these specialties.
0 5 10 15 20 25 30 35 40
Other Specialties Considered By Students
34
Table 1: Subspecialization Intentions Within Primary Care Fields
Specialty Choice Plan to Subspecialize Unsure Do Not Plan to Subspecialize
Family Medicine (n=14)
5 0 9
Internal Medicine (n=22)
14 4 4
Medicine-Pediatrics (n=5)
2 0 3
Pediatrics (n=15) 7 0 8
Ob-Gyn (n=13) 8 0 5
Table 2: Relative Importance of Six Factors in Specialty Choice (all students)
Factor Very Important # of students (%)
Important # of students (%)
Less Important # of students(%) Financial
Compensation (n=124)
7 (5.7) 30 (24.2) 87 (70.2)
Intellectual Satisfaction (n=120)
68 (56.7) 40 (33.3) 12 (10)
Work Satisfaction (n=118)
94 (79.7) 21 (17.8) 3 (2.5)
Lifestyle (n=118) 28 (23.7) 67 (56.8) 23 (19.5)
Sense of doing good (n=120)
46 (38.3) 53 (44.2) 21 (17.5)
Length of Training (n=121)
2 (1.7) 19 (15.7) 100 (82.6)
Table 3: Comparison of Relative Importance of Financial Compensation between Students Choosing Primary Care Specialties (including Ob-Gyn) and Students Choosing Non-Primary Care Specialties
Financial Compensation
Very Important # of students (%)
Important # of students (%)
Less Important # of students(%) Non-Primary Care
Specialty (n=90)
5 (5.6) 27 (30) 58 (64.4)
Primary Care Specialty (n=34)
2 (5.9) 3 (8.8) 29 (85.3)
Table 4: Comparison of Relative Importance of Sense of Doing Good between Students Choosing Primary Care Specialties (including Ob-Gyn) and Students Choosing Non-Primary Care Specialties
Sense of Doing Good Very Important # of students (%)
Important # of students (%)
Less Important # of students(%) Non-Primary Care
Specialty
26 (28.9) 47 (52.2) 17 (18.9)
35
Table 5: Overall Anticipated Mean Percent and Range of Time Involved in Professional Activities
Professional Activity Mean Percent of Time Involved (Standard Deviation)
Range of Percent of Time Involved
Training or Fellowship 1.5 (4.9) 0 to 25
Bench Research 3.0 (10.1) 0 to 60
Clinical, Health Services, or Health Policy Research
9.7 (12.6) 0 to70
Patient Care 60.9 (20.6) 1 to100
Teaching 16.4 (11.3) 0 to 50
Administration or Management 3.2 (7.4) 1 to60
Policy-Making or Policy-Advocacy 3.2 (7.43) 0 to40
International Work 0.8 (6.5) 0 to70
Other 1.1 (6.9) 0 to 50
Table 6: Number of Students Indicating Some Percentage of Time For Involvement, Mean Percent Involvement Time and Range of Involvement Time (of students indicating some involvement)
Professional Activity Number of Students Mean Percent of Time Involved
Range of Percent of Time Involved
Training or Fellowship 14 13.1 2 to25
Bench Research 15 24.3 5 to60
Clinical, Health Services, or Health Policy Research
67 17.7 1 to70
Patient Care 121 61.9 8 to100
Teaching 103 19.6 2 to50
Administration or Management
34 11.4 1 to 60
Making or Policy-Advocacy
38 11.2 1 to40
International Work 4 25 10 to70
Other 4 33.8 5 to50
Table 7: Comparison of Mean Percent Involvement Time Between Those Choosing Primary Care and Non-Primary Care*
Professional Activity Mean Percent of Time Involved (Non-Primary Care)
Mean Percent of Time Involved (Primary Care)
Training or Fellowship 1.7 0.8
Bench Research 3.3 2.1
Clinical, Health Services, or Health Policy Research
10.2 8.1
Patient Care 60.9 60.8
Teaching 15.9 17.8
Administration or Management 2.9 3.8
Making or Policy-Advocacy
2.6** 5.9**
International Work 0.9 0.6
Other 1.5 0
*The mean percentages and significance did not differ when primary care specialties did not include general obstetrics/gynecology
36
References
American College of Physicians. 2006. The impending collapse of primary care medicine and its implications for the state of the nation's health care: A report from the american college of physicians.
American Medical Association. 2011. Physician characteristics and distribution in the U.S. [serial].Earlier Title: Physician distribution and medical licensure in the U.S.; Phys. charact. distrib. U.S.; Physician characteristics and distribution in the United States. Chicago, Ill.: Survey & Data Resources, American Medical Association.
http://search.lib.unc.edu.libproxy.lib.unc.edu?R=UNCb1804302.
Anderson, M. B. and J. Cantow. 2009. 2009 GQ medical school graduation questionnaire: All schools summary report. Association of American Medical Colleges, ,
https://www.aamc.org/download/90054/data/gqfinalreport2009.pdf.
———2010. 2010 GQ medical schools graduation questionaire: All schools summary report.
Association of American Medical Colleges, ,
https://www.aamc.org/download/140716/data/2010_gq_all_schools.pdf.
Association of American Medical Colleges, "Medical School Missions Management Tool 2011: Prepared for University of North Carolina at Chapel Hill School of Medicine" 2011).
Barrett,F. A., M. S. Lipsky, and M. N. Lutfiyya. 2011. "The Impact of Rural Training Experiences on Medical Students: A Critical Review." Academic Medicine : Journal of the Association of American Medical Colleges 86 (2) (Feb):259-63.
Basu,J., B. Friedman, and H. Burstin. 2002. "Primary Care, HMO Enrollment, and
Hospitalization for Ambulatory Care Sensitive Conditions: A New Approach." Medical Care
40 (12):1260-9.
Basu,Jayasree J. 2004. "Managed Care and Preventable Hospitalization among Medicaid Adults." Health Services Research 39 (3):489-510.
Bazargan,M., R. W. Lindstrom, A. Dakak, C. Ani, K. E. Wolf, and R. A. Edelstein. 2006. "Impact of Desire to Work in Underserved Communities on Selection of Specialty among Fourth-Year Medical Students." Journal of the National Medical Association 98 (9) (Sep):1460-5.
Bland,C. J., L. N. Meurer, and G. Maldonado. 1995. "Determinants of Primary Care Specialty Choice: A Non-Statistical Meta-Analysis of the Literature." Academic Medicine : Journal of the Association of American Medical Colleges 70 (7) (Jul):620-41.
Bodenheimer,T., E. Chen, and H. D. Bennett. 2009. "Confronting the Growing Burden of
Chronic Disease: Can the US Health Care Workforce do the Job?" Health Affairs 28 (1):64.