Exploring Self-Regulation: Delay of Gratification and Executive Function in 42-Month-Old Toddlers
By
Kimberly Hoover
Senior Honors Thesis
Department of Psychology and Neuroscience University of North Carolina at Chapel Hill
April 25, 2018
Approved by:
Dr. Barbara Davis Goldman, Committee Chair
ACKNOWLEDGMENTS
I would like to thank the Department of Psychology and Neuroscience for giving me the opportunity to write an honors thesis. To my committee, Dr. Rebecca Stephens, Dr. Barbara Davis Goldman, and Dr. Peter Ornstein, I am extremely grateful for your assistance and
guidance throughout my project. I would also like to thank my fellow research assistants in my laboratory who assisted with the administration of the tasks and the coding process. Most of all, I would like to express my sincere gratitude to my advisor, Dr. Rebecca Stephens, for her
ABSTRACT
Self-regulation in early childhood has often been measured by children’s performance on delay-of-gratification tasks and been linked to a range of cognitive, social, and emotional
Exploring Self-Regulation: Delay of Gratification and Executive Function in 42-Month-Old Toddlers
How does a child choose to spend his allowance? Does he spend his money each week on a candy bar or does he save his money to buy a video game? Children utilize self-regulation each time they make this decision. The ability to self-regulate is essential in everyday life for making decisions and planning for the future. The behaviors measured by this construct enable an individual to control impulses (Bodrova & Leong, 2005) and are utilized for goal-directed behaviors that require motivation despite obstacles and distractions (Hofmann, Schmeichel, & Baddeley, 2012). In the present study, self-regulation is assessed by measuring children’s ability to delay gratification and regulate behavior using their executive function skills.
Delay of gratification is the process of forgoing immediate gratification in order to receive a more valuable outcome later and has been studied primarily in children (Levesque, 2011; Mischel, 2012). Children who are able to delay gratification adapt better to school (McIntyre, Blacher, & Baker, 2006) and are more likely to follow directions given by a teacher (Bodrova & Leong, 2005). In addition, they show greater academic success and exhibit a higher ability to resist temptation, which has been shown to help individuals achieve more long-term goals (Bembenutty & Karabenick, 2004). Delay of gratification is also correlated with greater career success and better interpersonal relationships in adulthood (Newman et al., 1997). Children who struggle with delaying gratification are more likely to exhibit greater
Given the association between a child’s ability to delay gratification and developmental outcomes, there has been a focus on developing ways to assess this construct. Two paradigms – choice and maintenance – have typically been used to measure delay of gratification (Imuta, Hayne, & Scarf, 2014). Choice paradigms include multiple trials in which the participant is presented with a small and large reward (Imuta, Hayne, & Scarf, 2014; Hongwanishkul, Happaney, Lee, & Zelazo, 2005; Lemmon & Moore, 2007). The participant must choose between immediately receiving a small reward or receiving a larger reward after a delay. Maintenance paradigms include one trial in which the dependent variable is how long the participant maintains the decision to wait for a reward (Imuta, Hayne, & Scarf, 2014; Atance & Jackson, 2009). One of the most famous and commonly used delay of gratification tasks is a self-imposed delay paradigm called the “marshmallow task” (Mischel & Ebbessen, 1970; Mischel, 1974). The participant is left alone in a room with one marshmallow. The child can either eat the marshmallow immediately or receive an additional marshmallow if he or she waits until the experimenter returns. The participants’ delay abilities are assessed by their actions when left alone and by measuring the amount of time that they wait. Children who are able to resist eating the marshmallow and wait for the delayed reward exhibit more developed self-regulation than their peers who cannot wait (Mischel, 2012; Mischel, 1974; Mischel & Ebbessen, 1970).
children created their own strategies in order to distract themselves and diverted their attention away from the rewards (Mischel, 1974). When preschool-age children are exposed to rewards and are not provided with strategies, Mischel (1974) proposed that they must create their own strategies in order to cope with the task. Children’s behavior under these conditions reveals individual differences in self-control. The length of the delay is a combined product of the individual’s coping strategies and the challenges put forth in the delay situation, such as no cues being provided by the experimenter (Peake, Hebl, & Mischel, 2002).
Most of the research on delay of gratification has been limited to children above four years of age because such tasks are difficult to administer when participants are younger. Traditional delay-of-gratification paradigms have been altered in some studies with participants younger than four to allow them to complete the tasks (Mittal, Russell, Britner, & Peake, 2013). For example, researchers often choose resistance to temptation (i.e. toys, stickers) procedures rather than self-imposed delay paradigms for younger children (Grolnick, Bridges, & Connell, 1996; Silverman & Ippolito, 1995).
whereas “cool” executive function represents the cognitive aspects of this broad construct (Zelazo & Müller, 2002).
The development of executive function is protracted due to the complex nature of these cognitive abilities (Levin et al., 1991). The prefrontal regions of the brain responsible for executive function are not fully mature until adulthood, but there is substantial development of this region during the preschool years (Garon, Bryson, & Smith, 2008; Wiebe et al., 2011). In older children and adults, executive function has three components: mental set shifting,
information updating, and response inhibition (Miyake et al., 2000). Although this three-factor structure has also been applied to early childhood executive function (Garon, Bryson, & Smith, 2008), most research suggests that when executive function is first emerging, it is represented by one undifferentiated factor (Wiebe et al., 2011).
Executive function is important to study in children because it is linked to many long-term outcomes. Executive function is associated with academic achievement in middle (Blair & Razza, 2007; Monette, Bigras, & Guay, 2011; Viterbori, Usai, Traverso, & De Franchis, 2015) and late childhood (Sikora, Haley, Edwards, & Butler, 2002; van der Sluis, de Jong, & van der Leij, 2007). It is also linked to social-emotional competence (Riggs, Jahromi, Razza, Dillworth-Bart, & Mueller, 2006), affect (Raaijmakers et al., 2008) and level of adaptive functioning (Blair & Peters, 2003). Deficits in executive function are associated with a variety of cognitive deficits, including impaired reasoning, planning, monitoring, concept formation, mental flexibility, motivation, social judgement, and aspects of attention and awareness (Anderson, 2002; McDonald, Flashman, & Saykin, 2003). Furthermore, deficits in executive function are
Ozonoff, 1996).
Given the value of executive function and self-regulation in regards to later developmental outcomes, it is important that we have a range of valid measures to better understand early development. In early childhood, the most common measures of executive function are parent-report questionnaires and performance-based tasks (Toplak, West, & Stanovich, 2013). When using multiple methods of measurement, there is an underlying
assumption that they measure the same aspect of a construct. However, research on measures of executive function has shown that laboratory tasks and questionnaires are not highly correlated (Toplak, West, & Stanovich, 2013). In a review of 13 studies that examined the association between performance on laboratory tasks of executive function and a rating measure of executive function, the Behavior Rating Inventory of Executive Function (Gioia, Isquith, Guy, &
Kenworthy, 2000), the association between the two types of measures was weak (Toplak, West, & Stanovich, 2013). The present study was designed to further examine the relationship between laboratory tasks and parent-reported measures of behaviors related to executive function.
The exact reasons for this discrepancy between parent-report questionnaires and performance-based tasks are unknown. The relationship may be mediated by environmental variables, such as the artificial context in which performance-based measures are obtained (McAuley, Chen, Goos, Schachar, & Crosbie, 2010; Nilsen, Huyder, McAuley, & Liebermann, 2017). The administration, scoring, and task demands differ between the two types of
performance on laboratory tasks of executive function has been linked to academic ability (McClelland et al., 2007; St. Clair-Thompson & Gathercole, 2006), risk of grade repetition (Biederman et al., 2004), and achievement on standardized exams (Gathercole & Pickering, 2000; Jarvis & Gathercole, 2003). Despite the apparent discrepancies in the outcomes of the measures, it is proposed that using both types of measures provides a more complete
characterization of an individual’s strengths and weaknesses (Anderson, V., Anderson, P., Northam, Jacobs, & Mikiewicz, 2002).
The aim of this study is to discern the relation between parental reports of children’s executive function and laboratory studies of their delay-of-gratification abilities. Delaying gratification requires inhibition, future-oriented planning, and self-regulation. Therefore, performance on delay-of-gratification tasks should be directly related to assessments of
executive function. This study will utilize two delay of gratification tasks and two parent reports of executive function. It is hypothesized that:
1. Children will exhibit similar behaviors on the two delay of gratification tasks. The scores on the delay of gratification tasks will correlate with each other.
2. Parents will report similar levels of executive function ability on the two parent reports. The scores on the two parent-report measures will correlate with each other. 3. Children’s performance on the delay of gratification tasks will correlate with parent
reports of executive function. Performance on the laboratory tasks will correlate with scores on specific subscales/indices of the parent reports of executive function.
The participants were a subset of a larger, longitudinal study of cognitive development in early childhood. Participants included children who were within one month of turning 42 months of age and their parents. There were 98 parent-child dyads. The majority of the sample was White, and parents reported high levels of education and household income (See Table 1). For the parent reports, all but one responder was the child’s mother. For the one father who responded, the mother’s education level was selected for the analysis. Child participants were included if they completed at least one of the delay of gratification tasks and had complete data for at least one of the parent report measures. Exclusion criteria included incomplete data, administration errors, participant refusal, lack of understanding of task, or technological errors (See Table 2). Procedure
The parents completed two parent-report measures of executive function (described below) before bringing their children into the lab. When visiting the lab, the children completed a variety of tasks, including two delay-of-gratification tasks: the Sticker Delay Task and the Tower Delay Task. Both tasks were measures of delay inhibitory control, which is an indicator of self-regulation.
Behavior Rating Inventory of Executive Function – Preschool Version (BRIEF-P;
Gioia, Espy, & Isquith, 2003): This 63-item inventory evaluates various aspects of executive function in preschool-aged children. It is a parent report that has a 3-point Likert scale with the following options: 3 (often), 2 (sometimes), and 1 (never). Sample items include, “is unaware of how his/her behavior affects or bothers others” and “does not complete tasks even after given
directions.” The global executive composite (GEC) score is the total score for all of the items.
index (EMI: plan/organize + working memory items), inhibitory self-control index (ISCI: inhibit + emotional control items), and flexibility index (shift + emotional control items). The GEC and these 3 indices were the primary focus of this study.
Children’s Behavior Questionnaire – Short Form (CBQ-SF; Rothbart, Ahadi, Hershey,
& Fisher, 2001): This 94-item inventory evaluates temperament in children. It is a parent report measure in which each item is rated on a 7-point Likert scale that ranges from “extremely untrue of your child” to “extremely true of your child.” Sample items include “is good at following
instructions,” “often rushes into new situations,” and “is easily distracted when listening to a
story.” There are 15 subscales, but in this study the focus was on the three subscales that are
commonly tied to executive function and self-regulation: attentional focusing, impulsivity, and inhibitory control. For attentional focusing and inhibitory control, low scores correspond with deficits in these skills. For impulsivity, high scores correspond to more problematic behaviors.
Sticker Delay Task. This laboratory task was adapted from the Snack Delay Task created by Van Hecke et al. (2012). The experimenter and child participant sat on opposite sides of a small table facing each other. The experimenter explained that the child could win stickers if he/she followed certain rules. A sticker was placed under a clear plastic cup, and the child had to wait for the experimenter to ring the bell before he/she could retrieve the sticker. A practice trial was conducted. Then, each child completed seven trials with varying delay times (5 s, 10 s, 0 s, 20 s, 0 s, 30 s, 45 s). If the children did not wait the full time of each trial, they were allowed to keep the sticker but were reminded of the rules.
the child had to take turns placing the blocks on the tower. A practice tower was built to ensure the child understood the rules. For the trials, the experimenter would wait a set amount of time before placing her block (5 s, 10 s, 20 s, 30 s, 45 s). If the child did not wait his/her turn, the experimenter removed the participant’s block from the tower, reminded the child of the rules, and put the experimenter’s block on the tower, which signaled the end of the trial.
Coding of Tasks. The codebook for each task was adapted from prior studies: Sticker Delay (Van Hecke et al., 2012; Goldsmith, Reilly, Lemery, Longley, & Prescott, 1999) and Tower Delay (Kochanska, Murray, Jacques, Koenig, & Vandegeest, 1996; Durbin, Klein,
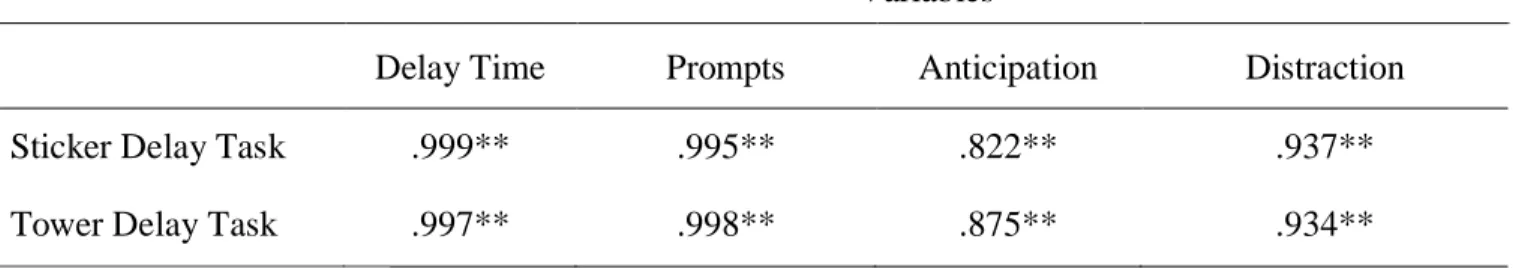
Hayden, Buckley, & Moerk, 2005). The Sticker Delay and Tower Delay Tasks were coded using the same variables: delay time, prompts, anticipation, and distraction. The tasks were coded using videotapes, and each task was coded by at least two different coders. Bivariate correlations were calculated to compare the rater’s scores; the reliability for each variable in each task can be seen in Table 3. Delay time is the number of seconds the child waited before retrieving the sticker or placing a block on the tower. The maximum score was 110 seconds. Prompts include discrete instances in which the child performed a behavior to move the trial forward, such as pointing to the bell in the Sticker Delay Task. The prompting behaviors were coded for number of behaviors, not intensity of prompts. Anticipation includes behaviors in which children were focused on the object of interest (cup, sticker, bell; blocks or tower). These anticipation
any behavior used by the child to shift his or her focus away from the object until the trial is over, such as running around the room or looking away for more than three seconds. The
distraction behaviors were coded based on intensity of the behavior as opposed to the number of distraction behaviors. The possible range of intensity level was 0 to 4. The highest level of distraction for each trial was recorded, and then an average score was calculated. A more detailed scoring guide for both tasks can be found in Appendix B. Four separate scores were used for the analyses in this study: total delay time, total number of prompts, highest level of anticipation, and highest level of distraction If the child did not delay for at least half of the trial time, the prompts, anticipation, and distraction variables for that specific trial were coded as missing. Low scores on prompts and anticipation behaviors reflect better self-regulation, whereas high scores on delay time and distraction reflect better self-regulation.
Results
Given established relations among demographic variables and executive function, gender and maternal education were considered for use as covariates. Independent samples t-tests comparing gender differences in both laboratory and parent-reported variables were not
significant (all p > 0.05). Additionally, there were no significant correlations between maternal education and any of the study variables (all p > 0.05). Therefore, these variables were not included as covariates in the following analyses.
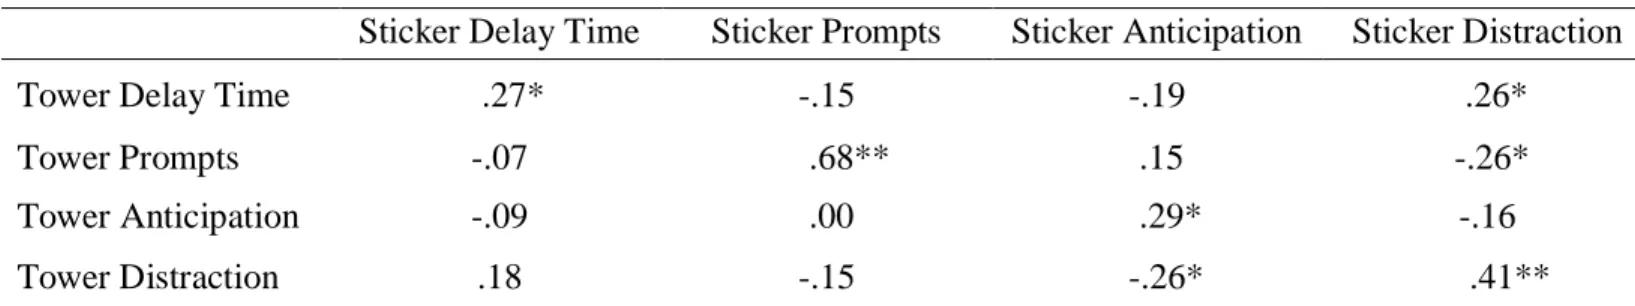
First, correlations among the two laboratory tasks were calculated. Low scores on prompts and anticipation behaviors reflect better self-regulation. High scores on delay time and distraction reflect better self-regulation. Therefore, prompts and anticipation were expected to be negatively correlated with delay time and distraction. About half of the relations were
statistically significant (see Table 5). The relations were in the expected directions.
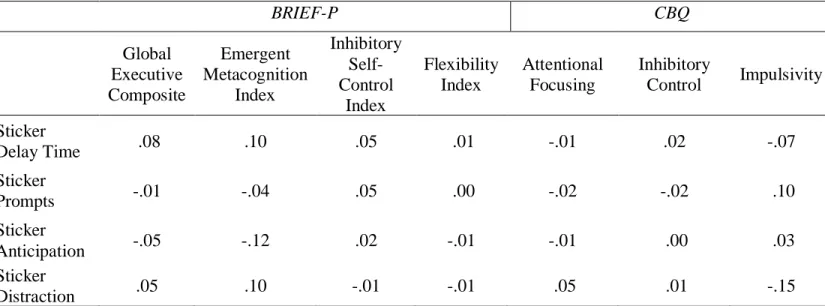
Second, correlations among the two parent reports were calculated. For the BRIEF-P, higher scores correspond to deficits in executive function. For the CBQ, low scores on
attentional focusing and inhibitory control but high scores on impulsivity correspond to deficits. Therefore, attentional focusing and inhibitory control were expected to be negatively correlated with the BRIEF-P scores, and impulsivity was expected to be positively correlated with the BRIEF-P scores. As reported in Table 6, most of these relations were statistically significant and relatively strong. The relations were in the expected directions.
Finally, correlations between the laboratory tasks and the parent reports were calculated. It was expected that the number of prompts and level of anticipation would be positively
were no significant correlations between the Sticker Delay Task and either of the two parent reports. As reported in Table 8, there were a few weak, significant correlations between the Tower Delay Task and the two parent reports. The statistically significant relations were in the expected directions.
Discussion
the mean delay time was found to be 60.10 seconds out of a maximum of 65 seconds, which is a relatively high mean delay time and comparable to children’s performance in the current study (Van Hecke et al., 2012). However, children in the Snack Delay Task did not complete a 45-second trial, which was added to the present study.
The significant differences in delay time, number of prompts, and highest level of distraction between the two tasks are important to note. In the Tower Delay Task, children waited less time and initiated more prompts than in the Sticker Delay Task, which suggests less self-regulation in the Tower Delay Task. However, the highest level of distraction was
significantly higher in the Tower Delay Task compared to the Sticker Delay Task, which suggests more engagement in self-regulation in the Tower Delay Task. This seemingly contradictory finding of more prompts and more distraction may be a reflection of children simply talking more because it was the last task administered or because they were
in the level of interest for getting a sticker or building a tower, that also could have affected motivation for self-regulation.
The data support the second hypothesis that parents will report similar levels of executive function ability on both of the parent report measures (BRIEF-P and CBQ). Some level of agreement between the two surveys was expected because they were both completed by parents (here, mothers) and included related items. Levels of executive function reported by parents on the BRIEF-P were specifically related to the levels of attentional focusing, impulsivity, and inhibitory control reported by parents on the CBQ. This relationship was expected because executive function encompasses a broad range of abilities, including attentional focusing, impulsivity, and inhibitory control, that are required for regulating behavior (Gioia, Isquith, Kenworthy, & Barton, 2002).
The data, however, do not support the third hypothesis that children’s performance on the delay of gratification tasks would correlate with parent reports of their executive function
abilities. This finding supports previous research that found low associations between parent reports and laboratory measures of executive function (Toplak, West, & Stanovich, 2013; McAuley, Chen, Goos, Schachar, & Crosbie, 2010). This finding may be explained, at least in part, by the highly-structured environment in which laboratory tasks are conducted that may not represent the child’s everyday environment (Nilsen, Huyder, McAuley, & Liebermann, 2017). Parent reports may be a better representation of a child’s abilities because parents observe their children across a wide range of contexts and multiple instances (McAuley, Chen, Goos,
Schachar, & Crosbie, 2010).
executive function items due to the distinction between “hot” and “cool” executive function (Hongwanishkul, Happaney, Lee, & Zelazo, 2005; Zelazo & Müller, 2002).The parent-report variables that were significantly correlated with the Tower Delay Task (i.e., inhibitory self-control, flexibility, and impulsivity) are more representative of the “hot” affective aspects than of the “cool” or cognitive aspects of executive function (Hongwanishkul, Happaney, Lee, & Zelazo, 2005). Delay of gratification paradigms are more commonly associated with “hot” executive function (Hongwanishkul, Happaney, Lee, & Zelazo, 2005). Although these two methods of evaluating children were not highly correlated, both types of indicators are important in forming a complete assessment of an individual child for research or clinical purposes (Anderson, V., Anderson, P., Northam, Jacobs, & Mikiewicz, 2002).
A strength of the study was that no strategies were provided to the children for performance on the tasks, and thus their behaviors during the delay tasks were reflective of differences in self-regulation abilities (Peake, Hebl, & Mischel, 2002). Many studies have focused on the relation between rating measures and performance on laboratory tasks of executive function (Toplak, West, & Stanovich, 2013; McAuley, Chen, Goos, Schachar, & Crosbie, 2010; Nilsen, Huyder, McAuley, & Liebermann, 2017). This study expands on the work that has been done by considering performance on laboratory-based tasks that have not
previously been compared to parent-reported measures of executive function.
Future studies could also examine the relationship between these laboratory tasks and parent reports across multiple time points.
References
Anderson, P. (2002). Assessment and development of executive function (EF) during childhood. Child Neuropsychology, 8, 71–82.
Anderson, V. A., Anderson, P., Northam, E., Jacobs, R., & Mikiewicz, O. (2002). Relationships between cognitive and behavioral measures of executive function in children with brain disease. Child Neuropsychology, 8(4), 231-240.
Atance, C. M., & Jackson, L. K. (2009). The development and coherence of future-oriented behaviors during the preschool years. Journal of experimental child psychology, 102(4), 379-391.
Bembenutty, H., & Karabenick, S. A. (2004). Inherent association between academic delay of gratification, future time perspective, and self-regulated learning. Educational psychology review, 16(1), 35–57.
Biederman, J., Monuteaux, M.C., Doyle, A.E., Seidman, L.J., Wilens, T.E., Ferrero, F., et al. (2004). Impact of executive function deficits and attention-deficit/hyperactivity disorder (ADHD) on academic outcomes in children. Journal of Consulting and Clinical
Psychology, 72, 757 – 766.
Blair, C., & Peters, R. (2003). Physiological and neurocognitive correlates of adaptive behavior in preschool among children in Head Start. Developmental neuropsychology, 24(1), 479-497.
Bodrova, E., & Leong, D. (2005). Self-regulation: A foundation for early learning. Principal, 85(1), 30–35.
Duku, E., & Vaillancourt, T. (2014). Validation of the BRIEF-P in a sample of Canadian preschool children. Child Neuropsychology, 20(3), 358-371.
Durbin, C. E., Klein, D. N., Hayden, E. P., Buckley, M. E., & Moerk, K. C. (2005).
Temperamental emotionality in preschoolers and parental mood disorders. Journal of abnormal psychology, 114(1), 28.
Eisenberg, N, & Fabes, R. A. (1992). Emotion, regulation and the development of social competence. In M. S. Clark (Ed.), Emotion and Social Behavior, 14, 119–150. Garon, N., Bryson, S. E., & Smith, M. (2008). Executive function in preschoolers: A review
using an integrative framework. Psychological Bulletin, 134, 31–60.
Gathercole, S.E., & Pickering, S.J. (2000). Working memory deficits in children with low achievements in the national curriculum at 7 years of age. British Journal of Educational Psychology, 70, 177 – 194.
Gioia, G. A., Isquith, P. K., Guy, S. C., & Kenworthy, L. (2000). Test review behavior rating inventory of executive function. Child Neuropsychology, 6(3), 235-238.
Gioia, G. A., Espy, K. A., & Isquith, P. K. (2003). BRIEF-P: Behavior Rating Inventory of Executive Function--Preschool Version. Psychological Assessment Resources.
Gioia, G. A., Isquith, P. K., Kenworthy, L., & Barton, R. M. (2002). Profiles of everyday executive function in acquired and developmental disorders. Child
neuropsychology, 8(2), 121-137.
Goldsmith, H. H., Reilly, J., Lemery, K. S., Longley, S., & Prescott, A. (1999). The laboratory
Grolnick, W. S., Bridges, L. J., & Connell, J. P. (1996). Emotion regulation in two‐year‐olds:
Strategies and emotional expression in four contexts. Child development, 67(3), 928-941. Hofmann, W., Schmeichel, B. J., & Baddeley, A. D. (2012). Executive functions and
self-regulation. Trends in cognitive sciences, 16(3), 174-180.
Hongwanishkul, D., Happaney, K. R., Lee, W. S., & Zelazo, P. D. (2005). Assessment of hot and cool executive function in young children: Age-related changes and individual
differences. Developmental neuropsychology, 28(2), 617-644.
Imuta, K., Hayne, H., & Scarf, D. (2014). I want it all and I want it now: delay of gratification in preschool children. Developmental psychobiology, 56(7), 1541-1552.
Jarvis, H.L., & Gathercole, S.E. (2003). Verbal and non-verbal working memory and
achievements on National Curriculum tests at 11 and 14 years of age. Educational and Child Psychology, 20, 123 – 140.
Kaplan, S., & Berman, M. G. (2010). Directed attention as a common resource for executive functioning and self-regulation. Perspectives on psychological science, 5(1), 43-57. Kenworthy, L., Yerys, B. E., Anthony, L. G., & Wallace, G. L. (2008). Understanding executive
control in autism spectrum disorders in the lab and in the real world. Neuropsychological Review, 18, 320–338.
Kochanska, G., Murray, K., Jacques, T. Y., Koenig, A. L., & Vandegeest, K. A. (1996). Inhibitory control in young children and its role in emerging internalization. Child development, 490-507.
Levesque, R. J. (Ed.). (2011). Delay of Gratification. Encyclopedia of adolescence (pp. 630-632). Springer Science & Business Media.
Levin, H. S., Culhane, K. A., Hartmann, J., Evankovich, K., Mattson, A. J., Harward, H., et al. (1991). Developmental changes in performance on tests of purported frontal lobe functioning. Developmental Neuropsychology, 7, 377-395.
McAuley, T., Chen, S., Goos, L., Schachar, R., & Crosbie, J. (2010). Is the behavior rating inventory of executive function more strongly associated with measures of impairment or executive function?. Journal of the International Neuropsychological Society, 16(3), 495-505.
McClelland, M.M., Cameron, C.E., Connor, C.M., Farris, C.L., Jewkes, A.M., & Morrison, F.J. (2007). Links between behavioral regulation and preschoolers’ literacy, vocabulary, and math skills. Developmental Psychology, 43, 947 – 959.
McDonald, B. C., Flashman, L. A., & Saykin, A. J. (2003). Executive dysfunction following traumatic brain injury: Neural substrates and treatment strategies. Neurorehabilitation, 17, 333–344.
McIntyre, L. L., Blacher, J., & Baker, B. L. (2006). The transition to school: Adaptation in young children with and without intellectual disability. Journal of Intellectual Disability Research, 50(5), 349–361.
Mischel, W. (1974). Processes in delay of gratification. Advances in experimental social psychology, 7, 249-292.
Mischel, W., & Ebbessen, E. (1970). Attention in delay of gratification. Journal of Personality and Social Psychology, 16, 329–337.
Mischel, W., Ebbesen, E. B., & Raskoff Zeiss, A. (1972). Cognitive and attentional mechanisms in delay of gratification. Journal of personality and social psychology, 21(2), 204. Mischel, W., Shoda, Y., & Rodriguez, M. L. (1989). Delay of gratification in children. Science,
244(4907), 933-938.
Mittal, R., Russell, B. S., Britner, P. A., & Peake, P. K. (2013). Delay of gratification in two-and three-year-olds: Associations with attachment, personality, two-and temperament. Journal of Child and Family Studies, 22(4), 479-489.
Miyake, A., Friedman, N. P., Emerson. M. J., Witzki. A. H., Howerter, A., & Wager, T. D. (2000). The unity and diversity of executive functions and their contributions to complex “frontal lobe” tasks: A latent variable analysis. Cognitive psychology, 41(1), 49-100. Monette, S., Bigras, M., & Guay, M. C. (2011). The role of the executive functions in school achievement at the end of Grade 1. Journal of experimental child psychology, 109(2), 158-173.
Newman, D. L., Caspi, A., Moffitt, T. E., & Silva, P. A. (1997). Antecedents of adult interpersonal functioning: Effects of individual differences in age 3 temperaments. Developmental Psychology, 33(2), 206–217.
Nilsen, E. S., Huyder, V., McAuley, T., & Liebermann, D. (2017). Ratings of Everyday Executive Functioning (REEF): A parent-report measure of preschoolers’ executive functioning skills. Psychological Assessment, 29(1), 50-64.
Pennington, B. F., & Ozonoff, S. (1996). Executive functions and developmental psychopathology. Journal of Child Psychology and Psychiatry, 37, 51–87. preschool children. Developmental psychobiology, 56(7), 1541-1552.
Raaijmakers, M., Smidts, D., Sergeant, J., Maassen, G., Posthumus, J., van Engeland, H., et al (2008). Executive functions in preschool children with aggressive behavior: Impairments in inhibitory control. Journal of Abnormal Child Psychology, 36, 1097–1107.
Riggs, N. R., Jahromi, L. B., Razza, R. P., Dillworth-Bart, J. E., & Mueller, U. (2006). Executive function and the promotion of social–emotional competence. Journal of Applied
Developmental Psychology, 27(4), 300-309.
Rothbart, M. K., Ahadi, S. A., Hershey, K. L., & Fisher, P. (2001). Investigations of temperament at three to seven years: The Children's Behavior Questionnaire. Child development, 72(5), 1394-1408
Sikora, D. M., Haley, P., Edwards, J., & Butler, R. W. (2002). Tower of London test
performance in children with poor arithmetic skills. Developmental Neuropsychology, 21, 243−254
Silverman, I. W., & Ippolito, M. F. (1995). Maternal antecedents of delay ability in young children. Journal of Applied Developmental Psychology, 16(4), 569-591.
St. Clair-Thompson, H.L., & Gathercole, S.E. (2006). Executive functions and achievements in school: Shifting, updating, inhibition, and working memory. Quarterly Journal of Experimental Psychology, 59, 745 – 759.
van der Sluis, S., de Jong, P. F., & van der Leij, A. (2007). Executive functioning in children, and its relations with reasoning, reading, and arithmetic. Intelligence, 35, 427−449. Van Hecke, A. V., Mundy, P., Block, J. J., Delgado, C. E., Parlade, M. V., Pomares, Y. B., &
Hobson, J. A. (2012). Infant responding to joint attention, executive processes, and self-regulation in preschool children. Infant Behavior and Development, 35(2), 303-311. Viterbori, P., Usai, M. C., Traverso, L., & De Franchis, V. (2015). How preschool executive
functioning predicts several aspects of math achievement in Grades 1 and 3: A longitudinal study. Journal of experimental child psychology, 140, 38-55.
Wiebe, S. A., Sheffield, T., Nelson, J. M., Clark, C. A., Chevalier, N., & Espy, K. A. (2011). The structure of executive function in 3-year-olds. Journal of experimental child
psychology, 108(3), 436-452.
Appendix A Table 1. Participant Characteristics
N (%) Child Gender
Male 44 (44.9)
Female 54 (55.1)
Race
White 80 (81.6)
African American 2 (2.0)
Asian 1 (1.0)
Other* 15 (15.3)
Maternal Education (highest level completed)
2-year College or Vocational Degree** 5 (5.1)
4-year College Degree 31 (31.6)
Master’s Degree 48 (49.0)
Professional Degree*** 14 (14.3)
Household income
Less than $35,000 4 (4.1)
$35,000-$60,000 10 (10.2)
$60,000-$90,000 16 (16.3)
$90,000-$150,000 40 (40.8)
Greater than $150,000 28 (28.6)
Table 2. Total Participants for Each Task
N Exclusion Criteria
Incomplete Survey Data
Administration Error
Participant Refusal
Did Not
Understand Task A-V Error
Total 98
BRIEF-P 97 1 - - - -
CBQ 97 1 - - - -
Sticker Delay Task 95 - 1 - 1 1
Tower Delay Task 82 - 10 4 1 1
Table 3. Reliability for the Variables in the Sticker Delay Task and Tower Delay Task using Bivariate Correlations
Variables
Delay Time Prompts Anticipation Distraction
Sticker Delay Task .999** .995** .822** .937**
Tower Delay Task .997** .998** .875** .934**
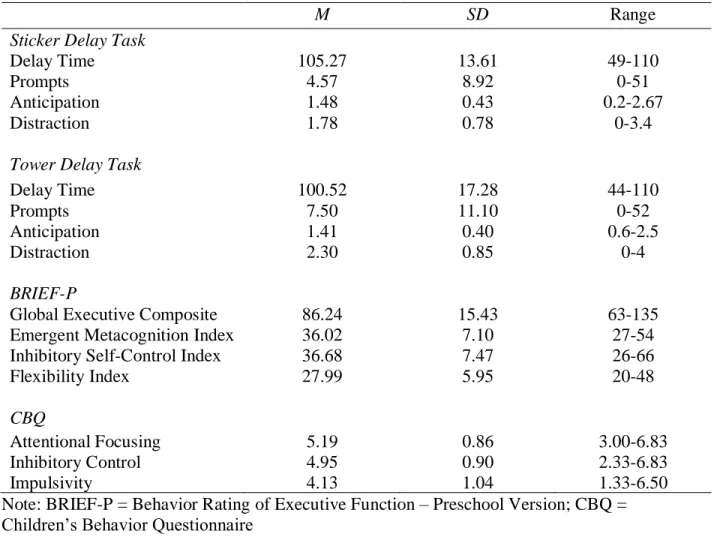
Table 4. Means, Standard Deviations, and Range
M SD Range
Sticker Delay Task
Delay Time 105.27 13.61 49-110
Prompts 4.57 8.92 0-51
Anticipation 1.48 0.43 0.2-2.67
Distraction 1.78 0.78 0-3.4
Tower Delay Task
Delay Time 100.52 17.28 44-110
Prompts 7.50 11.10 0-52
Anticipation 1.41 0.40 0.6-2.5
Distraction 2.30 0.85 0-4
BRIEF-P
Global Executive Composite 86.24 15.43 63-135
Emergent Metacognition Index 36.02 7.10 27-54
Inhibitory Self-Control Index 36.68 7.47 26-66
Flexibility Index 27.99 5.95 20-48
CBQ
Attentional Focusing 5.19 0.86 3.00-6.83
Inhibitory Control 4.95 0.90 2.33-6.83
Impulsivity 4.13 1.04 1.33-6.50
Table 5. Bivariate Correlations between the Variables in the Two Delay of Gratification Tasks
Sticker Delay Time Sticker Prompts Sticker Anticipation Sticker Distraction
Tower Delay Time .27* -.15 -.19 .26*
Tower Prompts -.07 .68** .15 -.26*
Tower Anticipation -.09 .00 .29* -.16
Tower Distraction .18 -.15 -.26* .41**
Table 6. Bivariate Correlations between the Variables in the Two Parent Reports
Global Executive Composite
Emergent Metacognition Index
Inhibitory Self-Control Index
Flexibility Index Attentional
Focusing -.38** -.47** -.29** -.13
Inhibitory Control -.55** -.52** -.57** -.28**
Impulsivity .15 .19 .27** -.17
Table 7. Bivariate Correlations between the Variables in the Sticker Delay Task and Parent Reports
BRIEF-P CBQ
Global Executive Composite Emergent Metacognition Index Inhibitory Self-Control Index Flexibility Index Attentional Focusing Inhibitory
Control Impulsivity Sticker
Delay Time .08 .10 .05 .01 -.01 .02 -.07
Sticker
Prompts -.01 -.04 .05 .00 -.02 -.02 .10
Sticker
Anticipation -.05 -.12 .02 -.01 -.01 .00 .03
Sticker
Distraction .05 .10 -.01 -.01 .05 .01 -.15
Table 8. Bivariate Correlations between the Variables in the Tower Delay Task and Parent Reports
BRIEF-P CBQ
Global Executive Composite Emergent Metacognition Index Inhibitory Self-Control Index Flexibility Index Attentional Focusing Inhibitory
Control Impulsivity Tower
Delay Time .12 .05 .10 .24* -.01 .07 -.24*
Tower
Prompts .19 .09 .26* .22* -.04 -.03 .08
Tower
Anticipation -.10 -.10 -.05 -.08 .10 .03 .04
Tower
Distraction .15 .13 .14 .10 -.02 -.09 -.01
Appendix B Scoring Guide The Sticker Delay Task
Delay. Record time from cup down to sticker up if the child picks up the sticker before the bell is rung. Record full trial time if the child waits until the bell is rung to pick up the sticker.
Prompts. Code 1 point for each instance of any of the following behaviors in each trial: pointed at, or reached for the bell; touched/rang the bell; touched or moved near the assessor; said something to move the trial forward such as: “Ring it,” “I’m ready, “Now,” or “Ok.” A behavior is one discrete action or vocalization. Thus, if the child says “ring it” 3 times consecutively, the child would receive 3 points.
Anticipation. Record the highest level of anticipation observed in each trial. The levels range from 0 to 3. Code Level 0 if there are no anticipation behaviors displayed. Code Level 1 if the child shifts his or her attention (i.e., gaze shifts, looking, head turns) between the cup,
assessor, and/or bell. Long looks to the assessor, lasting more than 3 seconds, in waiting stance are excluded here (see Distraction). Code Level 2 if the child reaches for, points to, touches, holds, picks up or plays with the cup or if the child looks at the cup or bell for more than 3 seconds. This code is not for picking up the cup to pick up the sticker and end the trial. Code Level 3 if the child points to or puts his or her finger or hand on the sticker but does not pick it up from the table or if the child makes vocalizations about the sticker or waiting that are not prompts.
the child glances at/under the table, parent/parents’ chair, walls/wall decorations, or window. Code Level 2 if the child makes at least one sticker-unrelated comment to the assessor or parent. Code Level 3 if the child engages in any of the following behaviors for more than 3 seconds: looks around the room, looks at/stares at/fixates on assessor, runs around room, physically adjusts self on chair, fidgets with body/chair, plays with hands/face, goes over to parent, and/or makes silly facial expressions to the parent or assessor. Code Level 4 if the child engages in Level 3 distraction behaviors for greater than half the trial time. All distraction behaviors must be independent of prompting or anticipation behaviors. Avoid coding Level 3 or 4 Distraction behaviors on 5 second trials. These trials are not long enough to know if the child was really engaging in distraction behavior.
The Tower Delay Task
Delay. If the child goes before his or her turn, record time from when the child removes his or her hand after placing their first block to when he or she places his or her next block on the tower. Record time of full trial if the child waits his or her turn.
Prompts. Code 1 point for each instance of any of the following behaviors in each trial: points at blocks, tower, or assessor with the intent of moving the trial forward; hands or pushes the block to the assessor; touched or moved near the assessor with the intent of moving the trial forward; says something to move the trial forward such as: “Go,” “I’m ready, “Now,” or “Your turn.” A behavior is one discrete action or vocalization. Thus, if the child says “your turn” 3 times consecutively, the child would receive 3 points.
blocks, and/or assessor. Long looks to the assessor, lasting more than 3 seconds, in waiting stance are excluded here (see Distraction). Code Level 2 if the child reaches for or touches the blocks or tower or if the child verbalizes about the task. Touching the blocks or tower must be in a way that is not providing distraction. Code Level 3 if the child looks at the blocks or tower for more than 3 seconds or if the child picks up and holds a block for his or her next turn.