CAROLINA POPULATION CENTER | CAROLINA SQUARE - SUITE 210 | 123 WEST FRANKLIN STREET | CHAPEL HILL, NC 27516
Add Health Documentation
SSGAC Polygenic Scores
(PGSs) in the National
Longitudinal Study of
Adolescent to Adult Health
(Add Health)
Report prepared byAysu Okbay
Patrick Turley
Daniel Benjamin
Peter Visscher
David Braudt
https://doi.org/10.17615/C6166F
2018
3
Table of Contents
I. Overview II. Data
Genome-wide Data
Genotype data and imputation LD patterns
III. Methods Weights
Polygenic scores
MTAG-based polygenic scores IV. Phenotypes
V. Principal components VI. Variables
4
I.
Overview
This document describes the construction of polygenic scores (PGSs) associated with various phenotypes for respondents participating in the National Longitudinal Study of Adolescent to Adult Health (Add Health). The PGSs were constructed by the Social Science Genetic Association Consortium (SSGAC). Research has shown that many outcomes of interest in the health, behavioral, and social sciences are influenced by genes (Domingue et al. 20161; Plomin et al. 20162; Turkheimer 20003). For most human traits/behaviors, commonly referred to as phenotypes, it appears that the genetic influence on the phenotype is highly polygenic; i.e., there is no single gene that can account for the association between genetic variance and variance in the outcome. Instead, the influence of genetics on most phenotypes appears to be due to many small associations across thousands, and possibly millions, of individual single-nucleotide polymorphisms (SNPs, pronounced snips) (Chabris et al. 20154). Polygenic Scores allow researchers to avoid the methodological complexities of including thousands, or millions, of covariates in their analyses by condensing, into a single measure, the associations between individual SNPs and the phenotype of interest (Plomin, Haworth, and Davis 20095).
PGSs, sometimes referred to as polygenic risk scores or genetic risk scores, represent a general measure of the influence of additive genetics on a specific phenotype. They are a weighted sum of allele counts throughout the genome. The weights used in the PGSs are based on summary statistics from genome-wide association studies (GWASs), conducted in large independent samples. Because PGSs represent the associations between SNPs across the entire genome and a phenotype in a single measure, they can easily be incorporated into many of the quantitative analyses common in economics (Benjamin et al. 20126), sociology (Conley 20167), social stratification (Braudt forthcoming8), as well as other social, behavioral, and health sciences (Belsky and Israel 20149). The polygenic scores described in this documentation are based on summary statistics from different studies published by the SSGAC as described below.
The SSGAC conducted genome-wide association analyses of four phenotypes: educational attainment (EduYears, N = 1,131,881), cognitive performance (CP, N = 257,841), self-reported math ability (MA, N = 564,698), and highest-level math class taken (HM, N = 430,445)10. In three separate hold-out cohorts, including Add Health, the SSGAC analyzed the predictive power of these four PGSs derived from the GWAS estimates. These PGSs for the Add Health cohort are available to the scientific community. In addition, the SSGAC constructed polygenic scores for depressive symptoms, subjective well-being, and neuroticism for European-ancestry Add Health respondents11. Due to data-use restrictions, it was not possible to release summary statistics for more than 10,000 SNPs or to release the SNP-level weights for the PGSs used in the papers referenced above. To encourage the use of maximally predictive PGSs, the SSGAC has provided Add Health with the PGSs they constructed so that Add Health can release the PGSs directly to the scientific community.
II.
Data
5 longitudinal geospatial data on neighborhood measures such as income, poverty, unemployment, the availability and use of health services, crime, religious membership, and social programs, Add Health represents one of the richest longitudinal studies of health and behavior in the U.S. available today. For more information on the Add Health study design see Harris (2013)12.
Add Health Genome-wide Data
As part of the Wave IV data collection, saliva samples were obtained from consenting participants (96% of Wave IV respondents). Approximately 12,200, or 80% of those participants, consented to long-term archiving and were consequently eligible for genome-wide genotyping. Genotyping was done on two Illumina platforms, with approximately 80% of the sample genotyping performed with the Illumina Omni1-Quad BeadChip and 20% genotyped with the Illumina Omni2.5-Quad BeadChip. After quality control procedures, genotyped data are available for 9,974 individuals (7,917 from the Omni1 chip and 2,057 from the Omni2 chip) on 609,130 SNPs common across both genotyping platforms (Highland, Heather M.; Avery, Christy L.; Duan, Qing; Li, Yun; Mullan Harris, Kathleen 201813). For more information on the genotyping and quality control procedures see the Add Health GWAS QC report online at:
http://www.cpc.unc.edu/projects/addhealth/documentation/guides/copy_of_AH_GWAS_QC.pdf.
SSGAC QC and imputation
Using the genotype data for the 9,974 Add Health participants and 609,130 variants, the SSGAC imputed these genotypes against the Haplotype Reference Consortium (HRC) v1.1 European reference panel14 using the Michigan Imputation Server15. Prior to imputation, SSGAC identified the non-European individuals by plotting the principal components (PCs) of the covariance matrix of the individuals’ genotype data16 together with the PCs of 1000 Genomes populations and visually inspecting the plots. The SSGAC dropped the identified 4,187 non-European individuals from the sample. Additionally, individuals who did not satisfy the following criteria were also excluded: (i) genotype missingness rate is less than 0.05 in all chromosomes, (ii) there is no mismatch between surveyed sex and genetic sex, (iii) the individual is not an outlier in terms of heterozygosity/homozygosity, and (iv) the individual is not an ancestral outlier. SNPs were also dropped with a call rate less than 0.98, Hardy-Weinberg exact test P -value less than 10-4, or minor allele frequency > 0.01.
Next, the SSGAC checked the data against the HRC reference panela for consistency of strand, id names, positions, alleles, reference/alternative allele assignment, and allele frequency differences using version 4.2.5 of the HRC-1000G-check-bim.plb program. The program updates strand, position and
reference/alternative allele assignment when possible. It removes a SNP if it has any of the following properties: (i) A/T or G/C alleles and a minor allele frequency greater than 0.4, (ii) alleles that do not match the HRC data, (iii) minor allele frequency discrepancy with the HRC data greater than 0.2, (iv) not available in the HRC data. After all checks, 346,754 SNPs remained which were taken forward for imputation. Genotype probabilities were imputed for 39,117,084 variants and 5,690 individuals.
LD patterns
The SSGAC estimated LD patterns using the imputed Add Health genotype data for individuals of European ancestry. To obtain the LD reference data, the genotype probabilities were converted for 38,898,725 biallelic SNPs to hard calls using Plink v1.917. The set of genetic variants were restricted to
a Site list was downloaded from http://www.haplotype-reference-consortium.org/site
6 1,211,662 HapMap318 SNPs, because these SNPs are generally well-imputed and provide good coverage of the genome in European-ancestry individuals. Next, the SSGAC estimated a genetic relatedness matrix, restricting further to SNPs with minor allele frequency greater than 0.01. The SSGAC randomly dropped one individual from each of the 874 pairs of individuals with a genetic relatedness exceeding 0.025.
In order to make sure that there are no genetic outliers in the sample that can bias the LD estimates, the SSGAC clustered the remaining 4,816 individuals based on identity-by-state distances in Plink v1.917,
again restricting to SNPs with minor allele frequency greater than 0.01. Plink reports a Z-score for each individual’s identity-by-state distance to his/her closest neighbor. The SSGAC examined these Z-scores and marked an individual as genetic outlier if his/her Z-score was smaller than -5. One such individual was identified who was then dropped from the sample. The process was repeated, confirming that no individual with a Z-score less than -5 remained in the sample. In the final data set, there were 4,815 individuals of European ancestry and 1,211,662 SNPs.
III.
Methods
A polygenic score for an individual is defined as a weighted sum of a person’s genotypes at K SNPs,
𝑔̂𝑖 = ∑ 𝑥𝑖𝑗 𝐾
𝑗=1
𝑤𝑗 (10)
Methodologies for PGS construction differ primarily across two dimensions: how to generate the weights 𝑤𝑗, and how to determine which K SNPs to include19. Here, the PGSs were constructed using
LDpred20, a Bayesian method that includes all measured SNPs and weights each SNP by (an
approximation) to its conditional effect, given other SNPs. The theory underlying LDpred is derived assuming the variance-covariance matrix of the genotype data in the training sample is known and assuming some prior effect-size distribution. In practice, the matrix is not known but must be approximated using LD patterns from a reference sample. LDpred calculates posterior effect-size distributions for the true effect sizes 𝜷 (i.e., that are conditional on all other SNPs, unlike the GWAS estimates), and each SNP’s weight is set equal to the mean of its (conditional) posterior effect-size distribution.
Weights
7 The weights were adjusted for linkage disequilibrium using the LDpred software tool20 and the reference genotype data whose construction is described above. The LD-adjusted univariate GWAS weights were obtained for the SNPs that are available in both the reference data and the standard GWAS summary statistics for the phenotype, and that pass the filters imposed by LDpred: (i) the variant has a minor allele frequency (MAF) greater than 1% in the reference data, (ii) the variant does not have ambiguous nucleotides, (iii) there is no mismatch between nucleotides in the summary statistics and reference data, and (iv) there is no high (>0.15) MAF discrepancy between summary statistics and validation sample. The LD-adjusted MTAG weights were further restricted to SNPs that are available in the GWAS summary statistics for all four phenotypes.
Polygenic scores
PGSs were calculated in Plink v1.917 for 5,690 individuals, using genotype probabilities obtained from the HRC imputation and the LD-adjusted weights described above.
MTAG-based polygenic scores
MTAG11 is a method that uses GWAS summary statistics for a primary phenotype and for one or more
secondary phenotypes to produce an updated set of summary statistics for the primary phenotype which, under certain assumptions, will be more precisely estimated than the input GWAS summary statistics.
There are costs and benefits to using an based polygenic score. For instance, in all cases, MTAG-based polygenic scores will be more predictive of their corresponding phenotype in expectation. In some cases, however, MTAG can have a high false discovery rate (see Supplementary Note section 1.4 of Turley et al.11), which may lead to spurious correlations between the MTAG-based polygenic score
and other phenotypes.
Therefore, the following recommendations are offered. If in a regression, the dependent variable and the polygenic score correspond to the same phenotype, we recommend using the MTAG-based score. If the dependent variable and the polygenic score correspond to different phenotypes, but the coefficient of interest in the regression is not the coefficient associated with the polygenic score (e.g., if the
polygenic score is only being used as a control variable in an experimental setting), then we also recommend using the MTAG-based polygenic score. Care should be taken when interpreting the coefficient of an MTAG-based polygenic score in this setting, however, since any observed association may be driven through channels involving the secondary phenotypes. This is especially true when the maxFDR is large (see Turley et al.11 , Supplementary Note section 1.4). If researchers are interested in the coefficient on the polygenic score, they should either use GWAS-based scores, or justify why such channels would lead to negligible bias in their particular case.
IV.
Phenotypes
Table 1 summarizes the GWAS phenotype measures. For additional details, please see Supplementary Tables in Lee et al.10 and Turley et al.11.
Table 1. Phenotype Measurements in Respective GWAS
8 Educational
attainment
For each component study, defined in accordance with the ISCED 1997 classification (UNESCO), leading to seven categories of educational attainment that are internationally comparable. The categories are translated into US years-of-schooling equivalents.
Cognitive performance
Meta-analysis of the following two studies:
UK Biobank10: Standardized score on a test of verbal-numerical reasoning designed as a measure of fluid intelligence.
COGENT11: For each component study in the meta-analysis, the first unrotated principal component of performance on at least three neuropsychological tests (or at least two IQ-test subscales). Self-reported
math ability
How would you rate your mathematical ability?
Very poor [0], Poor [1], About average [2], Good [3], Excellent [4] Highest-level
math class taken
Excluding statistics courses, what is the most advanced math class you have successfully completed?
Algebra [1], Algebra [2], Geometry [3], Trigonometry [4], Pre-Calculus [5], Pre-Calculus [6], Vector Pre-Calculus [7], More than vector calculus [8]
Depressive symptomsc
UK Biobank: Over the past two weeks, how often have you… felt down, depressed or hopeless? [1]
had little interest or pleasure in doing things? [2] felt tense, fidgety or restless? [3]
felt tired or had little energy? [4]
Have you ever seen a (i) general practitioner or (ii) psychiatrist for nerves, anxiety or tension?
Neuroticismc UK Biobank: Does your mood often go up and down? [1] Do you ever feel 'just miserable' for no reason? [2] Are you an irritable person? [3]
Are your feelings easily hurt? [4] Do you often feel 'fed-up'? [5]
Would you call yourself a nervous person? [6] Are you a worrier? [7]
Would you call yourself tense or 'highly strung'? [8]
Do you worry too long after an embarrassing experience? [9] Do you suffer from 'nerves'? [10]
Do you often feel lonely? [11]
Are you often troubled by feelings of guilt? [12] Subjective
well-beingc
UK Biobank: In general how happy are you? 23andMe: How satisfied are you with your life?
c Phenotype measure illustrated for selected cohort(s), please see Supplemental Table 5 in Turley et al.2 for listing
9
V. Principal components
It is important to take a number of steps to minimize the risk that an observed association between the outcome of interest (i.e. the phenotype) and the polygenic score is due to unaccounted-for population stratification. A score is stratified if its distribution varies across members of different ancestry groups. Failure to control for differences in ancestry can severely bias estimates of effect sizes, since members of different ancestry groups may vary in the outcome of interest for environmental reasons21. To reduce such concerns, we recommend controlling for the top 10 principal components (PCs) of the covariance matrix of the individuals’ genotypic data16, which are included in SSGACPGS. The principal components were obtained in Plink v1.917 using SNPs with call rate greater than 0.99, minor allele frequency greater than 0.01, and imputation accuracy greater than 0.6. Prior to calculating the principal components, we excluded long-range LD regions on chromosomes 5 (44-51.5 Mb), 6 (25-33.5 Mb), 8 (8-12 Mb) and 11 (45-57 Mb). Remaining SNPs were LD-pruned (R2<0.1 on a 1000kb window).
To mitigate deductive disclosure risk, the order of the first 5 principal components (SPGSPC1- SPGSPC5) were randomized, as was the order of the second 5 (SPGSPC6- SPGSPC10) principal components. Including any principal component in either grouping necessitates including the remaining PCs
comprising the group of 5. For example, if a user’s analysis includes SPGSPC1 and SPGSPC2, it must also incorporate SPGSPC3, SPGSPC4, and SPGSPC5.
VI.
Variables
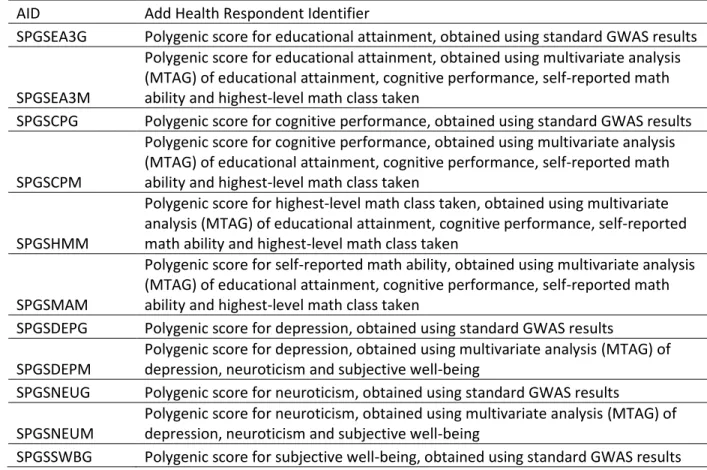
Table 2 provides a description of the variables included in SSGAC PGS.
Table 3. Description of variables
AID Add Health Respondent Identifier
SPGSEA3G Polygenic score for educational attainment, obtained using standard GWAS results
SPGSEA3M
Polygenic score for educational attainment, obtained using multivariate analysis (MTAG) of educational attainment, cognitive performance, self-reported math ability and highest-level math class taken
SPGSCPG Polygenic score for cognitive performance, obtained using standard GWAS results
SPGSCPM
Polygenic score for cognitive performance, obtained using multivariate analysis (MTAG) of educational attainment, cognitive performance, self-reported math ability and highest-level math class taken
SPGSHMM
Polygenic score for highest-level math class taken, obtained using multivariate analysis (MTAG) of educational attainment, cognitive performance, self-reported math ability and highest-level math class taken
SPGSMAM
Polygenic score for self-reported math ability, obtained using multivariate analysis (MTAG) of educational attainment, cognitive performance, self-reported math ability and highest-level math class taken
SPGSDEPG Polygenic score for depression, obtained using standard GWAS results SPGSDEPM
Polygenic score for depression, obtained using multivariate analysis (MTAG) of depression, neuroticism and subjective well-being
SPGSNEUG Polygenic score for neuroticism, obtained using standard GWAS results SPGSNEUM
Polygenic score for neuroticism, obtained using multivariate analysis (MTAG) of depression, neuroticism and subjective well-being
10 SPGSSWBM
Polygenic score for subjective well-being, obtained using multivariate analysis (MTAG) of depression, neuroticism and subjective well-being
SPGSPC1 Randomized PC, include PC1-PC5 in analyses that use any PC from PC1 to PC5 SPGSPC2 Randomized PC, include PC1-PC5 in analyses that use any PC from PC1 to PC5 SPGSPC3 Randomized PC, include PC1-PC5 in analyses that use any PC from PC1 to PC5 SPGSPC4 Randomized PC, include PC1-PC5 in analyses that use any PC from PC1 to PC5 SPGSPC5 Randomized PC, include PC1-PC5 in analyses that use any PC from PC1 to PC5 SPGSPC6 Randomized PC, include PC6-PC10 in analyses that use any PC from PC6 to PC10 SPGSPC7 Randomized PC, include PC6-PC10 in analyses that use any PC from PC6 to PC10 SPGSPC8 Randomized PC, include PC6-PC10 in analyses that use any PC from PC6 to PC10 SPGSPC9 Randomized PC, include PC6-PC10 in analyses that use any PC from PC6 to PC10 SPGSPC10 Randomized PC, include PC6-PC10 in analyses that use any PC from PC6 to PC10
VII.
Citing this Document and Data
For polygenic scores associated with educational attainment, cognitive performance, self-reported math ability, and highest-level math class taken, please cite:
Lee, J.J. et al. 2018. Gene discovery and polygenic prediction from a genome-wide association study of educational attainment in 1.1 million individuals. Nat. Genet. 50, 1112-1121.
doi:10.1038/s41588-018-0147-3
For polygenic scores associated with depressive symptoms, subjective well-being, and neuroticism, please cite:
Turley, P. et al. 2018. Multi-trait analysis of genome-wide association summary statistics using MTAG. Nat. Genet. 50, 229-237. doi:10.1038/s41588-017-0009-4
To cite this document use:
SSGAC Polygenic Scores (PGSs) in the National Longitudinal Study of Adolescent to Adult Health (Add Health). November 2018. Documentation provided by Aysu Okbay, Patrick Turley, Dan Benjamin, Peter Visscher, David Braudt and Kathleen Mullan Harris. doi:10.17615/C6166F
VIII.
References
1 Domingue, Benjamin W. et al. 2016. “Genome-Wide Estimates of Heritability for Social Demographic
Outcomes.” Biodemography and Social Biology 62(1):1–18.
2 Plomin, Robert, John C. DeFries, Valerie S. Knopik, and Jenae M. Neiderhiser. 2016. “Top 10 Replicated
Findings From Behavioral Genetics.” Perspectives on Psychological Science 11(1):3–23.
3Turkheimer, Eric. 2000. “Three Laws of Behavior Genetics and What They Mean.” Current Directions in
Psychological Science 9(5):160–164.
4 Chabris, Christopher F., James J. Lee, David Cesarini, Daniel J. Benjamin, and David I. Laibson. 2015.
“The Fourth Law of Behavior Genetics.” Current Directions in Psychological Science 24(4):304–312.
11 5 Plomin, Robert, Claire MA Haworth, and Oliver SP Davis. 2009. “Common Disorders Are Quantitative
Traits.” Nature Reviews Genetics 10(12):872.
6Benjamin, Daniel J. et al. 2012. “The Promises and Pitfalls of Genoeconomics.” Annual Review of
Economics 4(1):627–62.
7Conley, Dalton. 2016. “Socio-Genomic Research Using Genome-Wide Molecular Data.” Annual Review
of Sociology 42(1):275–99.
8 Braudt, David B. (2018). “Sociogenomics in the 21st Century: An Introduction to the History and
Potential of Genetically Informed Social Science.” Sociology Compass. 12(10)
9Belsky, Daniel W. and Salomon Israel. 2014. “Integrating Genetics and Social Science: Genetic Risk
Scores.” Biodemography and Social Biology 60(2):137–55.
10Lee, J.J. et al. 2018. Gene discovery and polygenic prediction from a genome-wide association study of
educational attainment in 1.1 million individuals. Nat. Genet. 50, 1112-1121. doi:10.1038/s41588-018-0147-3
11 Turley, P. et al. 2018. Multi-trait analysis of genome-wide association summary statistics using MTAG.
Nat. Genet. 50, 229-237. doi:10.1038/s41588-017-0009-4
12Harris, Kathleen Mullan. 2013. “The Add Health Study: Design and Accomplishments.” Chapel Hill:
Carolina Population Center, University of North Carolina at Chapel Hill.
13 Highland, Heather M.; Avery, Christy L.; Duan, Qing; Li, Yun; Mullan Harris, Kathleen. 2018. “Quality
Control Analysis of Add Health GWAS Data.”
14 McCarthy, S. et al. A reference panel of 64,976 haplotypes for genotype imputation. Nat. Genet. 48,
1279–1283 (2016).
15 Das, S. et al. Next-generation genotype imputation service and methods. Nat. Genet. 48, 1284–1287
(2016).
16 Price, A. L. et al. The impact of divergence time on the nature of population structure: an example
from Iceland. PLoS Genet. 5, e1000505 (2009).
17 Chang, C. C. et al. Second-generation PLINK: rising to the challenge of larger and richer datasets.
Gigascience 4, 7 (2015).
18 Altshuler, D. M., Gibbs, R. A. & Peltonen, L. Integrating common and rare genetic variation in diverse
human populations. Nature 467, 52–58 (2010).
19 Wray, N. R. et al. Pitfalls of predicting complex traits from SNPs. Nat. Rev. Genet. 14, 507–515 (2013). 20 Vilhjálmsson, B. J. et al. Modeling Linkage Disequilibrium Increases Accuracy of Polygenic Risk Scores.
Am. J. Hum. Genet. 97, 576–592 (2015).