Acknowledgements
I would first like to thank Dr. Peter for making this research both possible and enjoyable.
Without her constant support and guidance, I would not have been able to complete such an
interesting project—the fact that she was able to provide such a high level of support to an entire
class of students is truly remarkable. I would also like to extend a huge thank my thesis advisor,
Dr. Brian McManus, for all of his help from determining the scope of my research to the
construction of my economic models. It was truly my pleasure to work with you over the past
year. Finally, I want to thank my parents for always challenging me to challenge myself. I
Abstract
This paper is an analysis of the Affordable Care Act in terms of its effectiveness in
creating healthier pregnancy outcomes. I use data collected by the CDC from mothers who gave
birth in the United States between 2004 and 2013 to analyze the trends in insurance coverage,
prenatal health care consumption, and pregnancy health outcomes all while controlling for
pertinent demographic factors. The findings of this study show that there is a positive
relationship between insurance coverage and consumption of prenatal health care. They also
show a positive relationship between consumption of prenatal health care and the probability of
having a child with a normal birth weight. Furthermore, this research also finds a sharp increase
in the consumption of prenatal health care in 2011 – approximately 9 months after the ACA was
1. Introduction
As the cost of health care continues to rise in the United States so has the importance of
the Affordable Care Act. The Patient Protection and Affordable Care Act (ACA) was enacted in
March of 2010 with the goal of providing health insurance to nearly one hundred percent of
Americans in numerous different ways including the young adult mandate, the expansion of
Medicaid, and the creation of the public exchange (Gruber 2011). The goal of this paper is to
examine the way in which women have received health insurance since 2004 and how the
breakdown of insurance types has shifted since the ACA was signed into law with the final goal
of understanding if this legislation has affected health outcomes for pregnancies carried to term.
A change in the way health insurance is distributed to young women corresponding with an
increase or decrease in prenatal healthcare consumption demonstrates that there is a causal effect
between health insurance coverage and prenatal healthcare consumption. This paper also shows
that an increase or decrease in consumption of prenatal care can affect the likelihood of having a
healthy pregnancy outcome to complete the link between health insurance coverage and healthy
pregnancy outcomes.
I have chosen to research this topic because very little has been written about the effect of
the Affordable Care Act on pregnancy health outcomes, and pregnant women are the most
important group to analyze in terms of their health insurance coverage as providing coverage for
one pregnant woman ultimately improves health outcomes for two individuals. My research
contributes to the existing stock of literature that points to improvements across a wide variety of
health categories after the enactment of the ACA. Additionally, an alternative finding would still
provide value, as it would demonstrate to policy makers that there is need for further
Prior to the ACA, young adults were no longer eligible for coverage on their parents’
private health insurance plan on their 23rd birthday if they were attending college and on their
19th birthday if they were not. Now, all young adults may remain on their parents’ private
insurance plan until the start of the first plan year after their 26th birthday (Anderson et al. 2014).
For example, if an individual were to turn 26 in May and their parents’ insurance plan year does
not begin again until August, then that individual would be covered by their parents’ plan until
August under the new legislation. The ACA provided these young adults with three to seven
additional years of health insurance coverage than they previously had access to, and this should
have caused an increase in health care consumption among these individuals as the costs to them
were greatly reduced.
The next piece of the ACA relevant to the scope of this study is the expansion of
Medicaid to 138% of the Federal Poverty Level (FPL) that was adopted by 27 states and took
effect on January 1, 2014 (Busch et al. 2014). This is interesting for the study because it
increased the number of people with health insurance and access to health care, but because only
27 states adopted the expansion it also provides the chance for a control group that can help
isolate the effect of this specific policy. This would manifest itself in the data as a decrease in
the uninsured rate, an increase in the Medicaid coverage rate, and possibly an increase in health
care consumption for those who report Medicaid as their primary insurance provider.
The final portion of the ACA that will be analyzed is the public health insurance
exchange. By 2014 almost all Americans were required to have health insurance (or pay a
monetary penalty if they do not), and the exchange provides the opportunity for these otherwise
uninsured individuals who earn less than 400% of the FPL to purchase coverage (Busch et al.
condition, and these exchanges opened between 2013 and 2014 depending on the state. Similar
to the previous two policies, the addition of the public health insurance exchange increased the
number of individuals with access to health insurance coverage and is expected to improve
access to health care.
In this paper I analyze the effect that this increased access to health insurance has had on
pregnant women and their children. Specifically, I address the following questions:
1. Has the ACA changed way that women receive health insurance coverage?
2. Has the ACA changed the consumption levels of prenatal health care by women?
3. Has the ACA changed health outcomes for pregnancies carried to term?
In addition, this research provides a more in depth look at the specific policies of the
ACA and the effect that each had or did not have on pregnancy health outcomes. The analysis of
the individual provisions can help lawmakers understand which of the policies were most
effective in changing health outcomes for individuals and help them come to more efficient
conclusions in the future.
Finally, a strong causal effect between health insurance and healthy pregnancies stresses
the importance of providing coverage in a more universal manner and likewise help guide future
policy. To date, no study has been conducted focusing specifically on how access to health
insurance affects pregnancy outcomes; therefore, this is the first to provide insight on the
effectiveness of the Affordable Care Act in regard to pregnancy health and will allow policy
makers to better understand whether the ACA is a step in the right direction or if they should
This study finds the relationship between health insurance coverage and prenatal health
care consumption to be positive and significant. Such a result demonstrates the important role
health insurance plays in increasing the likelihood a mother will take prenatal health care visits.
Furthermore, this research reveals a positive and significant relationship between prenatal health
care consumption and a healthy pregnancy.
2. Literature Review
Very little research has been conducted specifically focusing on pregnancy outcomes and
health insurance. But, there has been a fair amount research conducted on access to health
insurance under the ACA that shows the young adult mandate had a significant effect in terms of
expanding health insurance coverage. According to the National Health Interview Survey there
was an 8.3% increase in young adults with health insurance from September 2010 to June 2011
(Cohen 2011). This suggests that assumptions made about the effectiveness of the young adult
mandate in providing insurance coverage are correct as the mandate was enacted in September of
2010, and I look to confirm this by showing a similar pattern in my data.
Sommers and Kronick (2012) found that after the implementation of the young adult
mandate there was a significant 4.3% increase in dependents covered by employer sponsored
health plans, which shows that the dependent coverage mandate did in fact have an effect on
dependent coverage that is significant and can be isolated from other provisions of the ACA. The
researchers also found that there was no significant change in the number of people covered by
Medicaid, and these findings match the intuition because the Medicaid expansion did not take
effect until 2014.
Another study conducted in 2015 estimated that the young adult mandate had a much
5.5 and 6.7%, but this could result from the authors narrowing the age range from 19-25 to 23-25
(Barbaresco et al. 2015). These same authors also concluded that the percentage of people
self-reporting a health status of “excellent” increased significantly by around 1.4%. This conclusion
supports the notion that increased access to health care through increased coverage can lead to
improved health.
In another study it was found that there are many merits to a universal health insurance
system through her analysis of the Canadian health insurance model (Deber 2003). Though the
United States has a plethora of insurance providers and is nowhere near having a similar single
payer system, Canada’s system can serve as a benchmark for the United States as it attempts to
provide a more universal system of health insurance coverage to its citizens. Deber found that,
“Canada has universal coverage, excellent health outcomes, minimal paperwork, and high public
satisfaction…One key advantage is the avoidance of risk selection; no one is uninsurable”
(Deber 2003). Deber’s findings are relevant to the scope of this paper for two reasons. First
being that a universal system of health insurance coverage results in excellent health outcomes,
so a similar result should be recognized in the United States data after health insurance coverage
was expanded in a manner that made it nearly universal. Second, by having everyone in an
insurance pool, the costs of high-risk individuals are significantly mitigated by the large
population of low risk individuals in the same pool. The ACA’s individual mandate requires that
every American have health insurance or face a monetary penalty, which creates a system more
similar to that of Canada as nearly every individual belongs to an insurance risk pool or pays
some amount of money for their abstinence. I expect to find similar trends in United States data
that will provide further evidence to propel health insurance reform in the direction of universal
same type of health care system as it would be far too expensive and our population is far too
diverse, this is simply evidence supporting the notion that improved access to health care will
lead to better health outcomes.
Despite the lack of existing research on health insurance and pregnancy outcomes, there
is still enough research to support the validity of this study. Many researchers found an increase
in insurance coverage after the ACA, and others have found that more individuals having access
to health insurance leads to a healthier population of individuals. This study is the first to
combine both aspects of such previous research and show the complete relationship between
health insurance coverage, prenatal health care consumption, and pregnancy health outcomes.
3. Data
The data source that I use is the Pregnancy Risk Assessment Monitoring System
(PRAMS), which is produced annually by the CDC since 1988. This dataset provides access to
pregnancy data collected in a household survey of individual mothers between the years
2004-2013. The CDC PRAMS Team randomly samples mothers who have recently given birth by
drawing from each state’s file of birth certificates, which results in a sample population of
between 1,300 and 3,400 women per year per state. Such a survey format provided over 390,000
observations from 2004-2013.
The PRAMS data is highly standardized which allows for comparisons between states
and makes it extremely clear what each variable is and how it is measured. A major strength of
the dataset is that the survey is conducted in an extremely thorough manner consisting of five
separate mailings (three questionnaires and two letters) and a telephone follow-up, plus the
dataset excludes states with a response rate of <65%. (Note: This threshold was lowered from
answering retrospective questions and improve the accuracy of such responses. Finally, all states
have implemented an incentive program to encourage survey participation, which helps reduce
the voluntary response bias. The combination of these methods ensures that the dataset contains
reliably accurate information.
This dataset has a plethora of relevant dependent and control variables, ample
demographic questions, and an outcome variable that can be used as a proxy for a healthy versus
unhealthy pregnancy. PRAMS contains information on the birth weight of the infant grouped
into 250 gram buckets that range from 0-8150 grams, and this allows me to further categorize the
birth weight as “Extremely Low,” “Very Low,” “Low,” “Normal,” and “High.” The extensive
series of questions provides a great deal of information about each pregnancy, but a measure of
ability or intelligence would be helpful for controlling the effects of education and may also have
an effect on the decision to purchase health insurance coverage. There is also a minor lag in this
data and it is currently only available through 2013. While this does not allow for a complete
analysis of the ACA, this dataset still provides the opportunity to examine the effects of the
dependent coverage mandate on the national level and to analyze Medicaid expansion as 27 of
50 U.S. states had adopted the Medicaid expansion in the years covered by the scope of this
survey. It should be noted that this study is not a holistic examination of Medicaid expansion.
Furthermore, this dataset does not have underrepresented populations or small observation
numbers, but for several variables, including income and race, there were missing values that
were coded as “Unknown.” The “Unknown” category never exceeded 2% of the total
population.
The biggest drawback in the PRAMS dataset is the lack of consistency in the insurance
2004-2013. The Medicaid question and corresponding variable codes remained consistent over
the survey phases, but the questions and corresponding variable codes for being covered by
traditional employer sponsored insurance plan lacked consistency between survey phases. For
example, even after multiple attempts to reconcile the insurance variables, the dataset shows a
decline in Insurance and Health Maintenance Organization (IHMO) insurance coverage with
large, negative jumps between years when a new survey format was introduced. As the
Medicaid and uninsured trends seem to fit with the findings of other research and simple
intuition, I am hesitant to accept the IHMO trend as the true trend. Instead, I think it is much
more likely that as the insurance question was asked differently over years that individuals began
to respond to the question differently.
4. Theoretical Model
The relevant choice in this study is whether the mother has chosen to have health
insurance, and the policy that influences this choice is the Affordable Care Act. The ACA
created a system in which health insurance coverage is more accessible than previously before
and presumably had an effect on the rate at which individuals choose to opt in or out of health
insurance coverage. However, there are many factors beyond the ACA that play into an
individual’s decision to purchase health insurance that I control for such as age, education,
income and race. Ultimately, the objective of the mother is to maximize the health of her
pregnancy. I model the decision making process as follows:
I have grouped the demographic variables into a vector, “D,” and it contains information
on Mother’s Age, Mother’s Race, Mother’s Education, Father’s Education, and Income. Vector
D is included in all models and additional variables relevant to each model will be added and
1) Ii is used to model the decision to purchase health insurance as a function of the vector
“D,” as well as birth year of the child. Vector “D” controls for demographic information pertinent to the insurance coverage choice. The coefficient β2 estimates how effective
public policy is in increasing the likelihood that one is covered by an insurance policy. Note that the subscript “t” is used to indicate the time of birth, and that the subscript “c” is used to indicate the time of conception, or (t – ¾).
Iic = f(Di, BYeart)
Iic*= β1*Di + β2*BYeart + ε
Iic = 1 IF Ii* > 0
Iic = 0 ELSE
2) Pi is used to model the individual’s consumption of healthcare as a function of the
vector “D,” birth year (BYeart) as well as a categorical representation of the mother’s
insurance status (Iic). The outcome variable here is prenatal healthcare consumption (Pi)
grouped into three categories: “Inadequate,” “Adequate,” and “Excellent” based on whether the mother took “0-8,” “9-11,” or “12+” prenatal care visits, respectively. A causal relationship between health insurance coverage and increased consumption of prenatal healthcare would demonstrate the mechanism through which health insurance creates healthier pregnancy outcomes. The coefficient α1 estimates whether the effect of
health insurance coverage on healthcare consumption is positive or negative. Pi = g(Iic ,Di, BYeart)
Pi = α1*Iic + α2*Di + α3*BYeart + υ
3) Hit is used to model the health outcome of the mother’s pregnancy as a function of
prenatal health care visits (Pi), the demographic vector (Di) and birth year. A positive
causal relationship between prenatal healthcare consumption and healthy pregnancies would show that prenatal healthcare consumption increases the likelihood of a healthy pregnancy outcome, and the coefficient θ1 reveals the causal direction of this relationship.
Hit = h(Pi, Vi, Di, BYeart )
The above diagram represents the relationship between the three equations described in
the theoretical model. Because the PRAMS dataset includes a measure of healthcare
consumption during the pregnancy, I am able to determine if having health insurance (1) does in
fact increase the number of prenatal care visits taken by the mother (2). Assuming that this can
be demonstrated by the regressions, I can then estimate the effect that increased prenatal
healthcare consumption (2) has on pregnancy outcomes (3) and ultimately determine the
relationship between health insurance coverage (1) pregnancy outcomes (3). Note that the final
portion of the diagram displaying “Birth Weight Category 1-5” represents five distinct birth
weight outcomes and was condensed to one block for simplicity.
5. Empirical Model
When looking at this information empirically, I am modeling the probability of a healthy
pregnancy conditional on that woman’s insurance status. I show that whether a woman is
insured or uninsured has significant explanatory power in terms of the health outcome for said
(1)!Insura
nce?
!
Yes!
(2)!Inadequate!
PNC![1A8!Visits]!
(2)!Adequate!PNC!
[9A11!Visits]!
(3)!Birth!Weight!
Category!1A5!
(2)!Excellent!PNC!
[12+!Visits]!
No!
(2)!Inadequate!
PNC![1A8!Visits]!
(2)!Adequate!PNC!
[9A11!Visits]!
(3)!Birth!Weight!
Category!1A5!
(2)!Excellent!PNC!
pregnancy. Doing so requires three models to link insurance coverage to pregnancy outcomes.
The first model is a multinomial logit of insurance status (Iic) on birth year while controlling for
demographic variables to show that there was a statistically significant uptick in insurance
coverage beginning in 2011. Insurance status is grouped into four categories: “[1] IHMO,” “[2]
Medicaid,” “[3] Uninsured,” “[9] Unknown.”
P(Iic)= β0 + β1*D[Mother’s Ageit, Mother’s Ethnicityi,, Mother’s Educationic, Father’s
Educationic, Log Incomeit] + β2*BYeart + π i,t πi,t = ηt + φi
Please note that the error term, πit, has been split into two separate error terms to isolate the portion of the error term that arises from time effects (ηt) from the portion caused by time effects (φi). I also assume that E(πit)=0, E(πit*Dit)=0, and πit has a standard normal distribution.
The second model is a multinomial logit model that controls for demographic variables
and birth year and includes a binary indicator for insurance coverage. The outcome variable of
interest is prenatal healthcare consumption (Pi) grouped into three categories: “Inadequate,”
“Adequate,” and “Excellent” based on whether the mother took “0-8,” “9-11,” or “12+” prenatal
care visits, respectively. By setting the base category to 0-8 visits, I expect to find a significant
and positive correlation on the insurance indicator variable to show that having insurance makes
it significantly more likely that the mother consumes a higher level of prenatal care.
P(Pit)= β0 +β1* Iic + β2*D[Mother’s Ageit, Mother’s Ethnicityi,, Mother’s Educationic, Father’s
Educationic, Ln(Incomeit)] + β3*BYeart + υ i,t
Please note that the error term, υ it, has been split into two separate error terms to isolate the portion of the error term that arises from time effects (ζt) from the portion caused by time effects (δi).
The third model is again a multinomial logit model, but this time I control for
demographic variables and birth year with the dependent variable of interest being prenatal care.
The final outcome variable of interest is Hit, the health outcome of the pregnancy, and it is
measured as a categorical variable that corresponds to the infant’s birth weight. The birth weight
categories are as follows: “Extremely Low,” “Very Low,” “Low,” “Normal,” and “High.” By
setting the base category to “Normal” I anticipate finding a negative and significant correlation
on the variable representing consumption of prenatal care visits to indicate that taking higher
levels of prenatal care visits results in a lesser probability of the child having a non-normal birth
weight.
P(Hit)= β0+β1* Pi + β2*D[Mother’s Ageit, Mother’s Ethnicityi,, Mother’s Educationic, Father’s
Educationic, Log Incomeit] + β3 *BYeart + εi,t
εi,t
= µt + λi**Please note the usage of the following subscripts:
i: individual
t: time of birth
c: time of conception (= t – ¾)
Also note that the error term,
ε
it, has been split into two separate error terms to isolate theportion of the error term that arises from time effects (µt) from portion caused by individual
6. Results and Findings
6.1 Modeling Trends in Insurance Coverage
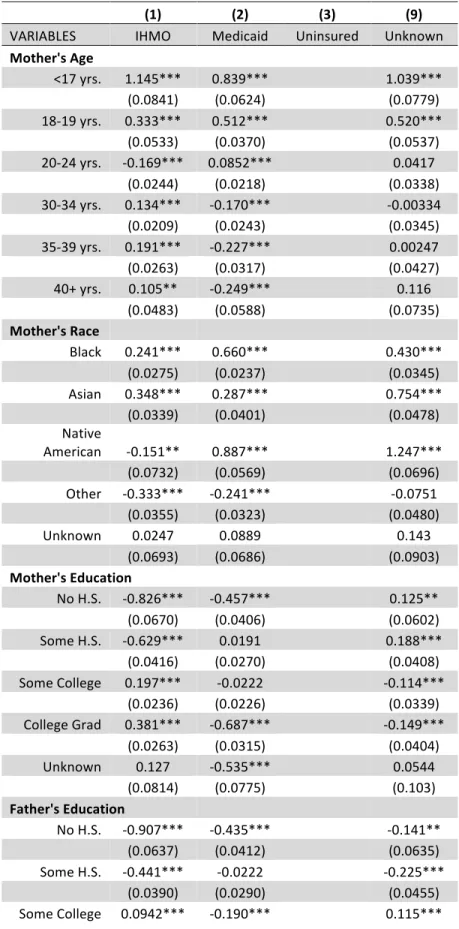
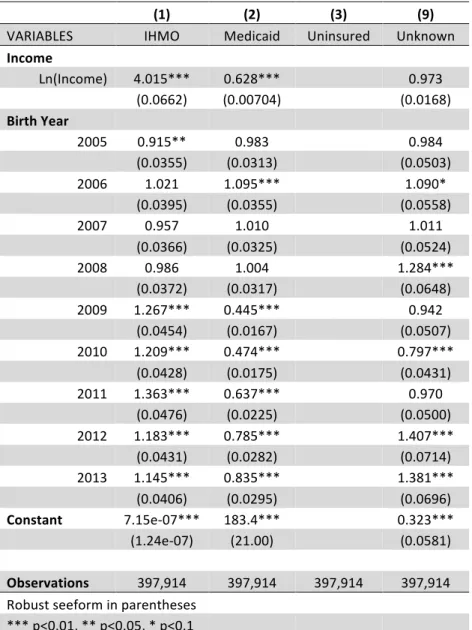
Table 1.0 shows the trends in insurance coverage between the years 2004 and 2013
according to whether the mother was covered by an IHMO insurance plan, a Medicaid plan, or
uninsured. The coefficients for IHMO insurance in the birth years 2011-13 are all positive and
significant, meaning that in the years 2011 through 2013 it was significantly more likely for an
individual to have IHMO coverage than to be uninsured. This points to the effectiveness of the
dependent coverage mandate in the Affordable Care Act.
Another trend that should be noted is the relative increase in the Medicaid rate after the
ACA took place in 2010. Though all coefficients are negative, they decrease in magnitude from
-0.746 in 2010 to -0.180 in 2013. This means that even though individuals are still less likely to
have Medicaid than to be uninsured, the expansion of the Medicaid program to 138% of the FPL
has increased the likelihood of having Medicaid relative to being uninsured. It should also be
noted that by 2013 only 27 states had expanded their Medicaid program, so this data does not
encompass the effect of the entire Medicaid expansion.
The demographics variables in this survey all behave fairly normally. Both mother’s and
father’s education have positive and significant coefficients for IHMO insurance that appear for
individuals who have attended education beyond high school graduation. This is interpreted to
mean that attending higher education increases the likelihood of the mother being covered by
IHMO insurance relative to being uninsured. As expected, a mother’s likelihood of having
IHMO insurance relative to being uninsured increases with the mother’s age. The demographic
confident that the trends in insurance coverage are correct trends and not simply the result of bad
data.
6.2 Modeling Changes in Prenatal Health Care Consumption
Table 2.0 reveals that a mother who is covered by an IHMO insurance plan is more likely
to take between 9-11 or 12+ prenatal health care visits than a mother who is covered by
Medicaid or uninsured, and all coefficients are significant at the p<0.01 level. This can also be
interpreted as mothers without IHMO coverage are less likely to take 9-11 prenatal care visits,
and even less likely to take 12+ prenatal care visits, the “adequate” and “excellent” levels of
prenatal care, respectively. This table also shows that beginning in the year 2011 there was an
overall uptick in prenatal health care consumption through 2013, which points to the
effectiveness of the ACA in terms of getting more individuals to the doctor. Table 2.1 shows
statistically significant relative risk ratios of 1.185 and 1.295 for 9-11 and 12+ prenatal health
care visits, respectively. This reveals that mothers covered by IHMO insurance plans have 1.185
and 1.295 times the risk to take 9-11 and 12+ visits, respectively, than mothers who are
uninsured. The table also shows relative risk ratios greater than 1 for Birth Year that increase
beginning in 2011 and remain elevated through 2013, which means that in the years 2011-13
mothers were more likely to consume higher levels of prenatal care after the Affordable Care Act
was signed into legislation.
Finally, Table 2.1 reveals what is perhaps the most interesting in terms of results. The
relative risk ratio for the Medicaid insurance variable reveals that a mother who is covered by a
Medicaid health insurance plan has 1.066 and 1.153 times the risk of attending 9-11 or 12+
prenatal health care visits, respectively, than a mother who is uninsured. Both coefficients are
covered by Medicaid, a government sponsored health insurance plan, do not behave the same
way that mothers who are covered by a traditional IHMO plan, which points to a flaw in the
Medicaid system. The Medicaid relative risk ratios for “adequate” and “excellent” levels of
prenatal health care visits are much smaller in magnitude than the relative risk ratios for IHMO
plans, 1.185 and 1.295. This means that mothers covered by Medicaid are more likely to
consume higher levels of prenatal care than mothers who are uninsured, but they still do not
behave the same way as mothers who are more traditionally insured by IHMO plans. The
positive coefficients for Ln(Income) in Table 2.0 show a positive causal relationship between
income and levels of prenatal health care consumed, which offers a potential explanation for the
variance in behaviors between the two groups. Mothers covered by Medicaid plans, by
definition, have an income less than 138% of the FPL, so these mothers have inherently low
levels of something that is shown to increase the consumption of prenatal health care.
6.3 Modeling Changes in Pregnancy Health Outcomes
Table 3.1 shows relative risk ratios for each birth outcome that decrease as prenatal
health care consumption increases. This makes intuitive sense, as consuming more health care
should result in healthier outcomes. The relative risk ratios for an “Extremely Low” birth weight
are 0.0895 and 0.0578 for 9-11 Visits and 12+ visits, respectively. This means that a mother
who attends 9-11 prenatal care visits has 0.0895 times the risk of her child having an “Extremely
Low” birth weight compared to mothers who only took between 1 and 8 visits. A mother who
takes 12 or more prenatal care visits has 0.0578 times the risk of having an “Extremely Low”
birth weight relative to mothers who consume an “Inadequate” level of prenatal health care. This
health care visits has 94% less risk of having a child with an “Extremely Low” birth weight than
a mother who consumes an “Inadequate” level.
The relative risk ratios for a “Very Low” birth weight are 0.210 and 0.144 for 9-11
prenatal health care visits and 12+ visits, respectively. This reveals that mothers who consume
“Adequate” levels of prenatal care have 0.21 times the risk of having a child with a low birth
weight than mothers who consume an “Inadequate level of prenatal care. Additionally, mothers
who consume an “Excellent” level of prenatal care have 0.144 times the risk of having a child
with a “Very Low” birth weight compared to mothers who consume an “Inadequate” level.
The relative risk ratios for a “Low” birth weight are 0.555 and 0.429 for 9-11 prenatal
health care visits and 12+ visits, respectively. This means that mothers who take “Adequate”
levels of prenatal health care visits have 0.555 times the risk of having a child with a low birth
weight when compared to mothers who take an “Inadequate” level of visits. Moreover, this
reveals that mothers who take an “Excellent” level of prenatal health care visits have 0.429 times
the risk of having a child with a “Low” birth weight than mothers who take an “Inadequate”
level of visits.
The last bit of information that can be gathered from the results of the third model is a
year effect similar to the year effect present in the second model. This means that in 2011-13,
the years following the ACA, mothers were less likely to have a child with a low birth weight.
All relative risk ratios for the birth years 2011-13 are significant at the p<0.01 level, and all of
the ratios for each of the low birth weight outcomes are less than their respective 2010 ratio and
7. Conclusion
There are several very important conclusions that can be drawn from the findings of this
research. The most important being that having insurance coverage makes it significantly more
likely for mothers to consume prenatal health care, and such a result demonstrates the
importance of providing insurance coverage to more mothers. Another key thing to note about
this finding is that while mothers who are covered by Medicaid are more likely to consume
prenatal care than mothers who do not have insurance at all, they still do not consume prenatal
care at the same rate as mothers who are insured by an IHMO plan. This has important policy
implications because it shows that providing insurance coverage to mothers has significant
effects on the level of prenatal care that they consume. It also demonstrates that the Medicaid
program is by no means a perfect solution and must continue to be improved upon until mothers
who are covered by Medicaid begin to behave more similarly to those covered by IHMO plans in
terms of prenatal health care consumption.
Another important finding in favor of the ACA’s effectiveness when looking at the
prenatal health care model is the positive and statistically significant increase in the coefficients
for birth years beginning in 2011. This means that the Affordable Care Act did in fact cause an
increase in consumption of prenatal health care, which was also found to create a higher
probability of a healthy pregnancy outcome.
The results in the third model clearly show the important causal relationship between
consumption of prenatal health care and having a child with a normal birth weight—the more
prenatal health care that a mother consumed the less likely she was to have a child with a low
birth weight. This study links the relationship between insurance coverage, prenatal health care
Affordable Care Act in creating healthier pregnancies for American women. This study also
supports the need for continued health insurance expansion and Medicaid reform in the United
8. Tables
Summary Statistics
Variable( Obs( Mean( Std.(Dev.( Min( Max(
Birth(Year( 397,936& 2008& 2.860& 2004& 2013&
& & & & & &
Mother's(Age(
& & & & &
[2]&18/19&yrs.& 397,914& 0.067& 0.251& 0& 1&
[3]&20/24&yrs.& 397,914& 0.237& 0.425& 0& 1&
[4]&25/29&yrs.& 397,914& 0.277& 0.447& 0& 1&
[5]&30/34&yrs.& 397,914& 0.233& 0.423& 0& 1&
[6]&35/39&yrs.& 397,914& 0.124& 0.329& 0& 1&
[7]&40+&yrs.& 397,914& 0.031& 0.172& 0& 1&
& & & & & &
Mother's(Race(
& & & & &
[1]&White& 397,936& 0.612& 0.487& 0& 1&
[2]&Black& 397,936& 0.168& 0.374& 0& 1&
[3]&Asian& 397,936& 0.075& 0.263& 0& 1&
[4]&Native&Am.& 397,936& 0.037& 0.189& 0& 1&
[5]&Other& 397,936& 0.072& 0.259& 0& 1&
& & & & & &
Mother's(Education(
& & & & &
[1]&No&H.S.& 397,936& 0.038& 0.191& 0& 1&
[2]&Some&H.S.& 397,936& 0.132& 0.339& 0& 1&
[3]&H.S.&Grad& 397,936& 0.282& 0.450& 0& 1&
[4]&Some&College& 397,936& 0.250& 0.433& 0& 1&
[5]&College&Grad& 397,936& 0.284& 0.451& 0& 1&
& & & & & &
Father's(Education(
& & & & &
[1]&No&H.S.& 397,936& 0.035& 0.184& 0& 1&
[2]&Some&H.S.& 397,936& 0.092& 0.289& 0& 1&
[3]&H.S.&Grad& 397,936& 0.268& 0.443& 0& 1&
[4]&Some&College& 397,936& 0.191& 0.393& 0& 1&
[5]&College&Grad& 397,936& 0.242& 0.428& 0& 1&
& & & & & &
Birth(Weight(
& & & & &
[2]&Very&Low& 396,959& 0.031& 0.174& 0& 1&
[3]&Low& 396,959& 0.218& 0.413& 0& 1&
[4]&Normal& 396,959& 0.645& 0.478& 0& 1&
[5]&High& 396,959& 0.076& 0.265& 0& 1&
& & & & & &
#(of(PNC(Visits(
& & & & &
[2]&9/11&Visits& 397,936& 0.298& 0.457& 0& 1&
[3]&12+&Visits& 397,936& 0.436& 0.496& 0& 1&
& & & & & &
Income( 397,936& 31237.67& 25573.34& 0& 110500&
& & & & & &
Insurance(Type(
& & & & &
[1]&IHMO& 397,936& 0.381& 0.486& 0& 1&
[2]&Medicaid& 397,936& 0.343& 0.475& 0& 1&
[3]&Uninsured& 397,936& 0.198& 0.398& 0& 1&
& & & & & &
IHMO(Insurance( 394,644& 0.505& 0.500& 0& 1&
Medicaid( 392,420& 0.440& 0.496& 0& 1&
Uninsured( 394,607& 0.200& 0.400& 0& 1&
State(ID( 397,936& 20.007& 11.209& 1& 39&
Weight( 397,936& 46.088& 61.666& 1.000& 716.579&
Table 1.0 – Trends in Insurance Coverage by Type, 2004-2013
( (1)( (2)( (3)( (9)(
VARIABLES& IHMO& Medicaid& Uninsured& Unknown&
Mother's(Age( && && && && <17&yrs.& 1.145***& 0.839***&
& 1.039***& & (0.0841)& (0.0624)& & (0.0779)& 18/19&yrs.& 0.333***& 0.512***&
& 0.520***& &
(0.0533)& (0.0370)&
&
(0.0537)& 20/24&yrs.& /0.169***& 0.0852***&
&
0.0417&
& (0.0244)& (0.0218)& & (0.0338)&
30/34&yrs.& 0.134***& /0.170***&
& /0.00334& & (0.0209)& (0.0243)& & (0.0345)& 35/39&yrs.& 0.191***& /0.227***&
& 0.00247&
&
(0.0263)& (0.0317)&
&
(0.0427)& 40+&yrs.& 0.105**& /0.249***&
&
0.116&
& (0.0483)& (0.0588)& & (0.0735)&
Mother's(Race(
& & & &
Black& 0.241***& 0.660***&
&
0.430***&
& (0.0275)& (0.0237)& & (0.0345)&
Asian& 0.348***& 0.287***&
& 0.754***& & (0.0339)& (0.0401)& & (0.0478)& Native&
American& /0.151**& 0.887***&
& 1.247***&
& (0.0732)& (0.0569)& & (0.0696)&
Other& /0.333***& /0.241***&
& /0.0751&
& (0.0355)& (0.0323)& & (0.0480)&
Unknown& 0.0247& 0.0889&
& 0.143&
& (0.0693)& (0.0686)& & (0.0903)&
Mother's(Education(
& & &
No&H.S.& /0.826***& /0.457***&
& 0.125**&
& (0.0670)& (0.0406)& & (0.0602)&
Some&H.S.& /0.629***& 0.0191&
& 0.188***&
& (0.0416)& (0.0270)& & (0.0408)&
Some&College& 0.197***& /0.0222&
& /0.114***&
& (0.0236)& (0.0226)& & (0.0339)&
College&Grad& 0.381***& /0.687***&
& /0.149***&
& (0.0263)& (0.0315)& & (0.0404)&
Unknown& 0.127& /0.535***&
& 0.0544&
& (0.0814)& (0.0775)& & (0.103)&
Father's(Education(
& & &
No&H.S.& /0.907***& /0.435***&
& /0.141**&
& (0.0637)& (0.0412)& & (0.0635)&
Some&H.S.& /0.441***& /0.0222&
& /0.225***&
& (0.0390)& (0.0290)& & (0.0455)&
Some&College& 0.0942***& /0.190***&
& (0.0239)& (0.0252)& & (0.0364)& College&Grad& 0.246***& /0.545***&
& 0.210***&
& (0.0253)& (0.0323)& & (0.0415)&
Unknown& /0.208***& 0.146***&
& 0.0678*&
& (0.0336)& (0.0260)& & (0.0391)&
Income(
& & & &
Ln(Income)& 1.390***& /0.466***&
& /0.0275&
& (0.0165)& (0.0112)& & (0.0173)&
Unknown& 14.07***& /4.352***&
& 0.0146&
& (0.174)& (0.112)& & (0.175)&
Birth(Year(
& & & &
2005& /0.0884**& /0.0171&
& /0.0158&
& 2006& (0.0388)&0.0208& 0.0911***&(0.0318)& & (0.0511)&
& 0.0863*&
& 2007& (0.0387)&/0.0434& (0.0324)&0.0100& & (0.0511)&
& 0.0107&
& 2008& (0.0383)&/0.0138& (0.0322)&0.00377& & (0.0518)& & 0.250***& & 2009& 0.236***&(0.0377)& /0.809***&(0.0316)& & (0.0505)&
& /0.0592&
& 2010& 0.190***&(0.0358)& /0.746***&(0.0376)& & (0.0538)& & /0.227***& & 2011& 0.309***&(0.0354)& /0.451***&(0.0368)& & (0.0542)&
& /0.0309&
& 2012& 0.168***&(0.0350)& /0.242***&(0.0354)& & (0.0516)& & 0.341***& & 2013& 0.135***&(0.0364)& /0.180***&(0.0359)& & (0.0507)&
& 0.323***&
& (0.0355)& (0.0353)& & (0.0504)&
Constant( /14.15***& 5.212***&
& /1.132***&
& (0.173)& (0.114)& & (0.180)&
& & & & &
Observations( 397,914& 397,914& 397,914& 397,914& Robust&standard&errors&in&parentheses&
& &
***&p<0.01,&**&p<0.05,&*& p<0.1&
& & &
Table 1.1 – Relative Risk Ratio–Trends in Insurance Coverage by Type, 2004-2013
( (1)( (2)( (3)( (9)(
VARIABLES& IHMO& Medicaid& Uninsured& Unknown&
Income( && && && &&
Ln(Income)& 4.015***& 0.628***&
& 0.973& & (0.0662)& (0.00704)& & (0.0168)& Birth(Year(
& & & &
2005& 0.915**& 0.983&
&
0.984&
&& (0.0355)& (0.0313)&
&
(0.0503)& 2006& 1.021& 1.095***&
& 1.090*&
&& (0.0395)& (0.0355)&
&
(0.0558)&
2007& 0.957& 1.010&
&
1.011&
&& (0.0366)& (0.0325)&
& (0.0524)&
2008& 0.986& 1.004&
&
1.284***&
&& (0.0372)& (0.0317)&
&
(0.0648)& 2009& 1.267***& 0.445***&
& 0.942&
&& (0.0454)& (0.0167)&
&
(0.0507)& 2010& 1.209***& 0.474***&
&
0.797***&
&& (0.0428)& (0.0175)&
& (0.0431)& 2011& 1.363***& 0.637***&
&
0.970&
&& (0.0476)& (0.0225)&
&
(0.0500)& 2012& 1.183***& 0.785***&
& 1.407***&
&& (0.0431)& (0.0282)&
&
(0.0714)& 2013& 1.145***& 0.835***&
&
1.381***&
&& (0.0406)& (0.0295)&
& (0.0696)& Constant( 7.15e/07***& 183.4***&
& 0.323***& & (1.24e/07)& (21.00)& & (0.0581)&
& & & & &
Observations( 397,914& 397,914& 397,914& 397,914& Robust&seeform&in&parentheses&
& & &
***&p<0.01,&**&p<0.05,&*&p<0.1&
& & &
Table 2.0 – Prenatal Care Consumption by Mothers, 2004-13
( (1)( (2)( (3)(
VARIABLES& 1/8&Visits& 9/11&Visits& 12+&Visits& Insurance(Type( && && &&
[1]&IHMO& & 0.170***& 0.258***& & & (0.0138)& (0.0130)& [3]&Medicaid&
& 0.0638***& 0.142***& & &
(0.0129)& (0.0122)& [9]&Unknown&
&
/0.128***& /0.211***&
& & (0.0178)& (0.0171)&
Income(
& & &
Ln(Income)&
&
0.144***& 0.187***&
& & (0.00684)& (0.00647)&
Birth(Year(
& & &
2005&
&
/0.0288& /0.0645***&
& 2006& & (0.0193)& (0.0180)&
& /0.0280& /0.137***& && & (0.0196)& (0.0185)& 2007&
& /0.0195& /0.0659***&
&& & (0.0190)& (0.0177)& 2008& & 0.0483**& /0.0178& &&
& (0.0193)& (0.0181)& 2009& & 0.0638***& /0.00535& && & (0.0196)& (0.0184)& 2010&
& 0.0530***& /0.0182& && & (0.0197)& (0.0185)& 2011& & 0.111***& 0.0467**& &&
& (0.0201)& (0.0189)& 2012& & 0.115***& 0.0500**& && & (0.0209)& (0.0196)& 2013&
& 0.0803***& 0.0459**&
& &
(0.0200)& (0.0187)& Constant(
&
/1.119***& /1.155***&
& & (0.0708)& (0.0669)&
& & & &
Observations( 397,914& 397,914& 397,914& Robust&standard&errors&in&parentheses&
& ***&p<0.01,&**&p<0.05,&*&p<0.1&
& &
Table 2.1 – Relative Risk Ratio–Prenatal Care Consumption by Mothers, 2004-2013
( (1)( (2)( (3)(
VARIABLES& 1/8&Visits& 9/11&Visits& 12+&Visits& Insurance(Type( && && &&
[1]&IHMO& & 1.185***& 1.295***& & & (0.0164)& (0.0168)& [3]&Medicaid&
& 1.066***& 1.153***&
& &
(0.0137)& (0.0140)& [9]&Unknown&
&
0.880***& 0.809***&
& & (0.0157)& (0.0139)&
Income(
& & &
Ln(Income)&
&
1.155***& 1.205***& &&
& (0.00790)& (0.00780)& Birth(Year(
& & &
2005&
&
0.972& 0.938***&
& 2006& & (0.0187)& (0.0169)&
& 0.972& 0.872***& && & (0.0191)& (0.0161)& 2007&
& 0.981& 0.936***&
&& & (0.0186)& (0.0166)& 2008& & 1.049**& 0.982& &&
& (0.0203)& (0.0178)& 2009& & 1.066***& 0.995& && & (0.0209)& (0.0183)& 2010&
& 1.054***& 0.982&
&& & (0.0208)& (0.0182)& 2011& & 1.117***& 1.048**& &&
& (0.0225)& (0.0198)& 2012& & 1.122***& 1.051**& && & (0.0234)& (0.0206)& 2013&
& 1.084***& 1.047**&
& &
(0.0216)& (0.0196)& Constant(
&
0.327***& 0.315***& Observations( 397,914& 397,914& 397,914& Robust&seeform&in&
parentheses&
& &
***&p<0.01,&**&p<0.05,&*&p<0.1&
& &
Table 3.1 – Relative Risk Ratio–Pregnancy Health Outcomes for Mothers, 2004-2013
( (1)( (2)( (3)( (4)( (5)(
VARIABLES& Extremely&Low& Very&Low& Low& Normal& High&
#(of(PNC(Visits( && && && && &&
9/11&Visits& 0.0895***& 0.210***& 0.556***&
& 1.084***&
& (0.00387)& (0.00738)& (0.00850)& & (0.0306)&
12+&Visits& 0.0578***& 0.144***& 0.429***&
& 1.303***&
& (0.00252)& (0.00504)& (0.00634)& & (0.0343)&
Unknown& 0.555***& 0.637***& 0.835***&
& 1.081&
& (0.0285)& (0.0351)& (0.0241)& & (0.0595)&
Income(
& & & & &
Ln(Income)& 1.068***& 0.969*& 0.931***&
& 1.042***&
& (0.0209)& (0.0182)& (0.00765)& & (0.0137)&
Birth(Year(
& & & & &
2005& 0.890**& 0.938& 1.060**&
& 0.924**&
& 2006& 0.807***&(0.0467)& (0.0488)&0.916*& (0.0254)&1.028& & (0.0362)&
& 0.982&
& 2007& 0.788***&(0.0443)& 0.851***&(0.0488)& 0.924***&(0.0251)& & (0.0388)&
& 0.940&
& 2008& 0.626***&(0.0412)& 0.687***&(0.0441)& 0.916***&(0.0221)& & (0.0356)&
& 0.962&
& 2009& 0.636***&(0.0353)& 0.704***&(0.0381)& 0.911***&(0.0221)& & (0.0366)&
& 1.010&
& 2010& 0.577***&(0.0363)& 0.673***&(0.0394)& 0.880***&(0.0223)& & (0.0384)&
& 0.963&
& 2011& 0.512***&(0.0338)& 0.648***&(0.0380)& 0.806***&(0.0217)& & (0.0369)&
& 0.974&
& 2012& 0.515***&(0.0316)& 0.509***&(0.0375)& 0.784***&(0.0204)& & (0.0377)&
& 1.054&
& 2013& 0.474***&(0.0330)& 0.601***&(0.0331)& 0.815***&(0.0208)& & (0.0412)&
& 0.973&
& (0.0296)& (0.0353)& (0.0206)& & (0.0371)&
Constant( 0.146***& 0.291***& 1.534***&
& 0.0789***&
& (0.0292)& (0.0558)& (0.130)& & (0.0108)&
& & & & & &
Observations( 198,459& 198,459& 198,459& 198,459& 198,459& Robust&seeform&in&parentheses&
& & & &
***&p<0.01,&**&p<0.05,&*&p<0.1&
& & & &
Works Cited
Anderson, Michael L., Ph.D., Carlos Dobkin, Ph.D., and Tal Gross, Ph.D. "The Effect of Health
Insurance on Emergency Department Visits: Evidence from an Age-Based Eligibility
Threshold." The Review of Economics and Statistics 96.1 (2014): 189-95. Web. 22 Oct.
2016.
Barbaresco, Silvia. Journal of Health Economics: Impacts of the Affordable Care Act Dependent
Coverage Provision on Health-Related Outcomes of Young Adults. 40 Vol. Elsevier,
03/2015. Web. 23 Oct. 2016.
Busch, Susan H., Ph.D., Ellen Meara, Ph.D., Haiden A. Huskamp, Ph.D., and Colleen L. Barry,
Ph.D. "Characteristics of Adults With Substance Use Disorders Expected to Be Eligible
for Medicaid Under the ACA." The American Journal of Psychiatry 64.6 (2013): 520-26.
Web. 22 Oct. 2016.
Cohen, Robin A., Martinez, Michael E., “Health insurance coverage status for young adults by
age group, year, and quarter, January 2008–June 2011.” CDC report. Web. 22 Oct. 2016.
Deber, Raisa Berlin, PhD., Health Care Reform: Lessons From Canada. American Journal of
Public Health: January 2003, Vol. 93, No. 1, pp. 20-24.
Gruber, Jonathan. "THE IMPACTS OF THE AFFORDABLE CARE ACT: HOW
REASONABLE ARE THE PROJECTIONS?" Working paper series (National Bureau of
Economic Research), working paper 17168. National Bureau of Economic Research,
(June 2011). 26 p.
Sommers, Benjamin D. JAMA : The Journal of the American Medical Association: The
Affordable Care Act and Insurance Coverage for Young Adults. 307 Vol. American