CORROSION PERFORMANCE OF 1014 MILD AND 304
STAINLESS STEELS IN ACIDIC MEDIA
ADEGBENRO OMOTOSOA, PETER O. AIYEDUNB, OLAYIDE R.
ADETUN-JIC*, TOYIN A.AROWOLOD, AND FEMI T.OWOEYEE*,
123Department of Mechanical Engineering Federal University of Agriculture, Abeokuta,
Nigeria.
4Department of Environmental Management and Toxicology, Federal University of
Agri-culture, Abeokuta, Nigeria.
5Metallurgical Engineering Department, Yaba College of Technology, P. M. B. 2011,
Yaba, Lagos, Nigeria.
*Corresponding author: aomotoso2009@yahoo.com Tel: +2348033467246
ABSTRACT
Corrosion is a degradation of metallic materials under the action of the environment which requires oxygen and moisture to occur. This research work determined the corrosion performance of 1014 low carbon and 304 austenitic stainless steels in different concentration of acidic media. Corrosion tests were carried out using gravimetric technique. One hundred and eighty samples of the metals were prepared and immersed in containers of sulphuric acid (H2SO4), hydrochloric acid (HCl) and nitric acid
(HNO3) at 1, 2 & 3 M. The samples were then removed every three days for a period of 15 days to
measure the weight loss. These were used to calculate the corrosion rates. The chemical analysis was determined using an Energy Dispersive X-ray (EDX). Scanning Electron Microscope (SEM) was used to determine the texture of the samples. The results showed that the corroded samples had pitting corrosion damage and cracks propagated generally on the sample surfaces. The corrosion rates of the samples increased with increase in molarities of the reagents, Stainless steel samples had the least corroded surfaces. The study concluded that the higher the level of concentration of acidic media (1 to 3 M), the higher the corrosion rates of samples in increasing order of HNO3, HCl and H2SO4 especially
for mild steel sample (4.35 to 17.90, 0.21 to 2.90 and 10.37 to 0.64 mm/y) after 360 hours of immer-sion respectively.
Keywords: Corrosion, Ferrous metals, SEM, EDS, Gravimetry, Acidic media
Science, Engineering and Technology
Print - 2277 - 0593 Online - 2315 - 7461
© FUNAAB 2017
INTRODUCTION
Corrosion is the deterioration of materials by chemical interaction with their environ-ment. The consequences of corrosion are many and varied and their effects on the safe, reliable and efficient operation of equipment or structures are often more se-rious than simple loss of a mass of a metal. Adetunji et al., 2011 studied the
electro-chemical property of mild steel in cassava fluid. They reported that after 312 hours of immersion, mild steel had corrosion rate of 1.7 mm/y. The consequence of corrosion damage reported was reduction of metal thickness leading to loss of mechanical strength and structural failure or breakdown (Umoren, 2009).
Onen reported in 2000 that corrosion may also be considered as a redox process in which an oxide coating is formed on the surface of the metal/alloy undergoing the process. It requires oxygen and moisture to occur. It involves the transfer of electrons along the surface of the metal under the influence of a potential difference.
Corrosion is a matter of great concern due to the enormous cost involved in the re-placement of metallic parts in all kinds of applications (Loto, 2012). The reaction in this corrosive attack requires a medium, usually water, which is capable of conduct-ing a tiny current of electricity. When a met-al comes in contact with a corrosive agent and it is connected by a liquid or gaseous path through which electrons may flow, corrosion begins as the metal decays by oxi-dation. During the attack, the quantity of corrosive agent is reduced and, if not re-newed or removed, it may completely react with the metal, becoming neutralized (Katundi et al.,2010).
It was reported that the enormous usage of thin steel sheets for automotive application for reducing car weight necessitates im-proved material strength in addition to higher corrosion protection. Sanusi and Hussein (2001) investigated on a mild steel alloy with a thickness of 0.1 cm, cut into specimen of sizes of 4 cm by length and 2.5 cm by width and perforated at the centre. The corrosive effect of acidic media on mild steel samples was determined by Osarolube et al. (2008). It was found that mild steel had slightly high corrosion in the acidic media.
Adetunji, et al. (2016) and Loto (2012) stud-ied the electrochemical effect of orange juice on metallic can. It was found that the
relative acidity of the solution is the most important factor to be considered; at low pH, the evolution of hydrogen tends to elim-inate the possibility of protective film for-mation so that steel continues to corrode but in alkaline solutions, the formation of pro-tective film greatly reduces corrosion rate. Badmos and Ajimotokan (2009) also report-ed their research findings on effect of citrus species on mild steel. Sanusi and Hussein (2001) also worked on the effect of natural orange juice on mild steel. It was found that the weak acid in the juice affected the corro-sion rate after exposure. Adetunji et al., 2012 reported research finding on corrosion of austenitic steel in seawater, cassava fluid and maize pulp, low corrosion rate was got in the media. Mild and stainless steel found applica-tions in processing chemical plants like hy-drochloric, nitric and sulphuric acid plants. Huge amount of money are spent to repair and replace corroded parts. This research work therefore, determined the corrosion performance of mild and stainless steels in different concentrations of acidic media us-ing gravimetry and SEM. Specifically, corro-sion rates and extent of damages were evalu-ated in HCl, HNO3 and H2SO4 at 1, 2 and 3
molarities.
MATERIALS AND METHODS
Samples Preparation
The two metals used for this research work were stainless steel and mild steel. The sam-ples for weight loss tests were prepared in accordance to the procedure recommended by ASTM G.1, 2003. The samples were cut into rectangular sizes of 20 mm by 20 mm and a thickness of 1.0 mm. These samples were cut from the parent materials with the
help of shears, while a steel rule and scriber were used for the dimensioning. Ninety samples were prepared from each of the metallic samples (stainless and mild steels) making a total of 180 samples.
Reagents
The pure and analytical three reagents used for this study were purchased from a local supplier. These are sulphuric acid (98% vol-ume of H2SO4), hydrochloric acid (75%
volume of HCl) and Trioxonitrate (V) acid (75% volume of HNO3).
Materials Characterization
The characterization employed were chem-ical analysis by EDX, surface morphology by SEM and gravimetry by Adventurer TM balance.
Chemical Analysis
The chemical analyses to determine the composition of the samples were done us-ing Energy Dispersive X-ray (EDX) ma-chine model JEOL 840. The examination was done by cutting samples into square of 15 mm. They were mechanically ground and polished. The mirror-like polished sam-ples were carbon coated before analysis in order to make samples surfaces conclusive.
Scanning Electron Microscopy
A Scanning Electron Microscopy machine was employed to conduct cross sectional analyses of the samples surfaces. The mi-crostructure and morphology of the sam-ples were taken before and after specified period of immersion at a research centre.
Corrosion Studies Experimental Procedures
All the prepared samples were first rinsed in distilled water to remove all the foreign ma-terials and were dry-cleaned with acetone
solution in order to remove any traces of water on their surfaces. Each of the samples was weighed by electric weighing balance of Adventurer TM (power equipment 50/60Hz, 6VA, model number of AR3130, maximum weight of 310 g and readability of 0.001 g).
Immersion of Samples
Each of the prepared samples was immersed in different containers. They were fully im-mersed at room temperature after the initial weight has been recorded. Each sample were immersed in acidic media of 1 M, 2 M and 3 M concentrations, and then removed after 3,6,9,12 and 15 days. The samples were properly cleaned and dried. The weight loss and pH of media were determined. Each test was carried out in duplicate and the mean weight losses were reported.
Theory/Calculation
The mathematical formula by Fontana (1987), for calculating the corrosion rates of the samples after the weight loss measure-ment is stated as follow:
(mm/y)
Where, CR = corrosion rate in millimeter per year, W = weight loss in mg, this was done by subtracting the final weight measured from initial weight which gave the weight loss (weight difference), ρ = density of each sample in mg/m3, A = Area in cm2
and T = Time in hours, of each of the sam-ples spent inside the different concentrations of the acidic media.
The redox electrochemical reaction for the metals immersed in acidic media is repre-sented below;
RESULTS
Characterization of Sample Materials Chemical Analysis
The percentage chemical compositions of samples used for this research work; stain-less and, mild steel were shown from Tables
1 to 2 respectively. In Table 1, the highest percent was Chromium of 20 % after Iron which determined the ability of stainless steel to resist corrosion. In Table 2, the mild steel is a ferrous metal with largest percentage val-ue of iron (98.35%),
Table 1: Percentage Chemical compositions of 304 Stainless steel (SS)
Elements C Mn P S Si Cr Ni Al Fe
Composition 0.08 2.00 0.05 0.03 0.75 20.26 8.00 0.10 68.73
Table 2: Percentage Chemical compositions of 1014 Mild steel (MS)
Elements C Mn P S Si Cr N Cu Fe
Composition 0.14 0.48 0.02 0.01 0.18 0.79 0.01 0.03 98.34
Scanning Electron Microscopy
The scanning electron microscopy (SEM) images of samples surfaces before the time of immersion in different concentration of acidic media are shown in Plates 1 and 2. Plate 1 shows SEM image of stainless
be-fore (a) and after immersion (b) of stainless steel surface. SEM image of stainless steel after immersion for a period of 10 days shows large grains throughout the surfaces as a result of corrosion attack.
(a) SEM of SS Sample before (sion in HNO3 b) SEM of SS Sample after
(c) SEM of SS Sample before in HCl
(d)SEM of SS Sample after im-mersion in HCl
Plate 1: SEM of Stainless Steel (SS) samples before and after immersion in various acidic media in 1M.
(a) SEM of MS Sample before Immersion (b) SEM of MS Sample after immersion in HNO3
c d
a b
(c)SEM of MS Sample after immersion in H2SO4 (d) SEM of MS Sample after immersion in H2SO4
Plate 2: SEM of Mild Steel (MS) samples before and after immersion in various acidic media in 1M.
Rate of Corrosion of Metal Samples
The results obtained from the investigation of corrosion rates of mild and stainless steel
are contained in Tables 3 to 5 and the trends are illustrated in Figures 1 to 3.
Table 3: Corrosion rate of metal samples (mm/y) in 1.0 Molar of different Solutions
Samples 72HRS 144HRS 216HRS 288HRS 360HRS
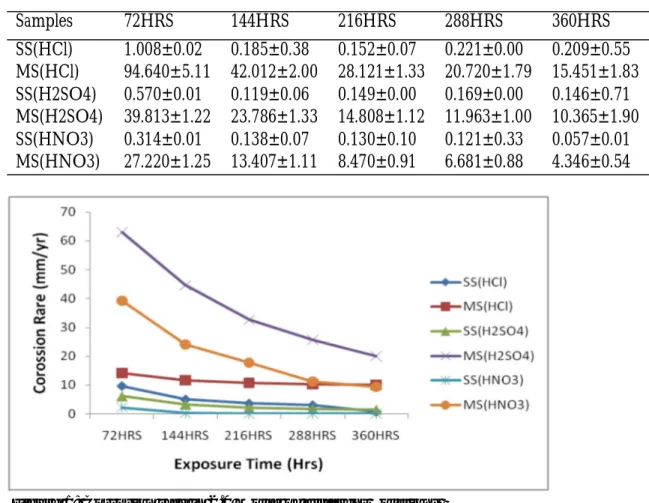
SS(HCl) 1.008±0.02 0.185±0.38 0.152±0.07 0.221±0.00 0.209±0.55 MS(HCl) 94.640±5.11 42.012±2.00 28.121±1.33 20.720±1.79 15.451±1.83 SS(H2SO4) 0.570±0.01 0.119±0.06 0.149±0.00 0.169±0.00 0.146±0.71 MS(H2SO4) 39.813±1.22 23.786±1.33 14.808±1.12 11.963±1.00 10.365±1.90 SS(HNO3) 0.314±0.01 0.138±0.07 0.130±0.10 0.121±0.33 0.057±0.01 MS(HNO3) 27.220±1.25 13.407±1.11 8.470±0.91 6.681±0.88 4.346±0.54
Figure 1: Corrosion rate in 2.0 Molar of different Solutions
Table 4: Corrosion rate of metals in 3.0 Molar Solutions of three media
Samples 72HRS 144HRS 216HRS 288HRS 360HRS SS(HCl) 10.275±1.44 4.705±0.00 3.454±0.11 3.006±0.44 2.895±0.11 MS(HCl) 44.773±2.06 18.395±1.09 16.523±0.56 25.469±1.00 20.509±1.57 SS(H2SO4) 9.325±0.96 6.692±0.00 3.311±0.22 2.690±0.11 2.028±0.33 MS(H2SO4) 79.984±2.55 49.321±2.01 33.952±0.81 26.489±0.65 20.939±0.12 SS(HNO3) 0.314±0.00 0.152±0.22 0.101±0.99 0.078±0.00 0.061±0.00 MS(HNO3) 62.538±3.11 33.274±0.42 26.190±1.00 16.412±0.21 17.895±0.88
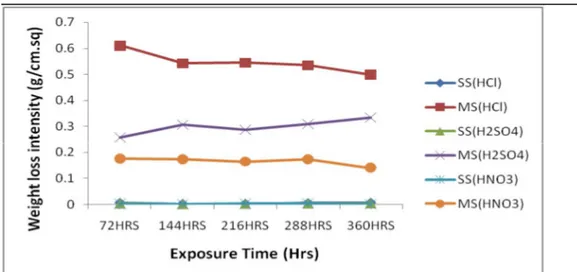
Figure 2: Weight loss Intensity of metals (g/cm.sq) in 1.0 Molar Solutions of three media
Table 5: Weight loss Intensity of metals (g/cm.sq) in 2.0 Molar Solutions of three media
Samples 72HRS 144HRS 216HRS 288HRS 360HRS
SS(HCl) 0.0631±0.01 0.0651±0.00 0.0701±0.01 0.0774±0.00 0.0229±0.11 MS(HCl) 0.0912±0.00 0.1503±0.11 0.2110±0.28 0.2667±0.30 0.3271±0.55 SS(H2SO4) 0.0405±1.01 0.0436±0.10 0.0393±0.03 0.0461±0.00 0.0469±0.00 MS(H2SO4) 0.4073±0.00 0.5762±0.39 0.6322±1.05 0.6621±1.31 0.6452±1.05 SS(HNO3) 0.0144±0.03 0.0019±0.00 0.0005±0.00 0.0018±0.00 0.0020±0.00 MS(HNO3) 0.2537±0.15 0.3121±0.20 0.3446±0.10 0.2899±0.00 0.3045±0.51
Figure 3: Weight loss Intensity of metals (g/cm.sq) in 3.0 Molar Solutions of three media
Table 3 displayed the corrosion rate of two ferrous metal samples against the time of exposure of samples in 1.0 molar of three acidic media. The corrosion rates of stain-less steel and mild steel samples in the three different acidic media generally decreased steadily with an increase in exposure times from 72 to 360 hours. The corrosion rates of samples in acidic media decreased in or-der of solutions of Hydrochloric acid (HCl), Sulphuric acid (H2SO4) and Nitric acid
(HNO3). The corrosion rates of the two
samples (stainless steel and mild steel in the same acidic medium of HCl at first expo-sure time of 72 hours were 1.008±0.02 and 94.640±5.11 mm/y, in acidic media of H2SO4 were 0.570±0.01 and 39.813±1.22
mm/y and in solution of HNO3 were
0.314±0.01 and 27.220±1.25 mm/y respec-tively.
Table 4 exhibited the corrosion rate of two ferrous metal samples against the time of exposure of samples in 3 molar of three acidic media. The corrosion rates of the samples in three solutions decreased steadily as the exposure time increased from 72 to 360 hours. The corrosion rates of stainless steel in solution of HCl decreased from 10.275±1.44 to 2.895±0.11 mm/y while mild steel samples in the same acidic medi-um decreased also from 44.773±2.06 to 20.509±1.57 mm/y as the exposure time increased from 72 to 360 hours.
Figure 3 showed the graph of weight loss intensity of two ferrous metal samples in 3.0 molar of three different acidic solutions. The highest weight loss intensity was
no-ticed on mild steel samples in solutions of H2SO4. The weight loss intensity of mild
steel sample in the solution of HCl decreased from exposure time of 72 hours to 144 hours and ascended rapidly at this time to compete with highest value of mild steel in solutions of H2SO4 at final exposure time of
360 hours. The least weight loss intensity of stainless steel samples in three different acid-ic media was observed in HNO3 while the
stainless steel samples in solutions of H2SO4
and HCl competed with each other as the exposure times increased from 72 to 360 hours.
DISCUSSION
SEM picture of stainless steel in H2SO4 after
immersion for 10 days displays boundary pitting with 2/3 as a result of corrosion ef-fect while in HCl had a deep-wide cracks as well as little white watery pattern in right hand top corner after 10 days of immersion as shown in Plate 1. This confirmed the sus-ceptibility of stainless steel to pittings in chloride environment. The mild steel sample before immersion exhibits some parts with spot white patches in the natural state. SEM image after immersion in HNO3 shows
con-spicuous crystalline grains of ¾ of surface erosion. The corrosion effect of H2SO4 was
so glaring with some big gray patches and blocks crystals of about 4/5 of sample sur-faces while mild steel with HCl had little white patches for about ½ of the sample sur-faces as shown in Plate 2.
The corrosion rates of mild steel samples were much higher than that of stainless steel samples. This is in agreement with earlier researchers (Sanusi et al., 2001; Umoren, 2009; Onen, 2000;Loto, 2012). Figure 1 shows the graph of corrosion rates of the
two ferrous metal samples versus the expo-sure time in three different 2.0 molar solu-tions. The corrosion rates of all metal sam-ples in three different acidic media declined with an increase in exposure times from 72 to 360 hours. The highest impact of corro-sion rate was noticed on mild steel in solu-tion of H2SO4 while least impact was
ob-served on stainless steel in solution of HNO3. The corrosion rate of mild steel in
solution HCl maintained nearly the same values throughout the exposure time. In Figure 2, it shows the weight loss intensity of two ferrous metals samples in 1.0 molar of three different acidic media. The weight loss intensity of all the mild steel samples in different acidic media showed a wide dis-tinct gap with those of stainless steel sam-ples in the same acidic media. The highest weight loss intensity was observed on mild steel samples in solution of HCl and this was followed by the same with solution of H2SO4 after 360 hours of immersion.
Table 5 shows the weight loss intensity of two ferrous metals samples in 2.0 molar of different acidic solutions. Generally, there was an increase in weight loss intensity of all the metal samples in different acidic me-dia as period of exposure times increased from 72 to 360 hours. There were signifi-cant effects of weight loss intensity of the two metal samples in the solutions of H2SO4; the weight loss intensity of mild
steel samples in this said solution had high-est value of 0.4073±0.00 g/cm.sq while that of stainless steel had value of 0.0405±1.01 g/cm.sq at 72 hours of exposure time. It also showed that the weight loss intensity of the metal samples with solutions of HNO3
had the least effect among three acidic me-dia. At the last exposure time 360 hours, the
highest values of weight loss intensity were noticed on mild steel samples in solutions of H2SO4 and HCl as 0.6452±1.05 g/cm.sq and
0.3271±0.55 g/cm.sq respectively while the least effect of samples was noticed in solu-tion of HNO3. The highest corrosion rate
was observed on mild steel sample in acidic solution of H2SO4 (79.984±2.55) at first
ex-posure time and the least rate was noticed on stainless steel sample in solution of HNO3
(0.061±0.00) at exposure time of 360 hours. It was shown that the highest impact of cor-rosion rate of stainless steel was in solution of HCl (10.275±1.44) at 72 hours while that of mild steel sample was in solution of H2SO4 (79.984±2.55) (Osarolube et al.,
2008).
CONCLUSIONS
It can be concluded that the corroded sam-ples had pitting corrosion damage and cracks propagated generally on the sample surfaces. It was observed averagely that the corrosion rates of the samples increased with increase in molarities of the reagents, Stainless steel samples had the least corrosion rate and this was due to its high resistance to corrosion. The percentage composition of chemical analysis of stainless steel showed that it has the highest percentage composition of chro-mium (20.0%). The research can then be fi-nally concluded that the higher the level of concentration of acidic media, and corrosion rates of samples in acidic media decreased in order of H2SO4, HCl and HNO3 after fifteen
days of immersion for mild steel samples for 2 and 3 M solutions. Austenitic stainless steel is a better choice of materials in acidic media than mild steel.
REFERENCES
Adetunji, O.R., Akinyemi,O.J, Kuye, S.I and Dare, E.O. 2016. Corrosion
Perfor-mance of Aluminium Zinc Coated Steel in Tomato, Orange and Pineapple Juices.
Cor-rosion and Protection, Vol.
59(3);pp.66-69,www.ochronaprzedkoroza.pl, doi:10.15199/40.2016.3.2
Adetunji, O.R, Aiyedun, P.O, Alamu, O.J., Surakat, A.S Electrochemical
prop-erties of metals in cassava fluid Journal of
Engineering and Technology Research, 2011, Vol 3(10): pp.292-297. Published by Academic
Journals.
Adetunji, O.R., Aiyedun, P.O. ,Arowolo, T.A., Alamu, O.J. Corrosion Resistance of
Austenitic Stainless Steel in Cassava Fluid, Maize Pulp and Sea Water, Pacific Journal of
Science and TechnologyVol. 2012,13 (2): 8-12 Published by Akamai University of United States of America.
ASTM G 8-86[2003].’Standard Practice for Operating Fluorescent Light Apparatus for UV Exposure of nonmetallic Materials.’ American Society for Testing and Material [ASTM] Introduction, West Conshohocken. PA. 2004.
Badmos, A.Y., Ajimotokan, H.A. 2009.
The Corrosion of Mild Steel in Orange Juice environment. www.unilorin.edu.ng/ publication.
Fontana, M.G. 1987. Corrosion
Engineer-ing, 3rd ed. Mc Graw-Hill, International Ed. 171pp.
Katundi, D., Tosun-Bayraktar,A.,
Bay-raktar, E., Toueix, D. Corrosion Behaviour
of the Welded Steel Sheets used in Automo-tive Industry, Journal of Achievements in
Materi-als and Manufacturing Engineering,2010, 38 (2):146-153.
Loto, C.A. Electrode Potential Evaluation
of Effect of Inhibitors on the Electrochemi-cal Corrosion Behaviour of Mild Steel Rein-forcement in Concrete in H2SO4. J. Mater.
Environ. Sci. 2012, 3(1):195-205.
Loto, C. A., Popoola, A. P. I., Fayomi,
O. S., Loto, R. T. 2012. Corrosion
polariza-tion behaviour of type 316 stainless steel in strong acids and acid chlorides. International
Journal of Electrochemical Science. Vol. 7: Pg. 3787 – 3797.
Onen. P.K. 2000. Corrosion of metals.
American Society for Metals, Cleveland, Ohio,2000,pp56.
Osarolube, E., Owate, I. O. and Oforka, N. C. 2008. Corrosion behaviour of mild
and high carbon steels in various acidic me-dia. Scientific Research and Essay,2008,
3(6):224-228.
Sanusi, K.O., Hussein, K.O. 2001.
Investi-gation of corrosion effect of mild steel on o r a n g e j u i c e . A f r i -can Journal of Biotechnology,
2001,10(16):3152-3 1 5 6 .
http://www.academicjournals.org/AJB.
Umoren, S.A. Polymers as Corrosion
In-hibitors for Metals in Different Media-A Re-view. The Open Corrosion Journal,2009,
pp175-188.