Esther Soo Hyun Kim
April2002
A Master's paper submitted to the faculty of the University ofNorth
Carolina at Chapel Hill in partial fulfillment of the requirement for the
degree ofMaster of Public Health in The School ofPublic Health,
Health Care and Prevention Program.
Approved by
Duke Research Mentor
Duke Study Program Director
UNC SPH Advisor
---Introduction: Diabetes Mellitus is a significant public health problem in the United States that results in significant morbidity, mortality, and health care costs. While it is known that tight glucose control is crucial to prevent complications of diabetes, previous studies have shown that inadequate functional health literacy among diabetic patients is associated with low knowledge about diabetes self-management which may hinder patients' ability to adequately control their blood sugars. Many previous studies have examined the association between low literacy and poor diabetes knowledge, but few have examined the association between low literacy and diabetes control as measured by biological measures such as hemoglobin Ale.
Methods: Two hundred patients at the Durham VA were surveyed with a demographic questionnaire and tested for literacy using the Rapid Estimate of Adult Literacy in Medicine. Most recent hemoglobin AI c from computerized records was used to assess glycemic control.
Results: Persons who were older, had less education, or were non-white had lower levels of literacy. Older persons and those who did not have help at home had lower hemoglobin AI c' s than those who were younger or had help at home. When adjusted for age, race, level of education, employment status, financial status, having help at home, and living alone, there was no association between literacy and hemoglobin Ale.
Introduction
Diabetes is an important disease in the United States with high prevalence and a high incidence rate. Based on the estimates calculated by the CDC, it has been estimated that 17 million people (16.2% ofthe population) in the United States have diabetes1, and that one
million new cases are diagnosed each year in people aged twenty or older. In 1999, diabetes was the sixth leading cause of death listed on U.S. death certificates, with heart disease being the leading cause of death related to diabetes. In addition to heart disease, people with diabetes are at higher risk for other macrovascular and microvascular complications such as hypertension, stroke, peripheral vascular disease, retinopathy, nephropathy, and neuropathy resulting in substantial health care costs. In 1997, it was estimated that the total cost of diabetes in the U.S. was $98 billion dollars (direct medical costs $44 billion, indirect costs (disability, work loss, premature mortality) $54 billion).
It has been previously shown that tight blood glucose control decreases the progression of diabetic microvascular disease in both insulin-dependent and non-insulin dependent diabetes mellitus 2-5 As stated by the National Standards for Diabetes Self-Management Education
Programs6, a crucial component of glycemic control is proper self-management and appropriate
education may be cultural, psychosocial, or demographic, but one barrier that has been incompletely explored is the effect of illiteracy.
According to the results of the 1992 National Adult Literacy Survey, a project funded by the U.S. Department of Education's National Center for Education Statistics, nearly 40 million adults in the U.S. are functionally illiterate and lack the basic reading skills necessary to function in societ/. Given that written materials are frequently used in self-management education for diabetes, low literacy among diabetic patients could be a potentially significant barrier to effective self-management and tight glycemic control. Indeed, in a study by Williams et al10 involving 2659 patients at two urban, public hospitals in the U.S., it was reported that a high proportion of patients were unable to read and understand written basic medical instructions. Forty-one percent of patients were unable to comprehend directions for taking medications on an empty stomach, 26% were unable to understand information regarding when a next appointment was scheduled, and 59.5% could not understand a standard informed consent document.
Furthermore, 35.1% ofEnglish-speaking patients and 61.7% of Spanish-speaking patients had inadequate or marginal functional health literacy as measured by the Test ofFunctional Health Literacy in Adults (TOFLHA) (administered in both English and Spanish)11 These findings of a high prevalence oflow functional health literacy among diabetic patients were supported by a study examining functional health literacy in urban African-Americans which showed that functional health literacy as measured by the TOFHLA was inadequate in half of the patients studied (n = 131 )12
Language Skills Program15 was independently associated with poor health status as measured using the Sickness Impact Profile16, a behaviorally based measure of sickness-related
dysfunction. In addition, further analysis of the study population used by Williams et a!
mentioned above by Baker et al17 showed that self-reported health was strongly associated with functional health literacy and that patients with inadequate functional health literacy were more likely than patients with adequate functional health literacy to report their health as poor.
While the association between low literacy and poor health and the association between low literacy and poor diabetes knowledge has been previously described, very few studies have examined the direct association between literacy and biological markers of diabetes control, i.e. hemoglobin Ale. As described above, Williams et al18 showed no association between literacy level and hemoglobin Ale, but lack of association in their study was partly attributed to small sample size. Given that low literacy is a very prevalent public health problem that has available interventions, it is important to understand the relationship literacy and another very prevalent public health problem, diabetes. In this study, we will examine the relationship between literacy and diabetes control using a sample of 200 patients recruited from the outpatient clinics of a Veterans Affairs Medical Center.
Methods
After review and approval of the research protocol by both Duke and University of North Carolina at Chapel Hill Institutional Review Boards, two hundred subjects were enrolled over a span of four months from within the outpatient clinics of the Durham VA Medical Center. Subjects were eligible for the study if they were able to give informed consent and were taking medication for their diabetes, either insulin or oral hypoglycemics. Potential subjects were identified by review of patient charts the day before clinic appointments. Once identified, patients were approached and asked to participate in the study while they waited for their appointments. Patients who were unable to consent were excluded from the study. Once consented, patient demographics were assessed using a demographics survey, literacy level was assessed using the Rapid Estimate of Adult Literacy in Medicine (REALM)19, and vision was
tested using the vision chart developed by the Early Treatment Diabetic Retinopathy Study Research Group (ETDRSi0 The patient demographics questionnaire asked questions about
I
i
f=
race, age, marital status, education level, gender, employment status, financial status, number of persons living in their residence, presence of persons who could provide assistance should they need it, exercise frequency, and smoking status (Appendix 1 ). The REALM was administered by three trained research assistants to assess subject literacy levels19, and vision was tested using
a vision chart developed by the ETDRS group according to protocol. Patients who could not read due to poor vision or inability to read had the survey questions and answer choices read to them. Patients who required more time to finish the survey packet were allowed to take the
remaining portions home and were supplied with a self-addressed, stamped enveloped to return
L
the survey.The REALM is a reading recognition test that was developed as a quick screening tool to assist physicians in identifying patients with limited reading skills and in estimating patient
I
reading levels21. The original test developed by Davis et a! was comprised of 125 words, and all
words on the instrument were chosen from patient education materials and patient intake forms used in university based primary care clinics. This first version of the REALM was shown to be valid with results highly correlated to other previously validated reading tests. A shortened version ofthe REALM was developed three years later to be more practical as a screening instrument in busy medical settings, and it is this shorted version of the REALM that we used in this present study.
difficulty, they were instructed to look down the list and pronounce as many of the remaining words as they could. The REALM was administered by one of three trained research assistants who kept score on a separate scoring copy. Raw scores were the sum of the number of words pronounced correctly (range 0-66), and raw scored could be converted into grade range estimates. Raw REALM scores between 0 and 18 translate to estimated reading levels of third grade or below, 19-44 to estimated reading levels offourth to sixth grade, 45-60 to seventh to eighth grade, and 61-66 to estimated reading levels of ninth grade and above22
Similar to the original version of the REALM, the shortened REALM has been shown to perform well as a screening instrument to identify those patients with low reading ability with highly positive correlations found between the REALM and previously validated and reliable reading recognition tests used in other settings such as the Slosson Oral Reading Test-Revised (r=0.96, P<0.0001), the reading recognition portion of the Peabody Individual Achievement Test-Revised (r=0.97, P<0.0001), and the Woodcock-Johnson Tests of Achievement-Letter Word Recognition subtest (r=0.88, p<0.0001i2
Visual acuity was assessed using the method described by the Early Treatment Diabetic Retinopathy Study (ETDRS) group20 In the ETDRS, best-corrected visual acuity was measured with logarithmic visual acuity charts at a distance of 4 meters, and at 1 meter as well if visual acuity was worse than 20/100. The visual acuity charts used in the ETDRS had 14 rows of five letters each, corresponding to visual acuities from 20/10 to 20/200 when viewed at a distance of 4 meters. When 20 or more letters were read correctly at 4 meters (corresponding to visual acuity of20/100 or better), the visual acuity was the number read correctly plus 30 (the total number of letters on the top six lines of the chart, which were used at a 1-meter distance for testing low visual acuity). When fewer than 20 letters were read correctly at 4 meters, only the
number ofletters read correctly at 1 meter of the 30 letters on the top 6lines was added to the 4-meter total to obtain the visual acuity score. A perfect visual acuity score was 100,
corresponding to a visual acuity of20/10 (Appendix 3,4).
Hemoglobin Ale is a long-term indicator of glycemic control, and diabetic patients with hemoglobin AI c levels <;,7% are considered to have good glycemic control while patients with hemoglobin Ale levels >7% are considered to have poor glycemic control. To assess diabetes control in this study population, the most recent hemoglobin Ale levels drawn within one year of
.
the study enrollment date were extracted from the computerized records. If patients were seen at L '
multiple VA medical centers, remote data were accessed to obtain the most recent hemoglobin Ale.
l
Statistical analyses were performed using STAT A software 23 Univariate analyses were
I
Results
Two hundred-twenty subjects were approached to participate and 200 were enrolled. Of the 200 subjects enrolled in the study, one person was excluded for not being on medications and two people were excluded for not having hemoglobin Ale's drawn through the VA medical system within one year prior to enrollment in the study. Of the 197 subjects remaining, six did not complete the REALM. Of the 191 subjects with recent hemoglobin Ale's and a completed REALM, 181 completed a demographic survey (Figure 1).
Figure 1: Patient Enrollment and Attrition
I
200 enrolled
/
~
197 HbAlc yes I not on meds
2 no HbA!c win year of survey
191 REALM performed 6 REALM not performed
/~
181 completed demographics survey 10 did not complete demographics snrvey
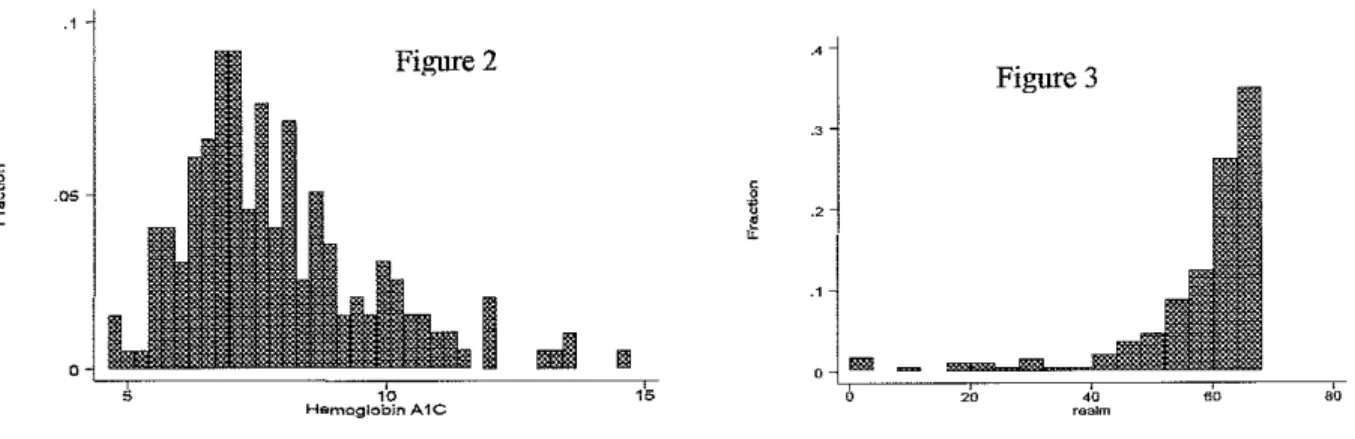
median 61 (interquartile range 55-64), and 45.3% of subjects read below an 8th grade level (Figure 3) (Table 1 ). The mean ETDRS score for both eyes was 74 out of a possible 100,
corresponding to visual acuity equivalent of20/32. The median ETDRS score for both eyes was 78 out of a possible 100, corresponding to a visual acuity of 20/25. Given these results, visual acuity was not used in any further analyses since poor vision was not a significant problem in our study population.
'i
I
o•
~
I
Figure 2
JL,---.-,~,
_I
_mm
---ceil,,Hemoglobin A1C
Figure 2: Values for hemoglobin Ale were skewed to the
right.
·'
Figure 3
Figure 3: Values for REALM scores were skewed to
the left.
There was a statistically significant association between REALM score and age, race, educational status, and employment status. As age increased, median realm score decreased (r = -0.1729, p=0.0203), whites had higher median realm scores than non-whites (63 versus 60, p = 0.0009), and employed people had higher median realm scores than those who were unemployed (63 versus 60, p = 0.0102). People with more education had higher median realm scores (p = 0.0001), patients who were had high school education or less had a median REALM score of 57, those with some vocational training or some college had a median REALM score of 63, and those with some college or graduate level education had a median REALM score of 64. This relationship between education level attained and REALM score gives further validation of the REALM as a literacy measure. Finally, the association between financial status and median realm score neared statistical significance with people who considered themselves to have enough money having higher median realm scores than those who considered themselves to not have enough money (62 versus 60, p = 0.0543).
i'o---
I
t
I
The relationship between median hemoglobin A1 c was not significantly different
between those subjects who read below an eighth grade level and between those who read above
an eighth grade level in bivariate analysis (7.6 versus 7.4, p = 0.5311). When adjusted for
variables that had significant or near significant associations with either REALM or hemoglobin
A1 c (living alone, age, race, level of education, employment, or self-perceived financial status)
using quantile regression, there was no statistically significant difference in median hemoglobin
Logistic regression using categorized mean REALM scores and mean hemoglobin Al c values also did not result in statistically significant relationship between REALM scores and
hemoglobin Ale levels, adjusted or unadjusted.
L Discussion
Three important points about our study population must be made before an extensive discussion about the results can begin: 98% of patients were male, there was a high level of literacy with greater than 50% of the patient reading above an 8th grade level, and hemoglobin Al c in our study population was relatively low and perhaps not reflective of the degree of glycemic control in the general population. While these results may make it difficult to compare the results of our study to the results of other previously published studies exploring the
I
;relationship between literacy and diabetes control, there are some interesting findings worth discussion.
Just as age was associated with literacy in bivariate analysis, it was also associated with hemoglobin Ale: as age increased, hemoglobin Ale decreased. The degree of correlation (r
=-0.1729), however, is probably not clinically significant. Possible explanations for this trend for lower hemoglobin AI c with increasing age are that people with worse diabetic control die at younger ages, elderly people may be more likely to have worse nutrition, and older people may have better compliance to their medications.
hemoglobin Ales than those who lived with someone else. These results raise questions about the importance of social support in diabetes control and the effect oflocus of control on diabetes self-management. Previous studies have shown that increased social support is associated with
lower hemoglobin Alc26•27 and higher adherence to diabetic regimens28 Other studies have
L
shown that internal locus of control interacts with social support and may also be associated with adherence to diabetes regimen29, though the associations were modest. The results of our study
suggest that social support and locus of control are related to diabetes control, although the direction of the association seem to conflict with the results of previous studies. Follow-up studies using more precise measures of social support and locus of control are needed to further dissect the association between social support and locus of control on diabetic control.
Our study found no relationship between reading ability as measured by the shortened
I
REALM and diabetes control as measured by hemoglobin AI c. This finding is consistent with the results of Williams et al18 who also found no relationship between level ofliteracy and hemoglobin Ale. However, while we found no difference in hemoglobin Ale between those with greater than an 8th grade reading level and those with less than an 8th grade reading level, Williams et al found a trend, though not statistically significant, for lower hemoglobin Ale with higher level ofliteracy. One difference between this present study and the study by Williams et al is the method used to measure literacy; REALM versus TOFHLA. The REALM and the shortened REALM are purely tests of reading ability, testing the ability of the subject to pronounce written words while the TOFHLA is a test of both reading ability and reading comprehension of health care related materials. While the
REALM
and TOFHLA have acorrelation coefficient of0.819•21, and using one test should yield similar results as using the other
relationship between literacy and biological markers of glucose control due to the fact that the TOFHLA actually measures reading comprehension.
Using a less precise measure ofliteracy may have affected our study results, but literacy may have failed to show an impact on diabetic control in both our study and the study by Williams et al because knowledge of diabetes self-management does not necessarily translate to practice of self-management skills. Other studies have found that knowledge among patients with diabetes is directly correlated with literacy level10-'8, but literacy level was not significantly
associated with biological markers of diabetes control. This finding is in agreement with other studies that have shown that knowledge is only weakly or not at all associated with disease outcomes or adherence30"32 If higher levels ofliteracy are associated with greater degrees of
knowledge about diabetes self-management but knowledge of diabetes self-management does not necessarily translate to compliance with diabetes self-management, levels of literacy may not be expected to be directly associated with biological measures of diabetic control such as
hemoglobin Ale. Levels ofliteracy, however, may be expected to be associated with other markers of knowledge of diabetes self-management such as utilization of emergency health care services.
As discussed above, one possible explanation for the lack of direct association between literacy and diabetes control is that the patient population sampled in our study may not be an adequate representation of the general diabetic population. Because our recruitment was done in the outpatient clinics of the VA, we sampled patients who are relatively healthy, are established
into a formal health care system, and have some means to receive health care. Patients who
more likely to have higher hemoglobin Ale's and lower levels of literacy. This inadequate sampling may explain the high levels ofliteracy in our study: those who have higher levels of literacy are more likely able to navigate the sometimes complicated processes needed to become and remain a patient in the VA health care system. The few studies that have examined the
relationship between literacy and diabetes knowledge or diabetes control have recruited patients i_ in the outpatient setting. Perhaps a more accurate relationship between literacy and diabetes
control would be uncovered if future studies included a population of diabetic patients with more variability in literacy level, diabetes control, and degrees of health. This could be accomplished by including both inpatients and outpatients in the study population.
Finally, not all diabetes self-management education programs lead to improved glycemic control8, but diabetes education is imperative, nonetheless, because of the potential lethal
I
complications associated with diabetes such as hypoglycemia and diabetic ketoacidosis. In addition, diabetes is a significant and growing public health problem with rising prevalence and incidence rates. Long-term complications of diabetes result in significant morbidity and health care cost in the U.S., and diabetes self-management education remains an important
responsibility of the health care provider to prevent rising morbidity and health care costs. Assuming that the results of our study are real, there are significant implications for prevention strategies from a public health perspective. If higher levels ofliteracy are associated with more diabetes knowledge, but increased knowledge does not lead to change in self-care behavior, more research and funding must be invested in finding effective tools to promote health behavior
change in diabetic patients. Insight into the types of tools that could be utilized may be provided
literacy is associated with knowledge and behavior change cannot occur without knowledge, increased literacy in our society among diabetics is an important public health goal that must be pursued to decrease morbidity and health care costs. Perhaps literacy programs should be integrated into the health care setting to help improve knowledge and thus decrease the incidence oflife-threatening complications of diabetes.
References
1. Centers for Disease Control and Prevention. National diabetes fact sheet: general information and national estimates on diabetes in the United States, 2000. Atlanta, GA: U.S. Department of Health and Human Services, Centers for Disease Control and Prevention, 2002. http://www.cdc.gov/diabetes/pubs/estimates.htmltprev
2. UKPDS group. Intensive blood-glucose control with sulphonylureas or insulin compared with conventional treatment and risk of complications in patients with type 2 diabetes (UKPDS 33). Lancet 1998 September 12; 352:837-853.
3. Reichard P, Berglund B, Britz A, Cars I, Nilsson BY, Rosenqvist U. Intensified conventional insulin treatment retards the microvascular complications of
insulin-dependent diabetes mellitus (IDDM): the Stockholm Diabetes Intervention Study (SDIS) after 5 years. JintemMed 1991; 230:101-08.
4. DCCT Research Group. The effect of intensive treatment of diabetes on the development and progression oflong-term complications in insulin-dependent diabetes mellitus. N Eng! J Med 1993; 329:977-86.
5. Ohkubo Y, Kishikawa H, Araki E, Miyata T, Isarni S, Motoyoshi S, et al. Intensive insulin therapy prevents the progression of diabetic microvascular complications in Japanese patients with non-insulin-dependent diabetes mellitus: a randomized prospective 6-year study. Diab Res and Clin Prac 1995; 28:103-117.
6. American Diabetes Association: Clinical Practice Recommendations 1998. Diabetes Care 1998; 21(Suppl1): http://www.diabetes.org/DiabetesCare/Supplement198/S95.htm. 7. Miller LV, Goldstein J, Nicolaisen G. Evaluation of patients' knowledge of diabetes
self-care. Diabetes Care 1978; 5:275-80.
8. Mulrow C, BaileyS, Sonksen PH, Slavin B. Evaluation of an audiovisual diabetes education program: negative results of a randomized trial of patients with non-insulin-dependent diabetes mellitus. J Gen Intern Med 1987; 2:215-219.
9. Kirsch I, Jungeblut A, Jenkins L, Kolstad A. Adult literacy in America: a first look at the national adult literacy survey. Washington DC: National Center for Educational
Statistics, US Department ofEducation, 1993.
10. Williams MV, Parker RM, Baker DW, Parikh NS, Pitkin K, Coates WC, et al.
Inadequate Functional Health Literacy Among Patients at Two Public Hospitals. JAMA 1995 Dec 6; 274(21):1677-1682.
I
.
11. Parker R, Baker D, Williams M, Nurss J. The Test of Functional Health Literacy in Adults (TOFHLA): a new instrument for measuring patients' literacy skills. J Gen Intern Med. 1995; 10:537-545.
12. Nurss JR, El-Kebbi IM, Gallina DL, Ziemer DC, Musey VC, Lewis S, et al. Diabetes in Urban African-Americans: Functional Health Literacy of Municipal Hospital Outpatients with Diabetes. Diabetes Educator 1997 Sep/Oct; 23(5):563-568.
13. Weiss BD, Hart G, McGee DL, D'Estelle S. Health Status of Illiterate Adults: Relation Between Literacy and Health Status Among Persons with Low Literacy Skills. J Am Board Fam Pract 1992; 56:257-64.
14. Tests of adult basic education. Monterey, CA: CTB/McGraw-Hill, 1976.
15. Chapman BE, Copemn KL, Schulz L, Schulz C. The Matt basic language skills programs. Niles, MI: Allied Educational Press, 1981.
16. Carter WB, Bobbitt RA, Bergner M, Gilson BS. Validation of interval scaling: the sickness impact profile. Health Serv Res 1976; 11:516-28.
17. Baker DW, Parker RM, Williams MV, Clark WS, Nurss J. The Relationship of Patient Reading Ability to Self-Reported Health and Use of Health Services. Am J Public Health 1997 June; 87(6):1027-1030.
18. Williams MV, Baker DW, Parker RM, Nurss JR. Relationship of Functional Health Literacy to Patients' Knowledge of Their Chronic Disease. Arch Intern Med 1998 Jan 26; 158:166-72.
19. Parker RM, Baker DW, Williams MV, Nurss JR. The Test of Functional Health Literacy in Adults: A new instrument for measuring patients' literacy skills. J Gen Intern Med 1995; 10:537-541.
20. ETDRS Research Group. Early Treatment Diabetic Retinopathy Study Design and Baseline Patient Characteristics. Ophthalmology 1991; 98:741-756.
21. Davis TC, Crouch MA, Long SW, JackSon RH, Bates P, George RB, et al. Rapid Assessment of Literacy Levels of Adult Primary Care Patients. Fam Med 1991; 23:433-5.
22. Davis TC, Long SW, Jackson RH, Mayeaux EJ, George RB, Murphy PW, et al. Rapid estimate of adult literacy in medicine: a shortened screening instrument. Fam Med 1993; 25:391-5.
23. STAT A Version 5. College Station, Tex: STAT A Corp; 1993.
24. Norman GR, Streiner DL. Biostatistics: The Bare Essentials. 2"d ed. Hamilton, Ontario: BC Decker Inc; 2000.
L
25. Hawthorne K, Tomlinson S. Pakistani Moslems with Type 2 diabetes mellitus: effect of sex, literacy skills, known diabetic complications and place of care on diabetic
knowledge, reported self-monitoring management and glycaemic control. Diabetic Medicine 1999; 16:591-597.
26. Fukunishi I, Horikawa N, Yamazaki T, Shirasaka K, Kanno Kazuo, Akimoto M.
Perception and Utilization of Social Support in Diabetic Control. Diab Res and Clin Prac 1998; 41:207-211.
27. Schafer LC, McCaul KD, Glasgow RE. Supportive and Nonsupportive Family Behaviors: Relationships to Adherence and Metabolic Control in Persons with Type I Diabetes. Diabetes Care 1986 March-April; 9(2): 179-185.
28. #G- Garay-Sevilla MA, Nava LE, Malacara JM, Huerta R, Diaz de Leon J, Mena A, et al. Adherence to Treatment and Social Support in Patients with Non-Insulin Dependent Diabetes Mellitus. J ofDiabetes and Its Complications 1995; 9:81-86.
29. #F- Tillotson LM, Smith MS. Locus of Control, Social Support, and Adherence to the Diabetes Regimen. Diabetes Educator I 996 Mar/ Apr; 22(2): 133-139.
30. Dunn S, Beeney L, Hoskin P, Turtle J. Knowledge and attitude change as predictors of metabolic improvement in diabetes education. Soc Sci Med. 1990;31: 1135-1141.
31. McCaul K, Glasgow R, Shafer L. Diabetes regimen behaviors: predicting adherence. Med Care 1987; 25:868-881.
32. Benney L, Dunn S. Knowledge improvement and metabolic control in diabetes education: approaching the limits. Patient Educ Counsel 1990; 16:217-229.
l
L
'
~-DEMOGRAPHICS
1. Could you conimn your current address?
2. Could you conimn your current phone number?
3. When would be the best time to contact you by telephone to complete the interview?
4. Do you get medication from other places besides a PCS participating pharmacy?
4a. H yes, where else?
5. What is your current age?
6. What is your date of birth? 7. Gender:
8. What is your current marital status?
Yes [1]
No [2]
Don't know/Refuse [9]
Married
Divorced/Separated Widowed
Never Married Don't know/Refused
Male [1] Female [2]
[1]
[2]
[3]
[4]
[9]
9. Are you white, black, Alaskan, American Indian, Asian, or Pacific Islander?
White [1]
Black [2]
Alaskan/American Indian [3]
Asian/Pacific Islander [ 4]
Don't know/Refused [9]
I
Yes [1]
No [2]
Don't know/Refused [9]
11. Do you live:
Alone [l]
With spouse, other relative, or friend [2] With a housekeeper or personal aide [3] Don't know/Refused [9]
12. What is the highest grade or year of school that you completed?
1-6 grade [1] 7-9 grade [2] 10-11 grade [3] High School/GED [4] Some Vocational School [5] Some College [6]
College [7]
Some Graduate or
Professional School [8] Don't know/Refused [9]
13. How many persons, including yourself, live in the household where you reside? _ _
14. H needed, is there someone who could help you with tasks such as taking you to the
doctor, fixing lunch, home repairs?
Yes No
Don't know/Refused
[1]
[2]
[9]
15. Would this person be able to help you for as long as you needed him/her or for only a short period of time?
16. Are you currently employed?
Yes [1]
No [2]
Don't know/Refused [9]
17. Without giving exact dollars, how would you describe your household's imancial
situation right now?
(read choices 1-4)
Would you say that ...
1. After paying the bills, you still have enough money for special things that you want. 2. You have enough money to pay the bills, but little spare money to buy extra or special
things.
3. You have money to pay bills, but only because you have to cut back on things. 4. You are having difficulty paying the bills, no matter what you do.
18. How frequently do you exercise a week on average?
19. Do you currently smoke cigarettes?
Never
1-2
3-4 5-6
2_7
[1]
[2]
[3]
[4]
[5] Don't know/Refused [9]
Yes [1]
No [2]
Don't know/Refused [9]
19a. If yes, how many cigarettes do you smoke on average?
~-t
r
APPENDIX2
RAPID ESTIMATE OF ADULT LITERACY IN MEDICINE
Please read as many words as you can. Some of the words may be
difficult. Skip words if you would like.
List 1
List2
List 3
fat
fatigue
allergic
flu
pelvic
menstrual
pill
jaundice
testicle
dose
infection
colitis
eye
exercise
emergency
stress
behavior
medication
smear
prescription_
occupation
nerves
notify
sexually
germs __
gallbladder __
alcoholism
meals
calories
irritation
disease_
depression
constipation
cancer __
miscarriage __
gonorrhea
caffeine
-
pregnancy
inflammatory
attack
arthritis
diabetes
kidney_
nutrition
hepatitis
hormones
menopause
antibiotics
herpes_
appendix
diagnosis
seizure
-
abnormal
potassium
bowel
syphilis
anemia
asthma
hemorrhoids
-
obesity
rectal
nausea
osteoporosis
incest
directed
impetigo
I_
l
!
L
l
~
APPENDIX3
ETDRS Visual Acuity Worksheet: Right Eye/Chart 1
Patient
I
DateCircle each letter the patient identifies correctly, and record the total mnnber of correct letters for each row in the
colnmn at the right. Begin with a testing distance of 4 meters. If the total number of! etters read correctly by an eye
is less than 20 at 4 meters, then move the patient to a testing distance of I meter and retest the first six rows of the
chart. Before testing is begnn at 1 meter, add +0.75 sphere to the distance correction in the trial frames. If an eye
correctly reads 20 or greater letters at 4 meters, testing need not be performed at 1 meter.
Row 1 2 3 4 5 6 7 8 9 10 11 12 13 14 Acuity Equivalent 20/200 20/160 20/125 20/100 20/80 20/63 20/50 20/40 20/32 20/25 20/20 20/16 20/13 20/10
Chart 1 Letters NCKZO RHSDK DOVHR CZRHS ONHRC DKSNV ZSOKN CKDNR SRZKD HZOVC NVDOK VHCNO SVHCZ OZDVK
Number Row Acuity Chart 1 Correct at Equivalent Letters
4 meters
1 20/800 NCKZO 2 20/640 RHSDK 3 20/500 DOVHR 4 20/400 CZRHS 5 20/320 ONHRC 6 20/252 DKSNV Total Number Correct at 1 meter
Total Number Correct at 4 meters
ETDRS VISUAL ACUITY SCORE
a. Total number correct at 4 meters
-b. If above 2 20, add 30
c. Total number correct at 1 meter (If not tested, record a zero)
Visual Acuity Score -(sumofa+b+c)
Number Correct at
1 Meter
APPENDIX4
ETDRS Visual Acuity Worksheet: Left Eye/Chart 2
Patient
I
DateCircle each letter the patient identifies correctly, and record the total number of correct letters for each row in the
column at the right. Begin with a testing distance of 4 meters. If the total number of letters read correctly by an eye
is less than 20 at 4 meters, then move the patient to a testing distance of 1 meter and retest the first six rows of the
chart. Before testing is begno at 1 meter, add +0.75 sphere to the distance correction in the trial frames. If an eye
correctly reads 20 or greater letters at 4 meters, testing need not be performed at 1 meter.
Row Acuity Chart 1 Number Row Acuity Chart 1 Equivalent Letters Correct at Equivalent Letters
4 meters
20/200 DSRKN 1 20/800 DSRKN
20/160 CKZOH 2 20/640 CKZOH
20/125 ONRKD 3 20/500 ONRKD
20/100 KZVDC 4 20/400 KZVDC
20/80 VSHZO 5 20/320 VSHZO
20/63 HDKCR 6 20/252 HDKCR
20/50 CSRHN
1 2 3 4 5 6 7 8 9 10 11 12 13 14
20/40 SVZDK Total Number Correct at 1 meter 20/32 NCVOZ
20/25 RHSDV 20/20 SNROH 20/16 ODHKR 20/13 ZKCSN 20/10 CRHDV Total Number Correct at 4 meters
ETDRS VISUAL ACUITY SCORE
a. Total number correct at 4 meters b. If above ~ 20, add 30
c. Total number correct at 1 meter (If not tested, record a zero) Visual Acuity Score
(sumofa+b+c)
Number Correct at
1 Meter