A multi commodity pickup and delivery open tour m-TSP
formulation for bike sharing rebalancing problem
S. Mohammad Arabzad1, Hadi Shirouyehzad2*, Mahdi Bashiri3, Reza Tavakkoli-moghaddam4, Esmaeil Najafi5
1
Department of Industrial Engineering, Science and Research Branch, Islamic Azad University, Iran
2
Department of Industrial Engineering, Najafabad Branch, Islamic Azad University, Najafabad, Iran
3
Department of Industrial Engineering, Shahed University, Tehran, Iran 4
School of Industrial Engineering, College of Engineering, University of Tehran, Iran 5
Department of Industrial Engineering, Science and Research Branch, Islamic Azad University, Tehran, Iran
[email protected], [email protected], [email protected], [email protected], [email protected]
Abstract
Bike sharing systems (BSSs) offer a mobility service whereby public bikes, located at different stations across an urban area, are available for shared use. An important point is that the distribution of rides between stations is not uniformly distributed and certain stations fill up or empty over time. These empty and full stations lead to demand for bikes and return boxes that cannot be fulfilled leading to unsatisfied and possibly even lost customers. To avoid this situation, bikes in the systems are redistributed by the provider. In this paper, a mathematical model is proposed to rebalance the stations employing non-identical trucks based on travelling salesman problem (TSP) formulation. This model is categorized as static repositioning where the demands of stations in one period are considered. In the mentioned model, several types of bikes have been considered in BSSs and it is assumed that there are two depots, and the trucks start from one and return to another one. Finally, a numerical example confirms the applicability of the proposed model. The results show that the model would simultaneously obtain the minimum paths, the minimum implementing truck’s costs and the minimum ofloading/unloading bikesprogram.
Keywords: Bike Sharing Systems (BSSs), rebalancing, travelling salesman
problem (TSP), mathematical programming.
1- Introduction
Bike-Sharing Systems (BSSs) allow individuals to rent a bicycle at automatic rental stations scattered around a city, use them for a short journey, and return them to any other station in that city (Raviv and Kolka, 2013).
*Corresponding author.
ISSN: 1735-8272, Copyright c 2016 JISE. All rights reserved Journal of Industrial and Systems Engineering Vol. 9, No. 3, pp 70-81
BSSs have grown rapidly in the past decade. Although the concept has been around since the 1960s, the number of cities offering BSSs has increased from just a handful in the late 1990s to over 800 at the time of publication (Meddin and DeMaio, 2015). Compared to private automobiles, BSSs offer a number of environmental and social benefits. These include reduction in energy use, air and noise pollution, and congestion levels on specific corridors and access routes to public transport stops (Martens, 2004).
A rental station typically includes one terminal and several bike stands. The terminal is a device capable of communicating with the electronic lockers, which are attached to the bike stands. When a user rents a bike, a signal is sent to the terminal that the locker has been vacated. A user can return a bike to a station only when there is a vacant locker. All rental and return transactions are recorded and reported in real time to a central control facility. Thus, the state of the system, in terms of the number of bikes and number of vacant lockers available at each station, is known to the operator in real time. Moreover, operators of BSSs make this information available to the users online.
A crucial factor in the success of a BSS is its ability to meet the fluctuating demand for bikes at each station. In addition, the system should be able to provide enough vacant lockers to allow the users to return the bikes at their destinations. Indeed, one of the main complaints heard from users of BSSs relates to unavailability of bikes and (even worse) unavailability of lockers at their destination, see, e.g., Shaheen and Guzman (2011) and media reports Brussel (2010) and Tusia-Cohen (2012). Persistent unavailability of bikes and/or lockers engenders distrust among the system’s users and could eventually lead them to abandon it.
Repositioning of bikes in the system involves routing decisions concerning the vehicles, starting from and returning to the depot. The latter involves determining the number of bikes to be removed or placed in each station on each visit of the vehicles. Ideally, the outcome of this operation would be to meet all demand for bikes and vacant lockers (Raviv et al., 2013).
The repositioning operation can be carried out in two different modes: one is during the night when the usage rate of the system is negligible; the other is during the day when the status of the system is rapidly changing. We refer to the former as the static bike repositioning problem (SBRP) and to the latter as the dynamic bike repositioning problem (DBRP). Some operators use static repositioning, some dynamic, and some use a combination of the two, Calle´ (2009).
In this paper, a mathematical model is proposed to rebalance the bike stations’ demands as static modelling. The proposed model is based on the travelling salesman problem (TSP) considering flow rate between the bike stations.The mathematical modelling extends the recentlypublished research by Dell’Amico et al. (2014). In the basis model, open-tour TSP concept (a tour in which the travelling-man does not come back to the initial city) was used to rebalance the bikes throughpre-determinedtours, but, the number of tours in this research aredeterminedbased on the parameters and limitations.Moreover, some identical trucks were considered for rebalancing in the basic model,while, in the present research, there are some non-identical trucks in different implementing costs and various capacities. Based on the demands, the appropriate types of trucks (different in their capacities) are selected to rebalance the demands. The other main extension is considering different types of bikes in the BSS. Each bike types is picked-up and dropped-off in each station and the trucks are able to circulate them between stations to rebalance the stations.
The rest of this paper is organized as follows: in Section 2 we review the literature, describing related researchesinvarious application areas of BSS. In Section 3, we present our modelling formulation by specifying the underlying assumptions and the chosen objective function. In Section 4, a numerical example is presented to show the applicability of the proposed model. Also, the results of the model are illustrated in this section. In Section 5, we discuss some of our assumptions and their implications. In section 6, research limitations and possible extensions and directions for further research are presented.
2- Literature review
Modern BSSs have become prevalent only in the last few years; therefore, the existing literature analyzing these systems is relatively new. There are various interesting research questions concerning the establishment, operation and analysis of BSSs. Indeed, some works study strategic problems, such as Shu et al. (2010), and Lin and Yang (2011) who addresses the question of bike rental stations’
capacity and locations. Others present empirical analysis, DeMaio (2009) and Hampshire and Marla (2011). Vogel and Mattfeld (2010) present a stylized model to assess the effect ofdynamic repositioning efforts on service levels. Their model is useful for strategicplanning but is not detailed enough to support repositioning operations.
Several approaches have recently been developedto modeling and optimizing the repositioning problem. There are essential differences between them in the underlying assumptions concerning the perceived system’s behavior and the problem’s objective, as we discuss next. Fu (2002) presented an inventory model suitable for the management of bike rental stations. Hernández-Pérez and Salazar-González (2004a) introduced the one-commodity pickup and delivery traveling salesman problem (PDTSP), a generalization of the well-known TSP where each customer has supply or demand of a given amount of a single product. One vehicle of a given capacity must visit each customer and the depot exactly once, picking up units of the product from customers with supply and delivering it to customers with demand, while minimizing the total travel distance. They present an ILP model for this problem and describe a branch and cut procedure for solving it. Hernández-Pérez and Salazar-González (2004b) presented heuristic methods for the problem and demonstrated their applicability for instances with up to 500 nodes. Brake et al. (2007) presented four models for the bike-sharing rebalancing problem, considering a fleet of capacitated vehicles; they proposed customized branch-and-cut algorithms to solve the models. Louveaux and Salazar-González (2009) considered the 1-PDTSP with stochastic demand or supply. They study the problem of finding the smallest vehicle capacity that assures feasibility, i.e., being able to satisfy all demands; for a given vehicle's capacity they search for a tour which minimizes the objective function which includes a penalty that is proportional to the unsatisfied demand.Benchimol et al. (2011) studied a one commodity pickup and delivery problem under the assumptions of a single vehicle and no time constraint. The goal is to minimize the total travel distance of the vehicle while completing a prescribed repositioning task. Chemla et al. (2013) describes a branch-and-cut algorithm for solving a relaxation of the problem, from which a solution is obtained through a Tabu search.Sayarshad et al. (2012) generated a multi-periodic mathematical model to optimize bike-sharing system design in small communities by determining minimum required bike fleet size with minimum unmet demands and unutilized bikes. Fricker and Gast (2012) study the system’s behavior and the effect of various load-balancing strategies on their performances. They conclude that in asymmetric systems, repositioning of bikes by trucks is necessary even when an incentive mechanism to self-balance it is put in place.Schalekamp and Behrens (2013) developed mathematical programming models to determine the optimal daily allocation of bicycles to stations in a bike-sharing system.Chemla et al. (2013) considered bike distribution between stations as a pick-up and delivery problem, and presented some algorithms for solving the rebalancing problem in bike-sharing systems.Dikas and Minis (2014) formulated the static repositioning problem as an MILP and presented two different models, one arc-indexed and the other time-indexed, whose objective functions include user satisfaction with the system and operating costs. Dell’Amico et al. (2014) presented four mixed integer linear programming formulations of BSSs problem in which a fleet of capacitated vehicles is employed in order to re-balance the bikes with the objective of minimizing total cost.
3- Model Formulation
Suppose a complete graph = ( , ), where the set of vertices = {0,1, … , + 1} is partitioned into the depots(vertices 0 and + 1 as primary and secondary depots, respectively), and the stations, vertices {1, … , }. Each station i has a request of bike type b( ), which can be either positive or negative.If > 0, then i is a pickup node where bikes must be removed; if < 0 then i is a delivery node where bikes must be supplied. The bikes removed from pickup nodes can either go to a delivery node or back to the secondarydepot. Bikes supplied to delivery nodes can either come from the primarydepot or pickup nodes. A fleet of m non-identical trucks of capacity is available at the primarydepot to rebalance the stations. Also, traveling cost is associated with each arc( , ) ∈
. The BSS problem involves determining how to drive at most mtrucks through the graph, with the aim of minimizing the total cost (containing costs of journey between stations, implementing trucks and loading/unloading bikes)and ensuring that the following constraints are not violated: (i) each truck performs a route that starts and ends at the depot, (ii) each truck starts from the primary depot
empty or with some initial load (i.e., with a number of bike type bthat vary from 0 to ), (iii) each station is visited exactly once and its request is completely fulfilled by the truck visiting it, and (iv) the sum of requests of the visited stations plus the initial load is never negative or greater than
in the route performed by a truck.
In our study, each request is computed as the difference between the number of bike type b present at station i when performing the redistribution, and the number of biketype b in the station in the final required configuration. Note that, we impose a station with request = (0,0) must be visited, even if this implies that no bike has to be dropped-off or picked-up there. This case arises, for example, when the driver of the truck is supposed to check that the station is correctly working. The case in which stations with null requests have to be skipped can be simply obtained by removing in a preprocessing phase those stations from the set of vertices.
The fact that each truck is allowed to start its route with some bikes enlarges the space of feasible BSS problem solutions, and allows obtaining a more flexible redistribution plan. Note also that we do not impose the sum of redistributed bikes to be null, and hence, there can be a positive or a negative flow of bikes on the depot. This consideration is useful to model cases in which some bikes enter or leave the depot for maintenance.
The traveling cost is computed in our case as the shortest length of a path in the road network connecting i and j, for ( , ) ∈ . It is important to work on a directed graph, because all BSSs we are aware of are located in urban areas, and thus one-way streets typically have a strong impact on the choice of the routes performed by the trucks during the redistribution.
In this section we present an integer linear programming (ILP) formulation for BSS problem. Also, model notations, parameters and variables are presented.
3-1- Notations
Symbols Definition
v Set of vertices
Set of vertices except the depots A Set of arcs
n Number of stations (Stations 0&n+1 are depots) k Truck types
b Bike types
Capacity of trucktypek from bike typeb Demand of bike typeb at vertexj Cost (distance)of the arc (i,j)
Total demand of stations for bike type b
! Initial cost of implementing truck typek
" The load/unload cost (duration) for each bike 3-2-Variables
Symbols Definition
# Taking value 1 if arc (i,j) is used by trucktypek
$ Flow over arc (i,j) for bike type b with truck type k
3-3- Mathematical Modeling
& ' ' ' #
∈() ∈()
+ ' ! . % + ' ' ' ' ". $
∈() ∈()
(1)
s.t.
' ' # = 1
∈()
∀ ∈ ) (2) ' ' # = 1
∈()
∀ ∈ ) (3)
' ' # = ' ' #,./0,
∈()1
∈()1
(4) ' ' ' # ≤ |5| − 1 ∀|5| ⊆ )
∈8
; 5 ≠ ∅
∈8
(5) ' '=$ − $ > =
∈()
∀ ∈ ) ; ? (6)
' ' $ ≥ max {0, − }
∈()1
∀ ? (7)
' ' $,./0, ≥ max {0, }
∈()1
∀ ? (8) maxG0, , − H# ≤ $ ≤ minG5 , 5 + , 5 − H # ∀( , , K) ∈ L; ? (9) ' # ≤ 1 , ∈ ) (10)
# + ' # + ' ' # N N
N
≤ 1
N
∀( , , K) ∈ O, ≠ 1 , P ≠ Q R P≠ (11)
' ' ' $ ≤ . %
∈() ∈()
∀K (12) # , % ∈ {0,1} (13)
Objective function (1) is comprised of three sections; minimizing the sum of traveling cost (distance), the constant cost of implementing trucks and the load/unload cost. Constraints (2) and (3) impose that every node but the depot is visited exactly once. Constraint (4) ensures that the number of trucks leaves the primary depot must be equal to all trucks that are used return to the secondary depot at the end of their tour. Constraint (5) is the classical sub-tour elimination constraints, see, e.g., Gutin & Punnen (2002) that impose the connectivity of the solution. Constraint (6) models the balance of the flows on the arcs entering and leaving a given node. The total load leaving the primary depot should be in any case non-negative, and moreover, in case takes a negative value; it must be not lower than this value. This fact is imposed by constraint (7). Similarly, constraint (8) states that the total load entering the secondary depot is in any case non-negative and not lower than the sum of all demands for bike type bin case this is positive. Constraint (9) imposes lower and upper bounds on the flows on each arc, and makes these bounds as tight as possible by considering whether or not an arc is traveled by a truck. Constraint (10) ensures that each arc is traversed at most once by whole trucks. Constraint (11) allows stations to be rebalanced by containing a tour of certain truck. Constraint (12)
uses a binary variable to select the suitable trucks to rebalance the stations. Constraint (14) novelty was developed andreplaced to theconstraint (5) to prevent containing sub-tours in fewer problem dimensions.
S − S + . ' # ≤ − 1 ∀ , ∈ ) (14)
4- Numerical example and results
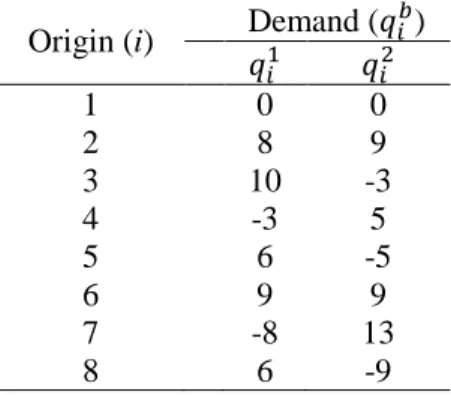
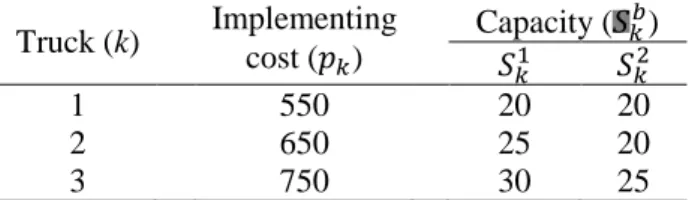
4-1- Numerical exampleIn this section, in order to show the applicability of the proposed model a numerical example is described in detail. Suppose there is a city with 8 bike stations and the goal is to rebalance the pre-determined demand in a period. There are two bike types comprised of VIP (type 1) and public (type 2) in each stationand demands for each of them are unique. Also, there are three trucks types to rebalance the flow between stations in different capacities and initial implementing costs. As a characteristic of an open-tour TSP model, the trucks start at node 0 (primary depot)in appropriate initial inventory and end at node 8 (secondary depot)with some bikes passing whole stations exactly once. The variable cost of load/unload is also considered equal to 1 dollar for each bike. Tables 3 to 5 show the parameters value for the numerical example.
Table 3. Matrix of distances between origins and destinations
Destination (j) Distance ( )
Origin (i) 1 2 3 4 5 6 7 8
1 0.00 4.47 3.61 6.71 7.81 6.40 5.83 10.1 2 4.47 0.00 2.24 2.24 3.61 2.24 3.16 5.59 3 3.61 2.24 0.00 4.00 4.47 3.16 2.24 7.16 4 6.71 2.24 4.00 0.00 2.00 1.41 3.61 3.35 5 7.81 3.61 4.47 2.00 0.00 1.41 3.00 3.04 6 6.40 2.24 3.16 1.41 1.41 0.00 2.24 4.03 7 5.83 3.16 2.24 3.61 3.00 2.24 0.00 6.02 8 10.1 5.59 7.16 3.35 3.04 4.03 6.02 0.00
Table 4. Demand of each station for each bike type Origin (i) Demand (0 T )
1 0 0
2 8 9
3 10 -3
4 -3 5
5 6 -5
6 9 9
7 -8 13
Table 5. Implementing cost and capacity of each truck
Truck (k) Implementing cost (! ) Capacity (5 )
50 5T
1 550 20 20
2 650 25 20
3 750 30 25
4-2- Solutions
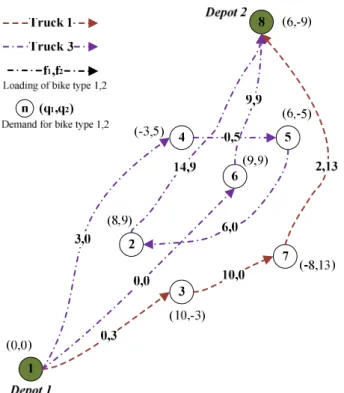
The proposed mathematical model was solved by LINGO 9.0 software in a Dual-core system with CPU 3.0 GHz and 4 GB RAM. The model was solved and global optimal solution found in reasonable time(less than 1 min)with the objective value of 1513.73.Table 6 shows the final solution of assigning appropriate truck types conducting optimized tours to rebalance the network of bike stations. As the results show, in the optimized solution, the number of three tours where conducted from depot 1 (station 1) to depot 2 (station 8). Truck types 1 and 3 were assigned to the tours in a way thattruck type 1 was chosen for one tour and truck type 3 was employed twice.Figure 1 also illustrates the results in a complete graph.
Table 6. Flow over arc (i,j) for bike type b with truck k Origin
(i)
Truck (k)
Destination (j) 1 2 3 4 5 6 7 8
Commodity (b) 1 2 1 2 1 2 1 2 1 2 1 2 1 2 1 2 1
1 0 3
2
3 3 0 0 0
2
1 2
3 14 9
3
1 10 0
2 3 4
1 2
3 0 5
5
1 2
3 6 0
6
1 2
3 9 9
7
1 2 13
2 3
Fig 1. Final Solution (assigning appropriate truck types to the most suitable tours and programming the optimum load/unload order)
5- Discussion
As in the previous sections stated, the ILP model in this paper rebalances the flow between bike stations. There are some questions among rebalancing which are dealt in this paper solving the model. For example, how many trucksof each type are needed to rebalance the stations; which truck of each typeis appropriate for these operations; what are the best sequences (tours)of visiting each station; how many bikesof each typemust be picked-up or dropped-off while visiting each station; how many bikesof each typemust be picked-up starting the journey from the primarydepot.
In this section, the results are discussed more in details to illustrate the ability of model and stability of results throughtwosensitivity analysisas study on‘the optimized solution not regarding the demands’,‘the optimized solution not regarding the distances’.So, various routing and flow programs using different trucks are obtained and compared with the final solution.
5-1- The optimized solution not regarding the demands
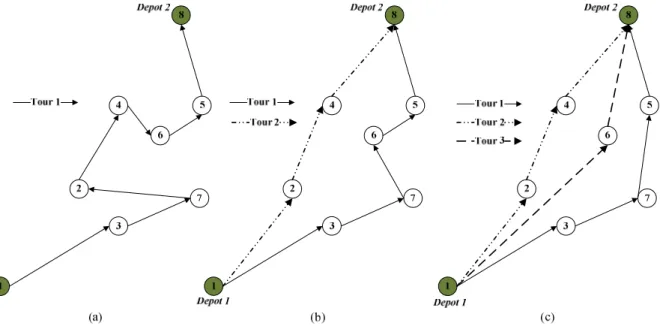
The presented model is not only able to determine the number and the type of appropriate trucks for rebalancing, but also the sequence of visiting stations (tours) for each truck. These utilities work based on the distance between stations and their demands after a period of time. Suppose that there are no demand in each stationand each station must be visited exactly onceby trucks. In this situation, the optimized solutions (routs) based on the specified number of trucks are as Figure 2.
Fig 2. The optimized routing based on the specified number of (a) one tour (b) two tours (c) three tours, andnot regarding flow rates
So, the optimized routing problem just considering the distance with specified number of tours (trucks) and not regarding the station demands were determined. The figure easily shows the minimum length of conducting one, two and three tours. Absolutely, the routs would be turned when adding the data aboutdemand of each station and related limitations in capacities.
5-2- The optimized solution not regarding the distances
Suppose a situation in which loading/unloading operation is time-consuming or complicated rather than traveling between the stations. In this condition, maybe it is possible to focus just on reduction in loading and unloading operations. Figure 3 illustrates the solution of modeling when “distance reduction” goal was omitted from the objective function.As it can be clearly seen, the distance traveled by trucks are much more rather than the final solution (Figure 1).
The results in Figure 3 highlights the situation in which transferring distance (costs) are not as important asthe costs of loading/unloadingoperation. This situation usually when occurs that the distance between the stations is neglectableand the costs (or time) of loading/unloading operation is brilliant.In this situation, the ‘cost reduction’ goal can be omitted from theobjective function. The solution states that using truck 1 and truck 3 are the best decision considering the shown routs and flow rates.
6- Conclusion
BSSs allow people to rent a bike at one of the many automatic rental stations scattered around the city, use them for a short journey and return them at any station in the city. Recently, many cities around the world established such systems in order to encourage their citizens to use bikes as an environmentally sustainable and socially equitable mode of transportation, and as a good complement to other modes of mass transit systems. In this paper, we proposed an open-tour TSP formulation for static rebalancing bikes between stations. The main characteristics of the proposed model are multiple commodities, multiple non-identical trucks, open-tour routs and static rebalancing. Detailed descriptions are stated as follows:
• This model is able to recall one or more trucks for rebalancing the network ofstations. In these circumstances, rather than determining the number of trucks before rebalancing, selecting the appropriate number of each truck typewill be surrendered to the model that is composed of one or more tours.
• The model distinguishes between the available trucks. The trucks are in different initial implementing cost and various capacities. The problem of selecting the most suitable trucks is surrendered to the model based on the need of rebalancing.
• Different types of the bikes are considered in this model to be rebalanced their inventory in stationsand the model simultaneously rebalances them with equal priority with appropriate trucks.
The most limitation of this research along with some suggestion of future research are introduced as bellow:
• In this model, primary depot sends the trucks and secondary depot receives the trucks. This limitation can be enhanced where each depot can send or receive trucks.
• The problem is modeled based on the open-tour TSP while this can be extended as a problem of selecting the best mode of open-tour or close-tour (or both).
• The model was formulated for one period while rebalancing based on the demands of several periods is much more stable.
• Some real limitations such as limitation in distance traveled by each truck and limitation in rebalancing time are neglected in this research. They can be highlighted in future researches.
• Whole demands of stationsare fulfilled in this research, while considering shortage costs this model can be extended regarding service level objective in future researches.
References
Benchimol, M., Benchimol, P., Chappert, B., De La Taille, A., Laroche, F., Meunier, F., &Robinet, L. (2011). Balancing the stations of a self-service “bike hire” system. RAIRO-Operations Research, 45(01), 37-61.
Brake, J., Mulley, C., Nelson, J. D., & Wright, S. (2007). Key lessons learned from recent experience with Flexible Transport Services. Transport Policy, 14(6), 458-466.
Brussel N (2010). Villo-bevoorradinglijdtonder files (in Dutch). Web newspaper. Publication date: 22 June 2010, Observed: 15 August 2012.
Calle´, E. (2009). Personal communication.
Chemla, D., Meunier, F., &WolflerCalvo, R. (2011). Bike hiring system: solving the rebalancing problem in the static case. Discrete Optimization (accepted).
Chemla, D., Meunier, F., &WolflerCalvo, R. (2013). Bike sharing systems: solving the static rebalancing problem.Discrete Optimization, 10(2), 120-146
Dell'Amico, M., Hadjicostantinou, E., Iori, M., &Novellani, S. (2014). The bike sharing rebalancing problem: Mathematical formulations and benchmark instances. Omega, 45, 7-19.
DeMaio, P. (2009). Bike-sharing: History, impacts, models of provision, and future. Journal of Public Transportation, 12(4), 3.
Dikas, G., & Minis, I. (2014). Scheduled paratransit transport systems. Transportation Research Part B: Methodological, 67, 18-34.
Fricker, C., &Gast, N. (2012). Incentives and regulations in bike-sharing systems with stations of finite capacity. arXiv preprint arXiv:1201.1178, 2.
Fu, L. (2002). A simulation model for evaluating advanced dial-a-ride paratransit systems. Transportation Research Part A: Policy and Practice, 36(4), 291-307.
Gutin, G., &Punnen, A. P. (Eds.). (2002). The traveling salesman problem and its variations, Vol. 12. Springer Science & Business Media.
Hampshire R, Marla L (2011) An empirical analysis of bike-sharing systems. Working paper
Hernández-Pérez, H., & Salazar-González, J. J. (2004a). A branch-and-cut algorithm for a traveling salesman problem with pickup and delivery. Discrete Applied Mathematics,145(1), 126-139.
Hernández-Pérez, H., & Salazar-González, J. J. (2004b). Heuristics for the one-commodity pickup-and-delivery traveling salesman problem. Transportation Science, 38(2), 245-255.
Lin, J. R., & Yang, T. H. (2011). Strategic design of public bicycle sharing systems with service level constraints. Transportation research part E: logistics and transportation review,47(2), 284-294.
Louveaux, F., & Salazar-González, J. J. (2009). On the one-commodity pickup-and-delivery traveling salesman problem with stochastic demands. Mathematical programming,119(1), 169-194.
Martens, K. (2004). The bicycle as a feedering mode: experiences from three European countries. Transportation Research Part D: Transport and Environment, 9(4), 281-294.
Meddin, Russell, and Paul DeMaio. "The bike-sharing world map." URL http://www. metrobike. net (2012).
Raviv, T., & Kolka, O. (2013). Optimal inventory management of a bike-sharing station. IIE Transactions, 45(10), 1077-1093.
Raviv, T., Tzur, M., & Forma, I. A. (2013). Static repositioning in a bike-sharing system: models and solution approaches. EURO Journal on Transportation and Logistics, 2(3), 187-229.
Sayarshad, H., Tavassoli, S., & Zhao, F. (2012). A multi-periodic optimization formulation for bike planning andbike utilization. Applied Mathematical Modelling, 36(10), 4944-4951.
Schalekamp, H., & Behrens, R. (2013). Engaging the paratransit sector in Cape Town on public transport reform: Progress, process and risks. Research in Transportation Economics, 39(1), 185-190. Shaheen, S., & Guzman, S. (2011). Worldwide bikesharing. Access Magazine, 1(39).
Shu, J., Chou, M., Liu, Q., Teo, C. P., & Wang, I. L. (2010). Bicycle-sharing system: deployment, utilization and the value of re-distribution. National University of Singapore-NUS Business School, Singapore.
Tusia-Cohen M (2012) Invented the wheel: first year of Tel-O-Fun (in Hebrew), Web version of the daily newspaper Maariv. Publication date: 12 April 2012, Observed at 26 August 2012.
Vogel, P., &Mattfeld, D. C. (2010, July). Modeling of repositioning activities in bike-sharing systems. In World Conference on Transport Research (WCTR).