43
The Pattern of fat distribution (waist to hip ratio) and body mass index among high school adolescents in Ilam
Meysam Behzadifar 1, 2, Zahra Vahdat Shariatpanahi3, Kourosh Sayehmiri4, Heshmatolah Nourmoradi5, Elham Ranjbar 6, Khairollah Asadollahi1, 4*
1. Department of Epidemiology, Faculty of Medicine, Ilam University of Medical Sciences, Ilam, Iran
2. Student’s Research Committee, Ilam University of Medical Sciences, Ilam, Iran
3. Department of Clinical Nutrition, Institute of Nutrition and Food Industry, Shahid Beheshti University of Medical Sciences, Tehran, Iran
4. Research Centre for Psychosocial Injuries, Faculty of Medicine, Ilam University of Medical Sciences, Ilam, Iran
5. Department of Environmental Health, Faculty of Health, Ilam University of Medical Sciences, Ilam, Iran
6. Department of Nutrition, Faculty of Medicine, Ilam University of Medical Sciences, Ilam, Iran
Abstract
Introduction: Adolescence is a critical period of growth and is influenced by different variables. The relationship between obesity in adolescence and some metabolic disorders has been reported by many studies. This study was carried out to determine the pattern of fat distribution among high school adolescents in Ilam city in 2013.
Materials and methods: In this cross-sectional study, 583 high school students were selected through a dedicated multi-stage stratified random sampling method. Weight, height, waist and hip circumferences were measured and body mass index (BMI) and weight to hip ratio (WHR) were also calculated.
Results: The prevalence of being overweight, overall obesity and abdominal obesity were 21.8 %, 0.7 %, and 39.8%, respectively. Age of the students under study showed significant positive and negative correlations with BMI and WHR, respectively (P<0.001).
Conclusion: Results of this study showed that adolescents are increasingly facing the risk of obesity and being overweight. Therefore, monitoring the health, nutrition, nutrition education, improved knowledge and sporting might help to improve this age group’s health and prevent many chronic diseases in adolescents.
Keywords: BMI, WHR, fat distribution,high school adolescents, Ilam Introduction
Adolescence is a critical developmental period (1, 2). Adolescents constitute 20 percent of the total world population and 84 percent of themlive in developing
countries (3, 4). Physical and
psychological changes during the lifetime are among the factors affecting nutritional health of adolescents (5) and ignoring these issues may lead to adverse
consequences including obesity and
* Corresponding Author: Tell: +988412227126, Fax: +988412227120
Address: Department of Epidemiology, Faculty of Medicine, Ilam University of Medical Sciences, Ilam, Iran
Email: masoud_1241@yahoo.co.uk
Received 1/12/2013; revised 20/1/2014; accepted 21/1/214
44
thinness. On the other hand, many diseases
that appear during adulthood are
developed in adolescence, with over 70 to 80 percent of obese teenager turning into obese adults (6, 7).
Obesity is the most significant health-nutrition issue in developed countries (8) and has also triggered a wakeup call in developing countries with expanding urbanization and modernization of life(9). Regardless of whether the overweight teenager develops into an overweight adult, overweight, obesity, and upper-body (abdominal) obesity during adolescence increase the risk of metabolic diseases in the later stages of life(10, 11) and can also be used as an obesity index for adulthood(9). Available statistics indicate the obesity prevalence of 21% in adolescents of developed countries (12). A study in Tehran reported an obesity and overweight prevalence of 21.3% among high school girls (13).According to a study conducted by Iranian Institution for Nutritional Research, obesity/overweight prevalence was 26% and 31%among boys and girls in Tehran, respectively (14, 15). In addition to fat mass, distribution of fat and its concentration in particular locations are among the factors leading to increased risk of obesity-related chronic diseases (16). Fat is usually distributed in body by two patterns: First, fat concentrated around stomach, also known as male obesity, which is considered as a more important factor; Second, more uniform distribution of fat, or female obesity, which is known to be less dangerous (11). Numerous studies have shown that fat distribution pattern is a more sensitive measure than body mass index (BMI) to determine the metabolic conditions that may result in obesity, and different methods have been proposed to measure this distribution, with the simplest one being the waist-to-hip ratio (WHR) (17). Few studies have examined WHR, particularly in children and adolescents. A study on high school girls in Tehran indicated a rate of 7.7% for abdominal obesity (18) and the rate for this
type of obesity was evaluated to be 16.4% among male adolescents in Tabriz (19). Many politicians, researchers, and health authorities around the world believe that adolescence is a valuable period of life which can be used for investment in future health. Unhealthy nutrition can result in constant increase of overweight and
obesity rate. Therefore, a correct
understanding of how teenagers eat is a high priority in research and a requirement for effective planning in order to maintain their health and help them to develop into healthy adults. Thus, the present study was conducted on high school adolescents in the city of Ilamin 2013 to identify their fat distribution pattern (waist-to-hip ratio and BMI).
Materials and methods
Using a cross-sectional approach, 583 students were recruited in the present study (265 boys and 318 girls, aging15-18 years old) from different grades at 14 high schools in Ilam through a multi-stage stratified random sampling. Once a general questionnaire was completed by the participants, anthropometric indices of each participant including weight, height, waist, and hip sizes were measured and recorded using standard methods by a trained researcher with the same gender of the participants. The participants’ barefoot heights were measured to a precision of 0.5 cm using a Seca portable board while their weights (in minimum clothing and no shoes) were measured on a Seca digital scale to a precision of 100 g. Waist
measurements were determined toa
precision 0.1 cm by placing a non-elastic tape measure around the narrowest part between the lowest rib and the iliac bone at the end of natural exhalation while hip measurement was identified using the same tape measure at the widest zone. BMI was calculated through dividing weight (in kg) by squared height (in m2) and WHR was determined by dividing
waist measurement (cm) by hip
measurement (cm), and then compared to
45
the standard measures proposed by the
World Health Organization (WHO).
According to the definitions provided by the WHO for different genders and ages,
participants were classified as
“underweight” (BMI<15th
percentile),
“normal” (between 15th
and 85th percentiles), “overweight” (between 85th
and 95th percentiles), and “obese” (BMI over the 95th percentile). Abdominal obesity was determined by defining a threshold value of equal or larger than 0.8 for WHR in females and equal or larger than 0.9 in males.
SPSS software (ver. 16) was used for data analysis. The findings were presented in the form of means± standard deviations, and percentages. Pearson correlation was used to identify the correlations between BMI and WHR as well as their correlation with other variables of interest. In this study the P-value lower than 0.05 was considered as the significance value. Results
The mean age and standard deviations of the participants were 16.19±0.98, and 54.5% of the students were female. In addition, mean and standard deviation of BMI and WHR were 21.02±3.26 and 0.82±0.045 in boys and 20.59±2.63 and 0.82±0.049 in girls, respectively with no significant difference observed in either case (p>0.05). A comparison of BMI values with the reference percentiles indicated that 69.1% of the participants were normal, 21.8% were underweight, 8.4% were overweight and 0.7% were obese. Considering BMI in both genders, 67.2% of males were normal, 20.4% were underweight, 10.9% were overweight, and 1.5% was obese while a majority of girls (70.8%) were normal and 23% and 6.3%
were underweight and overweight,
respectively. No obesity was observed among the girls and the difference between two genders was significant (p<0.05). Examining body fat mass based on WHR showed that 40% of the adolescents and 68.2% of total girls and 6% of boys had
abdominal fat with their difference being significant (p<0.05).
Most of these students (37.6%) were studying experimental science, followed by mathematics, physics, humanities, and others. Nearly half of the students (43.4%) were in the third grade, with the first grade, second grade, and pre-university in the next ranks, respectively. In terms of parent's education, most fathers (41.7%) had a university degree, followed by high school diploma, secondary school degree, elementary education, and no education. However, the majority of their mothers (28%) had high school diploma, followed
by university degree, elementary
education, secondary education, and no education. Almost half of the parents (47.9%) had an income of over 300dollars per month.
A negative significant relationship was found between BMI and WHR (p<0.01). Furthermore, age of the students was positively related to BMI and negatively related to WHR (p<0.01) (Table 1). Table 1.The correlation between body mass index (BMI) and waist-to-hip ratio (WHR) among high school adolescences based on the their age.
Variables *Age student WHR * BMI
BMI 1 - -
WHR - 0.3
(P <0.001)
1 -
Age student
0.13 (P <0.001)
- 0.11 (P <0.01)
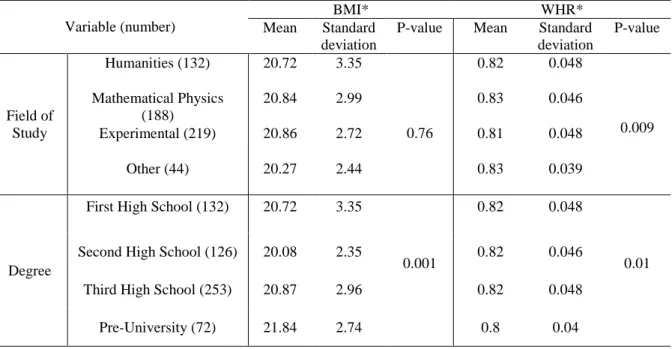
1 * Pearson correlation test (significant in P <0.05). A significant relationship was also found between BMI and student grade, parent education and income (p<0.01), with the highest BMI score belonging to pre-university students. Average BMI score was higher in students whose parents had university degrees and incomes over 300dollars per month. However, the relationship between BMI and field of study was not significant (p>0.05) (Table 2).
WHR was significantly related to the field of study, grade, mother’s education, and
46
parents’ income (p<0.05) with the lowest ratio found for pre-university experimental science students whose mothers had no
education and whose parents had an income of 500 to 900 dollars.
No significant relationship was found for father’s education (p>0.05) (Table 3).
Table 2. Relationship between body mass index (BMI) and waist-to-hip ratio (WHR) based on demographic data of participants.
Variable (number)
BMI* WHR*
Mean Standard
deviation
P-value Mean Standard
deviation
P-value
Field of Study
Humanities (132) 20.72 3.35
0.76
0.82 0.048
0.009 Mathematical Physics
(188)
20.84 2.99 0.83 0.046
Experimental (219) 20.86 2.72 0.81 0.048
Other (44) 20.27 2.44 0.83 0.039
Degree
First High School (132) 20.72 3.35
0.001
0.82 0.048
0.01
Second High School (126) 20.08 2.35 0.82 0.046
Third High School (253) 20.87 2.96 0.82 0.048
Pre-University (72) 21.84 2.74 0.8 0.04
*Pearson correlation test(significant in p<0.05).
Table 3. Relationship between body mass index (BMI) and waist-hip ratio (WHR) based on educational level and income of participants’ parents
*Pearson correlation test (significant in p<0.05). Variable (number)
BMI* WHR*
Median Minimum P-value Median Minimum P-value
Education level of father
Uneducated (41) 19.97 3.31
0.022
0.83 0.044
0.75
Elementary (67) 20.65 3.02 0.82 0.044
Cycle (86) 20.22 2.57 0.82 0.053
Diploma (146) 20.62 2.95 0.82 0.048
Collegiate (243) 21.23 2.93 0.82 0.046
Education level of mother
Uneducated (55) 19.97 2.75
0.001
0.836 0.043
0.03
Elementary (114) 20.1 2.84 0.831 0.045
Cycle (91) 20.85 2.85 0.829 0.046
Diploma (163) 20.78 2.81 0.819 0.049
Collegiate (160) 21.53 3.11 0.825 0.047
Income (1000 Tomans)
Less than 500
(104) 19.66 15.94
0.01
0.84 0.73
0.01
500 to 900 (200) 19.99 15.57 0.82 0.72
More than 900
(279) 20.76 15.94 0.82 0.68
47
Discussion
Our findings indicated BMI mean and standard deviation of 21.02±3.26 for boys and 20.59±2.63 for girls. Among boys, 10.9% and 1.5% were overweight and obese, respectively. Moreover, 6.3% of girls were overweight, but none of them had obesity. Bajan et al (9) found anoverweigh rate of 14.8% and an obesity rate of 5.3% in the subjects they studied.
In addition, Esfarjani(20) reported
overweight and obesity rates of 18.1% and 3.4%, respectively. In a study of growth parameters and prevalence of overweight and obesity among students of New Delhi, Marawaha et al. (21) reported that 16.8% of boys and 5.6% of girls were overweight and19% and 5% of them had obesity, respectively. These large differences in the findings of various studies can be attributed to the cut-off points they used for BMI percentiles and/or to the different nutritional regimens used in different societies.
In the present study, WHR mean and standard deviation were found to be 0.82±0.1 and 0.82±0.1 for male and female students, respectively while abdominal obesity was observed in 40% of the teenagers, 68.2% of girls, and 6% of boys, with a significant difference at p<0.05. In the study carried out by Bajen et al (9), 21.5% of the subjects had abdominal fat. Furthermore, abdominal obesity rate was found to be 7.7% among adolescent girls in District 6 of Tehran (18) and 16.4% among teenagers in Tabriz (19) which are not in line with our findings. Mirmiran et al (22) studied the increasing and cautioning rate of WHR in children and teenagers of Tehran over a period of 3 years. Many studies have associated the increased risk of cardiovascular diseases and their related mortality rates to WHR, as an effective BMI-independent factor (23, 24). Given the limited available data and lack of standard classification for WHR in teenagers, this study has
employed the cut-off points defined for adults (25).
Furthermore, the findings indicated a significant relationship between BMI and parents’ education which is consistent with the findings of Abtahi et al (26) who showed that students whose parents had university degrees had a higher mean of BMI rate. Studies in the United States (27) and Australia (28) have also indicated a significant relationship between these two variables. Therefore, given that the population studied here consisted of teenagers, it can be stated that the
nutritional data and behaviors of
participants were probably influenced by their parents.
Conclusion
Obesity is a risk factor associated with many diseases including cardiovascular conditions, hypertension, type2diabetes,
and premature death. Therefore,
monitoring health and nutrition during adolescence, provision of nutrition-related services and training, improving teenagers’ awareness and providing them with sport facilities and services may be helpful in improving their health as adolescents and preventing many chronic diseases during adulthood.
Acknowledgement
This study was a part of a master's thesis that was supported financially by deputy of research and technology of Ilam University of Medical Sciences and their valuable helps are acknowledged. We also appreciate the Training and Educational Directorate of Ilam province for their helps.
References
1. Spear BA.Nutrition in adolescence. In: Krause's Food, Nutrition & Diet Therapy. Mahan LK, Escott, Stumps,
48
(eds). 11th ed. Sounders:USA; 2004.P. 284-99.
2. Nemati A, Naghizade A, MH. D.
[Study Factorsa nthropometric19-7
year-old female student and
comparison with standard NCHS]. J Ardabil Uni Med Sci. 2008; 8(2): 208-2.(Persian)
3. Golden BE. Infancy, childhood and adolescence. In: Garrow Js, James WPT, Ralph A, editors. Human nutrition and dietetics. 10th ed. Churchill & Livingston; 2000.
4. Hajifaraji M, Esfarjani F, Rostaei R, Khoshfetrat MR, ZK. Anthropometric status of children in public schools in East Tehran. Iran J Nutr Food Sci Food Technol. 2007; 2(2): 43-37.
5. Rees JM. Nutrition in adolescence. In: Mahan LK, Escott-stump S (eds). Food, nutrition and diet therapy. l0th ed. Philadelphia; 2000.
6. Ortega RM, Requejo M, Andres P,
Lopes-sobaler AM, Anderes P, Ortega A, et al. Relationship between diet composition and body mass index in a group of Spanish adolescents. Brit J Nutr. 1995;74(1):765-3.
7. Mirmiran P, Azadbakht L, Azizi F. Predictive indicators of risk factors for cardiovascular disease in adolescents Tehran Lipid and Glucose Study. Res Med. 2003; 27(3):184-75.
8. Thakur N, D'Amico F. Relationship of nutrition knowledge and obesity in adolescence. Fam Med. 1999; 31(1): 122-7.
9. Bazhan M, Kalantari N, Houshiar-Rad A. Pattern of fat distribution (waist to hip ratio) and its lationship with BMI among high school girls in Lahijan. Endocr Metab Res Center. 2006; 8(2): 168-3.
10.McCarthy HD, Ellis SM, Cole TJ. Central overweight and obesity in British youth aged 11-16 years: Cross -
sectional surveys of waist
circumference. Brit Med J. 2003; 326: 626-8.
11.Cavalcanti CB1, Barros MV, Menêses AL, Santos CM, Azevedo AM, Guimarães FJ. Abdominal obesity in
adolescents: prevalence and
association with physical activity and eating habits. Arq Bras Cardiol. 2010;94(3):350-6.
12.Rickert V. Adolescent nutrition:
Assessment and management. New York: Chapman & Hall; 1996.P. 199-211.
13.Mohamadpor B, Kalantari N, Rashidi A. [The prevalence of obesity in boys and girls high school students in Tehran and other factors associated with it]. J Beheshti Uni Med Sci. 2000;12(4):241-7.(Persian)
14.Azizi F, Allahverdian S, Mirmiran P. Dietary factors and body mass index in a group of Iranian adolescents: Tehran Lipid and glucose. Study 2. Int J Vitam Nutr Res. 2001; 71(1): 123-7.
15.Mohamadpour-Ahrangani B, Rashidi
A, Karandish A, Eshraghian MR,
Kalantari NM. Prevalence of
overweight and obesity in adolescents Tehranian students, 2000-2001: an
epidemic health problem. Public
Health Nutr. 2004; 7(5): 642-8.
16.Molarius A, Seidell JC. Selection of
anthropometric indicator for
classification of abdominal fatness. A critical review. In J Obes. 1998; 22(3): 719-27.
17.Moreno LA, Fleta J, Mur L, Sarria A, Bueno M. Fat distribution in obese and nonobese children and adolescents. J Pediatr Gastroenterol Nutr. 1998; 27(2): 176-80.
18.Samadi M, Sadrzadeh-Yeganeh H,
Azadbakht L, Feizi A, Jafarian K, Sotoudeh G. Dietary calcium intake and risk of obesity in school girls aged 8-10 years. J Res Med Sci. 2012; 17(12): 1102-7.
19.Maddah M1, Eshraghian MR,
Djazayery A, Mirdamadi R.
Association of body mass index with educational level in Iranian men and
49
women. Eur J Clin Nutr.
2003;57(7):819-23.
20.Esfarjani M, Golestan B, Rasoli B, R R, Derakhshani K. [Effect of feeding program on the nutritional knowledge and practice]. Pejouhandeh. 2003; 9(1) :28-1.(Persian)
21.Marwaha RK, Tandon N, Singh Y,
Aggarwal R, Grewal K, Mani K. A study of growth parameters and prevalence of overweight and obesity in school children from Delhi. Indian J Pediatr. 2006; 43(11): 943-52.
22.Gupta N1, Shah P, Nayyar S, Misra A. Childhood obesity and the metabolic syndrome in developing countries. Indian J Pediatr. 2013; 80 Suppl 1:S28-37.
23.Oliveira CL, Veiga GV, Sichieri R.
Anthropometric markers for
cardiovascular disease risk factors among overweight adolescents. Nutr Res. 2001; 21(4): 1335-45.
24.Garaulet M, Marin C, Perez-Llamas F, Canterasl M, Tebar FJ, Zamora S. Adiposity and dietary intake in
cardiovascular risk in an obese population from a Mediterranean area. J Physiol Biochem. 2004; 60(3): 39-49.
25.Mahan LK, Escott-Stump S. Krauses’s
food, nutrition and diet therapy. Philadelphia: Saunders;2004.
26.Abtahi M, Jazayeri A, Eshraghian MR, Dorosti AR, Sadrzade H, Pouraram H.
[Comparison of overweight and
obesity in adolescent girls in your area, south of Tehran and some socio-economic factors associated]. Payesh. 2009; 8(2): 122-13.(Persian)
27.Goodman E1, Adler NE, Daniels SR, Morrison JA, Slap GB, Dolan LM. Impact of objective and subjective social status on obesity in a biracial cohort of adolescents. Obes Res. 2003; 11(8):1018-26.
28.Booth M, Macaskill P, Lazarus R,
Baur LA. Socio demographic
distribution of measures of body
fatness among children and
adolescents in New South Wales, Australia. Int J Obes Relat Metab Disord. 1999; 23(5):456-62.